NASDAQ | BEARISHNASDAQ has retraced after hitting its top.A parabolic downward shift and an obvious bearish trend tend to print a LH.It may form an ABCD pattern and a sell stop order may be placed at the breakout of LL.
USTEC trade ideas

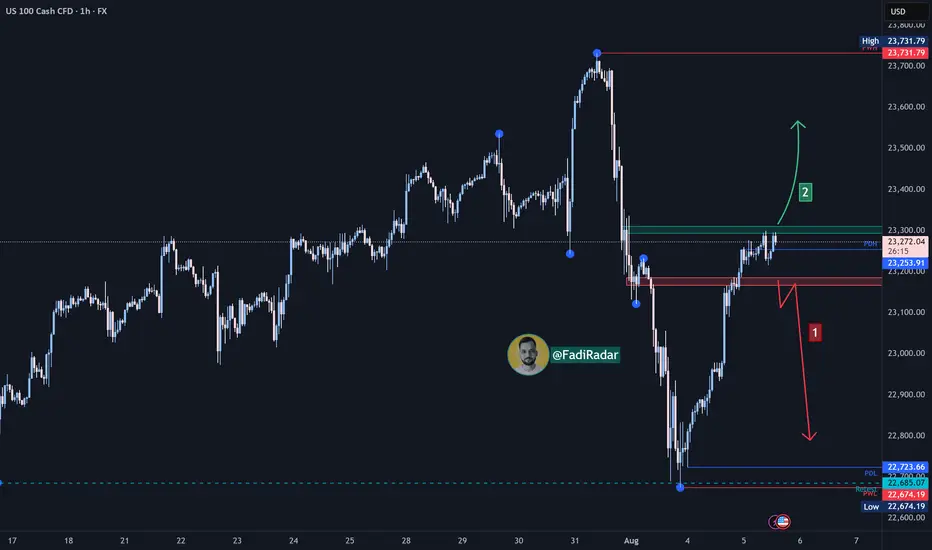
NASDAQ & NFP- I expect BullishnessHello fellow traders,
Today is NFP and I expect a bulishness as per my PD Arrays analysis. Lets se if it words out.
I have higlighted all important PD Arrays in my chart, keep an eye.
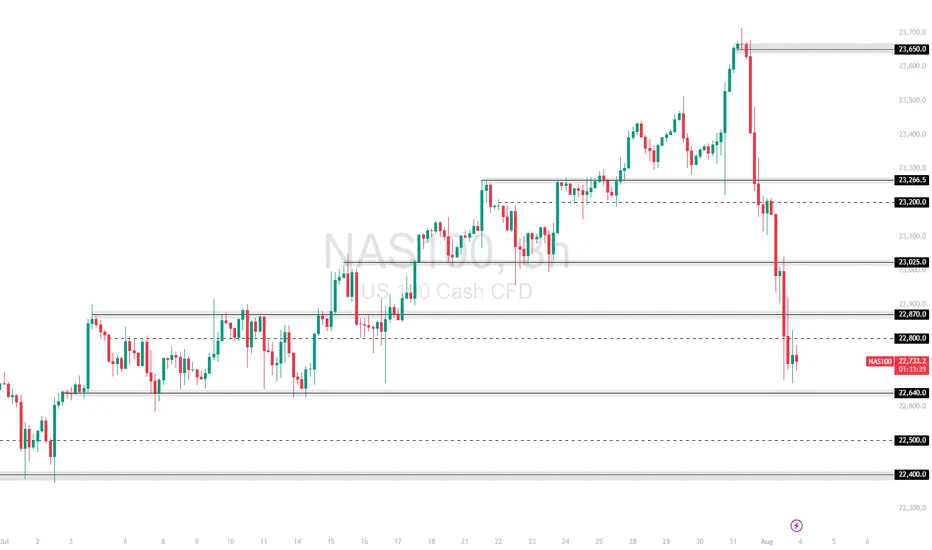
NAS100 Slammed by Fed Data and Trump Trade Remarks Can 22,640 ?The NAS100 plunged after strong US economic data fueled expectations of tighter Fed policy, and Trump's renewed push for aggressive trade deals rattled tech sentiment. After rejecting the 23,665 🔼 resistance, the index dropped sharply through multiple support levels.
Price is now consolidating just above the 22,640 🔽 zone, a key near-term support.
Support: 22,800 🔽, 22,640 🔽, 22,500 🔽
Resistance: 23,025 🔼, 23,277 🔼, 23,332 🔼
Bias:
🔽 Bearish: A breakdown below 22,640 could trigger a move toward 22,500. If that fails, 22,400 becomes the next target.
🔼 Bullish: A reclaim of 23,025 would be the first sign of bullish recovery.
📛 Disclaimer: This is not financial advice. Trade at your own risk.
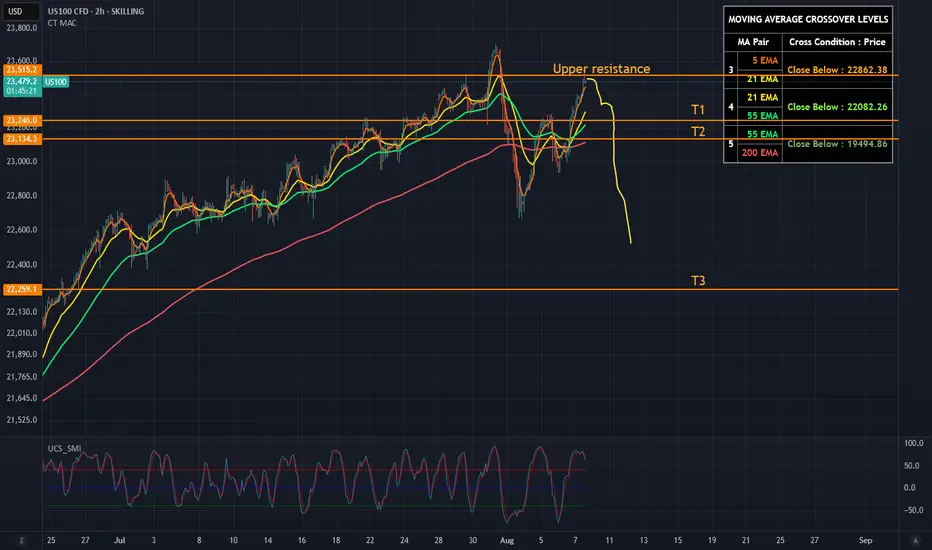
US100: Near All Time Highs, Weak FoundationThe Nasdaq 100 (US100) is hovering near all-time highs (~23,500), but signs of exhaustion are mounting. Momentum is fading, RSI is overstretched, and volume has been declining - all classic symptoms of a tired rally.
From a technical perspective, the index is pressing against upper trendline resistance after an aggressive multi-week run. Price action shows weakening follow-through on each new high, hinting at buyer fatigue. Best example was the huge sell-out last week.
Fundamentally, the rally is losing its foundation:
- Earnings surprises from Big Tech (Apple, Shopify) are already priced in.
- AI hype is cooling off, and valuation multiples remain extreme.
- Macro data (ISM Services, jobs) suggest economic softness.
- Fed rate cut hopes are baked in — any disappointment could trigger a sharp repricing.
Conclusion for me:
The Nasdaq looks ripe for a pullback.
We may possibly see a short spike above my drawn "upper resistance line" but I'm pretty convinced we won't see new ATH, - in my opinion it would be just a stop hunt.
If 23,000 then breaks, watch for acceleration toward 22,500 and beyond. The air is thin up here.
T1: 23250
T2: 23100
And if we get the break - I see T3 - 22250
One unpredictable variable, though? The world’s leaders.
Their "creative" decision-making has the power to nuke any technical setup.
Markets may follow charts and earnings - until a politician wakes up and chooses chaos.
No trading advice, just my ideas. :)
Market will crash in August 2025, some gurus said !There are no lack of experts and gurus coming out to say the market will crash because of blah blah blah.......Take it with a pinch of salt and it is more important to base your decisions from your own research.
Of course, if you are heavily concentrated in one geographical region say US market or sector eg IT/AI/COMs etc then you might want to rebalance your portfolio a bit. However, if you know what you are doing or have domain knowledge , then stick to it.
Assuming these gurus are right, the market is going on a RISK off mode, ie, going to CRASH, then safe haven assets like GOLD, SILVER should rightfully be bullish.
In that case, let's monitor this chart and see how the market behaves in this month. It will be exciting !

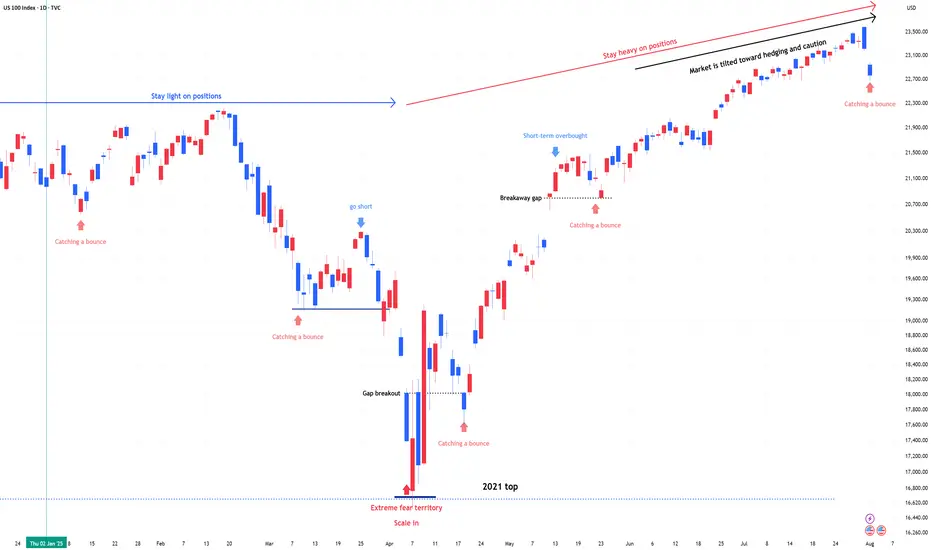
NDX & SPX , Stay heavy on positionsNDX & SPX , Stay heavy on positions (QLD, TQQQ)
Despite downside volatility, the trend remains intact. I’m maintaining the same view as before—this is still a zone to stay heavy.
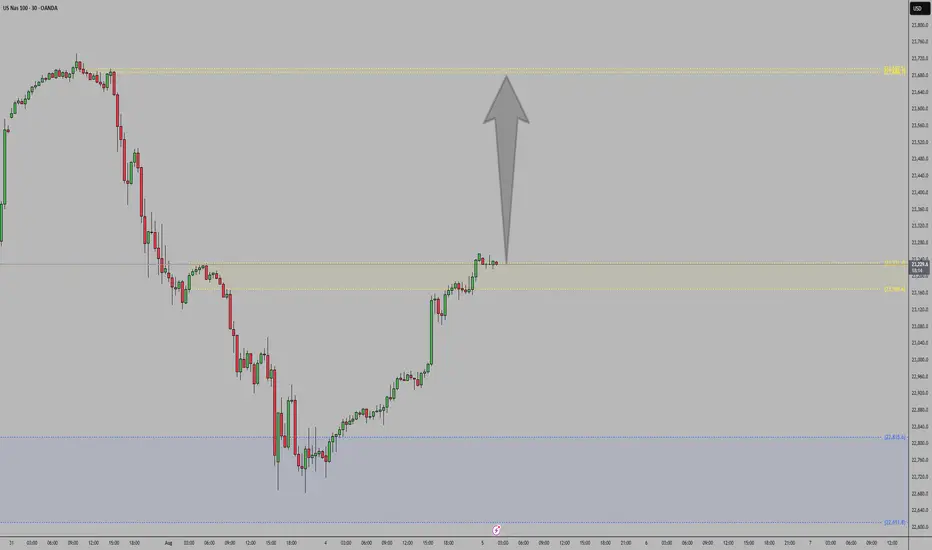
Nasdaq Index (US100 / NASDAQ) Technical Analysis:The Nasdaq Index showed improvement at the market open today and is currently trading near the $23,300 level, with price action building at a key resistance zone.
🔹 Bearish Scenario:
If the price retraces to $23,170 and breaks below it, a move toward $22,970 could follow as the next support target.
🔹 Bullish Scenario:
If the price breaks above $23,300 and holds, bullish momentum could drive the index toward $23,600.
⚠️ Disclaimer:
This analysis is not financial advice. It is recommended to monitor the markets and carefully analyze the data before making any investment decisions.

NAS100 - Stock Market Heading Down?!The index is trading in its medium-term ascending channel on the four-hour timeframe between the EMA200 and EMA50. However, if the index corrects upward towards the specified supply zone, it is possible to sell Nasdaq with better risk-reward.
In recent days and weeks, the Nasdaq Composite Index once again approached its historic highs, even setting a new all-time record. However, following the latest jobs data and the Federal Reserve meeting, the index experienced a price correction.
Unlike many previous bullish phases that were driven largely by short-term momentum or emotional reactions, the current upward trend in the Nasdaq reflects structural maturity and market stabilization. Institutional capital inflows and strong corporate earnings have together painted a picture of a more stable and predictable future for this index.
According to recent financial data, U.S. equity funds received over $6.3 billion in net inflows during the final week of July—marking the first positive inflow after three consecutive weeks of outflows.
The key engine behind this growth continues to be the robust performance of tech companies. Firms such as Meta, Microsoft, and AI-oriented companies like Nvidia and Broadcom posted exceptionally strong earnings reports. These results not only exceeded analysts’ expectations but also fueled significant gains in their stock prices, contributing to the Nasdaq’s momentum. Despite some sector-specific concerns—for instance, regarding Qualcomm in the semiconductor space—the broader tech sector has sustained its upward trajectory and even extended that momentum to adjacent industries, especially those involved in cloud and AI supply chains.
Meanwhile, advisors to Donald Trump revealed that he plans sweeping reforms at the U.S. Bureau of Labor Statistics (BLS). This announcement followed the July jobs report, which showed only 73,000 new jobs and sharp downward revisions to prior months’ figures.
On Truth Social, Trump accused the current BLS Commissioner, Erica McEnturfer, of politically manipulating employment data and ordered her immediate removal. Secretary of Labor Lori Chavez-DeRemer subsequently announced that Deputy Commissioner William Witrofsky would serve as acting head. Trump emphasized that economic data must be accurate, impartial, and trustworthy—and not politically skewed.
Following this leadership change, a broader debate has emerged around how employment statistics are collected and reported. While statistical revisions have long been a routine, non-political process since 1979, there are now growing questions about whether a better system for gathering and publishing this critical data could be developed.
As a nonpartisan branch of the Department of Labor, the BLS publishes its monthly employment report at 8:30 AM Eastern on the first Friday of each month. The data is gathered from surveys of around 629,000 business establishments.
Analysts have cited several reasons for the frequent need for revisions:
• Late responses from firms
• Delays from large corporations that distort preliminary figures
• Recalculations due to seasonal adjustments (e.g., holidays or weather)
• Demographic shifts impacted by immigration or deportation
• Annual revisions based on finalized tax records
With a relatively light economic calendar in the U.S. this week, traders have turned their focus to the latest developments in trade negotiations—particularly talks with countries that have yet to finalize trade agreements with Washington.
Although the U.S. has reached deals with key partners including the UK, EU, Japan, and South Korea, no formal agreement has yet been made with China to extend the current trade truce, which is set to expire on August 12.
The new U.S. tariff plan proposes a baseline 10% rate for most countries, but some—like India and Switzerland—face much higher rates of 25% and 39%, respectively. However, since implementation of the tariffs has been postponed until August 7, there’s still time for further negotiations and possible rate reductions. Sources close to the White House suggest the administration is eager to continue talks.
What’s now becoming clear is the sheer magnitude of the proposed tariff shifts—far beyond pre-trade-war averages. These changes could have more severe consequences than previously estimated, potentially pushing up U.S. inflation while simultaneously threatening global growth. As such, markets may be entering a fresh wave of volatility.
Compounding these concerns is the U.S. Treasury’s upcoming bond issuance schedule, which could add to market instability.
Also on the radar is the ISM Services PMI for July, due Tuesday. Its results will be closely watched for signs on the U.S. dollar’s direction and the Fed’s potential actions at its September meeting.
Notably, as of July 18, 2025, the widely-followed Buffett Indicator—measuring the ratio of market capitalization to GDP—was 2.3 standard deviations above its historical average. This level surpasses even the dot-com bubble era of the early 2000s. The indicator is now firmly in the “overvalued” zone, which often precedes market corrections or even crashes. For context, during the 2008 financial crisis, it was roughly 1.5 standard deviations below the historical norm.

NASDAQNASDAQ is showing strength as price reacts from a key weekly support zone, aligning with the latest COT report indicating increased institutional long positions. This confluence supports a continued bullish outlook.
Nasdaq faces a possible down 5-10/20% downturn.Overconfidence will foreshadow a correction. Risk posed by slowing growth in jobs, trade disputes and high valuations in growth focused companies in the index.
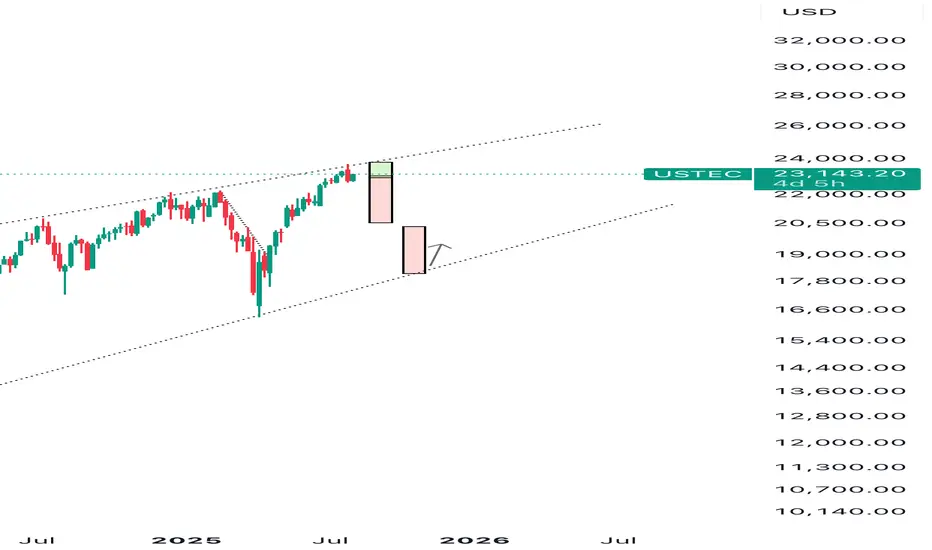
Nasdaq is retracing to lower channal line.Nasdaq is retracing to lower channal line. This fall is attributed to Tarrif war.

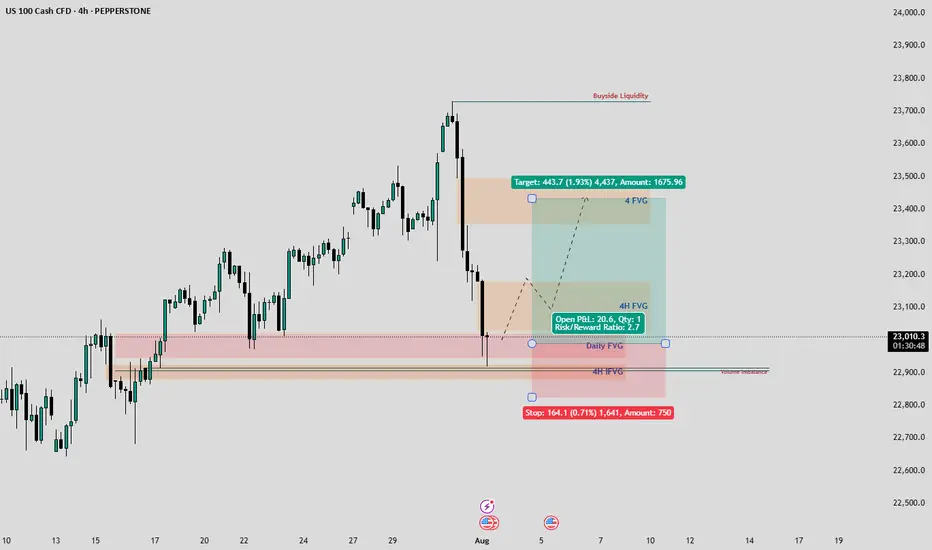
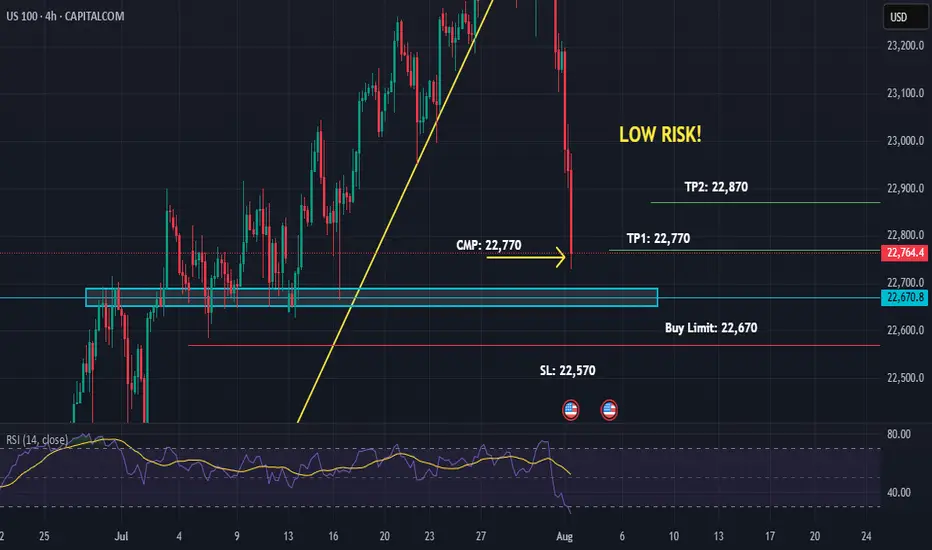
US100 Buy-Limit on Support 4HUS100 Buy-Limit on Support 4H
01-08-25
06:57 PM
Low Risk Trade because market is bearish!

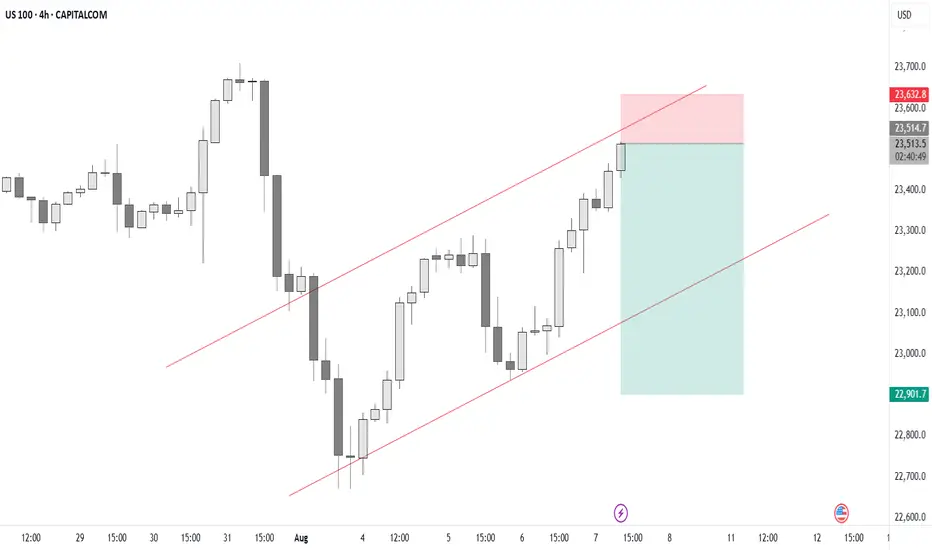
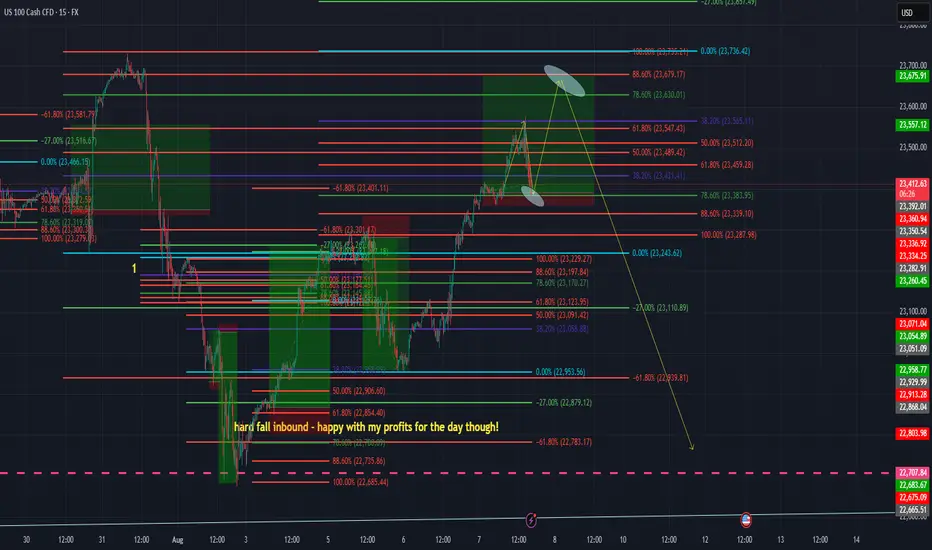
Sell US100US100 Sell idea. This trade setup is based on a bearish flag pattern seen on the 4HR chart. Let us see how price reacts from this resistance.
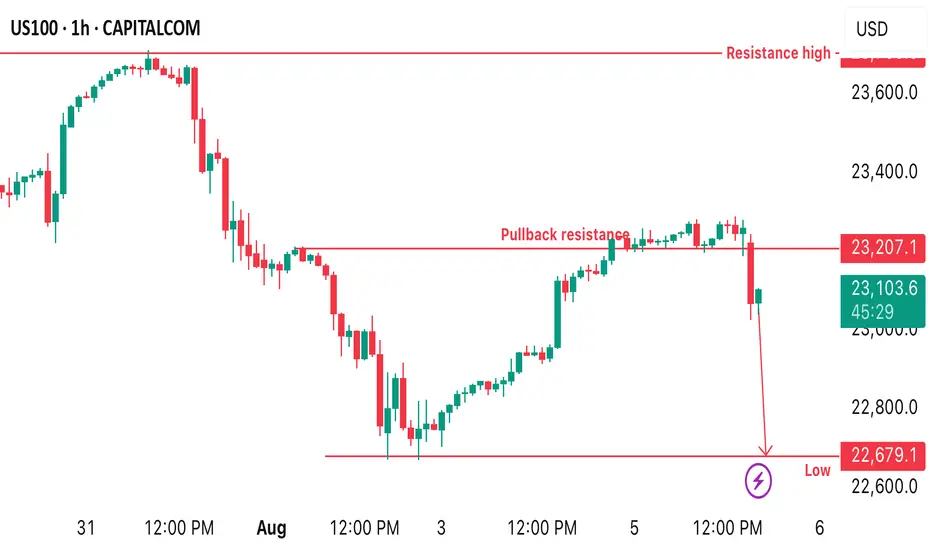
US100 reacts at pullback resistance US100 price reacts nicely at a pullback resistance with a strong rejection which supports the idea of selling from the current price. Therefore, a sell opportunity is envisaged from the current market price.
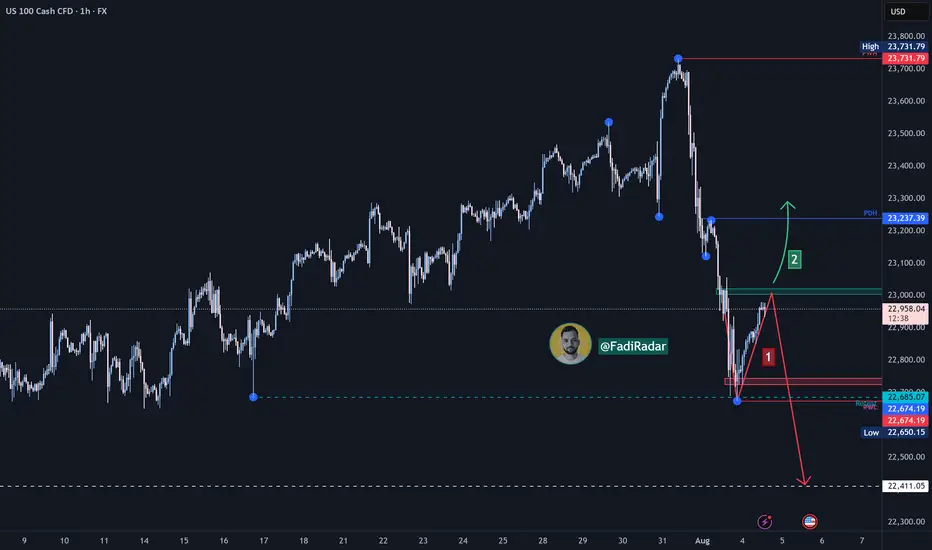
Nasdaq Index (US100 / NASDAQ) Technical Analysis:The Nasdaq index experienced a sharp drop last week, as expected, testing the 22,680$ level. Today, it's showing signs of a corrective move, currently trading around 22,950$.
🔹 Bearish Scenario:
If the price drops back to 22,680$ and breaks below it with confirmation, the next support could be 22,400$.
🔹 Bullish Scenario:
If buying momentum pushes the price above 23,000$, and it holds, we may see an extension toward 23,240$ and possibly 23,500$.
⚠️ Disclaimer:
This analysis is not financial advice. It is recommended to monitor the markets and carefully analyze the data before making any investment decisions.
Us100 a strong buyUs100 broke out of your trendline, waiting for the market to retrace to your demand zone, and we can buy from there
NQ long thursdays reversalmultiple SSMTs on the weekly and daily cycles
Expecting to do a 1-1 of the current range

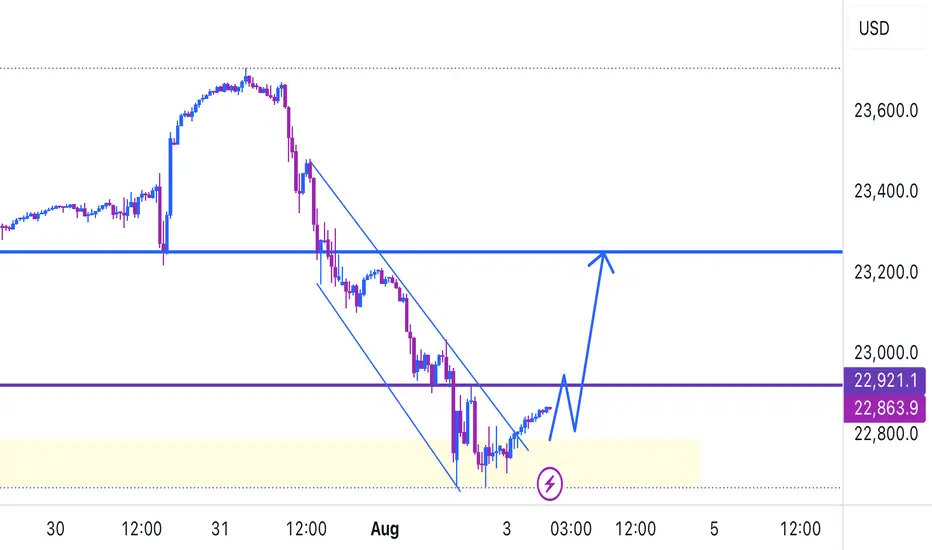
A slight push to the upside - inboundWe're going to see a slight push to the upside, before NASley will do a proper drop for us to a position that has been support for a long time.
I'm of the opinion that she'll break that support, re-test it and then drop even further - motivated by the current political instability within the US and world in general.
Watch this move - It's going to be one for the books!
Technical Analysis of US100 on TradingView A trader is analyzing the US100 (Nasdaq 100 Index) using a 4-hour chart on TradingView. The chart displays a clear upward channel, with price action bouncing off the lower boundary and heading toward the upper trendline. A blue arrow indicates a bullish prediction, anticipating further upward movement. Support and resistance zones are highlighted, and the setup suggests a continuation of the bullish trend.
📊 Chart Overview:
Timeframe: 4-hour (H4)
Instrument: US100 (Nasdaq 100 Index)
Platform: TradingView via Capital.com
Date/Time in Chart: 25th August, 10:00 (likely UTC)
---
📈 Trend Analysis:
The price is moving within an upward parallel channel, indicating a strong bullish trend.
The chart shows multiple touches of both the upper and lower bounds of the channel, confirming its validity.
---
🟩 Support and Resistance:
Support Zone: Around 22,850–23,050 (highlighted by the green rectangular box).
Price bounced sharply from this area, showing buyers are defending it.
Resistance Area (Projected): Upper bound of the channel, which aligns with the 24,000 level.
---
🕊️ Current Market Behavior:
The price recently bounced off the lower channel boundary and the key support zone.
A strong bullish candle broke through a mini pullback area, suggesting momentum is favoring buyers.
The blue arrow indicates an expected continuation upward toward the upper resistance line.
---
📌 Technical Implications:
Bullish Bias: As long as price remains inside the channel and above the support zone, the bullish trend is intact.
A retest of the upper channel line (~24,000) is a realistic target if momentum continues.
Invalidation Level: A clean break below the support zone (~22,850) and out of the channel could shift sentiment to bearish.
---
✅ Possible Trade Idea (for Educational Purposes):
Entry: Around 23,400–23,500 (already in motion)
Target: 23,900–24,000 (upper channel line)
Stop-loss: Below 22,850 (beneath the support zone)


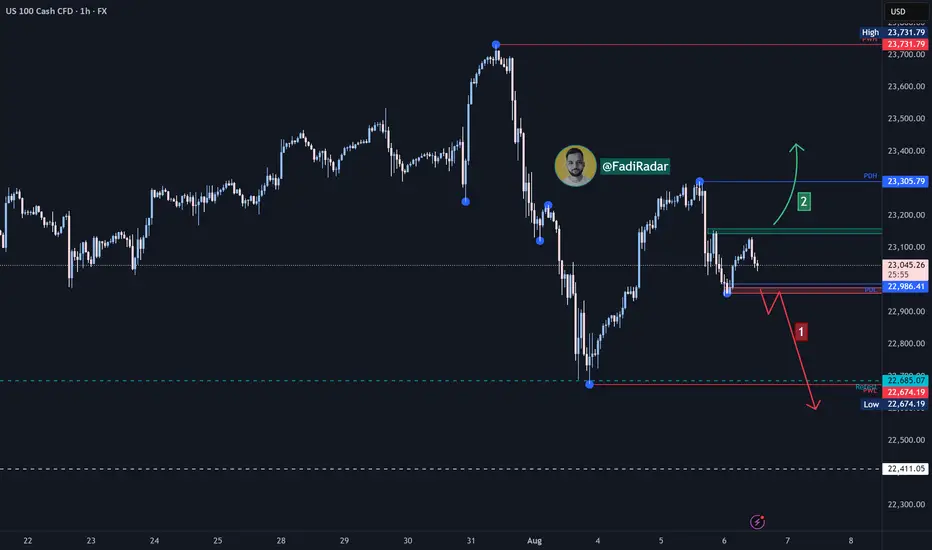
Nasdaq Index Analysis (US100 / NASDAQ):The Nasdaq index saw a slight improvement with today’s market open and is currently trading near 23,000 USD. The short-term trend remains bearish.
1️⃣ A break and close below 22,960 USD may push the price toward 22,670 USD as an initial target.
📉 Holding below that level could open the path to 22,400 USD.
2️⃣ However, if strong buying momentum leads to a break above 23,160 USD and price holds, we could see a move toward 23,300 USD, followed by 23,600 USD.
⚠️ Disclaimer:
This analysis is not financial advice. It is recommended to monitor the markets and carefully analyze the data before making any investment decisions.