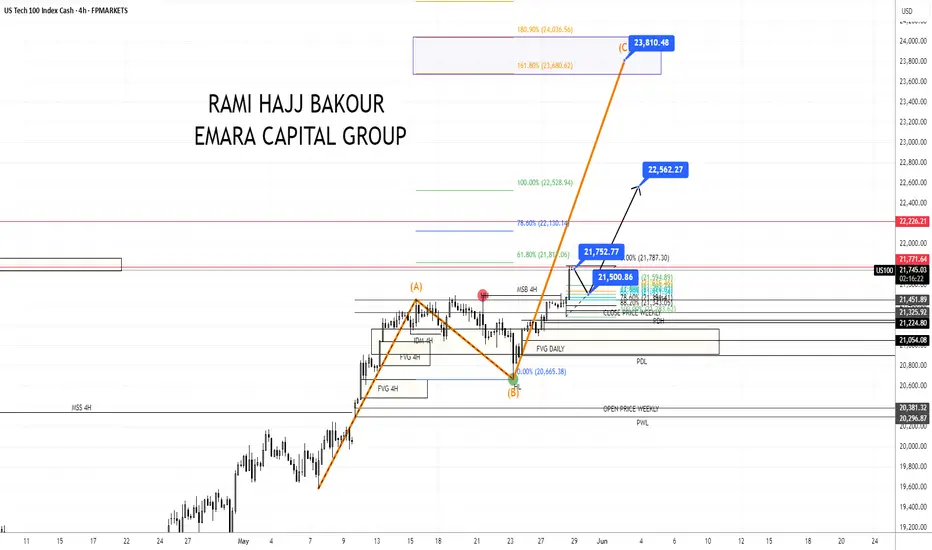
Nasdaq: Positive Momentum Builds Following Nvidia's Q1 EarningsThe Nasdaq is experiencing increased bullish momentum following Nvidia’s impressive Q1 earnings.
On the medium to long term, the index is targeting levels around 23,800.
In the short term, a corrective move toward 21,500 is expected, which will likely set the stage for a strong rebound toward 22,300 and 23,000.
📈 Stay tuned for upcoming opportunities and key levels!
📈 Suggested Hashtags for maximum reach:
#Nasdaq
#Nvidia
#EarningsSeason
#BullishOutlook
#TechnicalAnalysis
#PriceAction
#StockMarket
#TradingView
#MarketTrends
#Investing
USTEC trade ideas
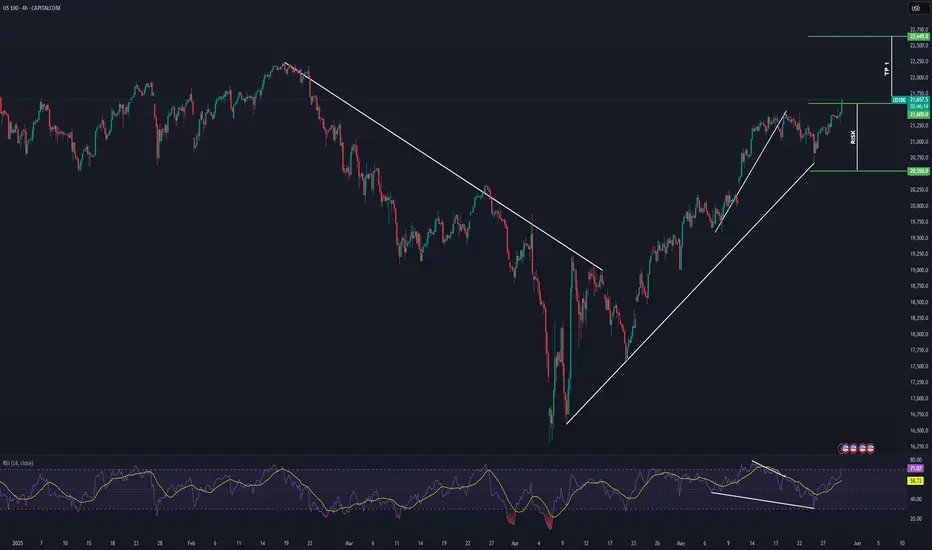
NASDAQ Potential Bullish ContinuationNASDAQ price action seems to exhibit signs of potential Bullish momentum as the price action may form a credible Higher High (after tarriff delays on the EU) with multiple confluences through key Fibonacci and Support levels which presents us with a potential long opportunity.
Trade Plan:
Entry : 21600
Stop Loss : 20550
TP 1: 22649
NASDAS PLANHello, good ? Me no.
I see this pattern. Consolidation this summer and fall in August and Setpember.
Bottom is December 2025.
After ? idk.
Good luck

Bearish US100everything is clear that the price will goes down after several times rejected from top.

US 100 – Further Moves Await NVIDIA Earnings UpdateGlobal stock indices have reacted positively at the start of this new trading week to President Trump’s decision to extend a deadline which would impose a tariff of 50% on EU goods imported into the US from June 1st to July 9th.
Taken alongside a new willingness being signalled from the EU side to speed the negotiating process along in key areas, means trader hopes have increased that a deal between the first and third largest of the world’s economies can be agreed in principle within the allotted time.
Focusing on US stock indices, the US 100 has risen 2.4% this week, taking it only a small step away from its recent highs at 21493 seen on May 20th. However, later today, the rally is about to face possibly its biggest challenge of the week in the form of earnings from the second biggest company on the planet ($3.3 trillion mkt cap) and AI bellwether NVIDIA, which are released after the market close.
Traders will not only be looking to judge company’s actual performance against expectations but will be eager to receive updates on the impact of President Trump’s tariffs on future revenue, chip deals with the Middle East, competition and its outlook for AI demand moving forward.
Answers to these questions and others may well impact sentiment towards technology stocks and the US 100 moving into the end of the week, and month, on Friday.
With increased volatility a possibility, knowing the technical outlook can also be helpful.
Technical Update: Focus on the May Highs at 21493
While last week did see correction themes develop within the US 100 index, there appears to be no clear-cut signs of a negative sentiment shift yet, as fresh buying developed above support provided by the rising Bollinger mid-average, currently at 20772 (see chart below).
However, looking forward, if the NVIDIA earnings prompt an increase in US 100 price volatility, what are the levels traders may be watching for clues to the next directional themes?
Potential Support Levels:
It is possible the rising Bollinger mid-average, currently at 20772, represents a first support for traders, and as such, closing breaks below this level might lead to a more extended phase of price weakness.
Such moves while not a guarantee of declines, could lead to a deeper sell-off towards 20001, which is equal to the 38.2% Fibonacci retracement of April 21st to May 20th 2025 price strength.
Potential Resistance Levels:
With this week seeing fresh price strength emerge from above the rising Bollinger mid-average, a positive price pattern of higher highs and higher lows, may still be evident. This reflects buyers currently being willing to pay higher prices, each time a setback materialises.
However, to maintain this uptrend pattern in price, the focus could now be on resistance provided by the May high at 21493 (May 20th), with closing breaks above this level required to suggest further strength might then be on the cards, towards what could prove to be the next potential resistance level at 22226, which is the February 18th 2025 all-time high.
The material provided here has not been prepared in accordance with legal requirements designed to promote the independence of investment research and as such is considered to be a marketing communication. Whilst it is not subject to any prohibition on dealing ahead of the dissemination of investment research, we will not seek to take any advantage before providing it to our clients.
Pepperstone doesn’t represent that the material provided here is accurate, current or complete, and therefore shouldn’t be relied upon as such. The information, whether from a third party or not, isn’t to be considered as a recommendation; or an offer to buy or sell; or the solicitation of an offer to buy or sell any security, financial product or instrument; or to participate in any particular trading strategy. It does not take into account readers’ financial situation or investment objectives. We advise any readers of this content to seek their own advice. Without the approval of Pepperstone, reproduction or redistribution of this information isn’t permitted.

NSDQ100 INTRADAY resistance retest ahead of US OpenThe USD continues to rally, driven by:
A strong rebound in US Consumer Confidence, reversing a six-month downtrend.
A decline in the number of Americans expecting a recession, improving risk sentiment.
This positive momentum helped offset weaker April Durable Goods Orders, which reflected business concerns tied to Trump’s tariff policies.
Trump Signals Progress with EU Trade Talks
Trump stated on Truth Social that the EU is moving quickly to begin trade negotiations after he expressed satisfaction with a proposed 50% tariff.
Markets could interpret this as a step toward de-escalation, potentially supporting US equities and the USD, while posing risk to EU markets if tensions resume.
SpaceX Test Failure
SpaceX’s Starship test failed mid-flight. While a technical setback, broader market impact is likely minimal unless similar failures persist.
Could marginally affect aerospace and space-related stocks.
Elon Musk on Crypto & Tax Policy
Musk criticized Trump’s tax bill, claiming it undermines DOGE and broader crypto innovation.
Slightly negative for crypto sentiment, particularly speculative tokens like Dogecoin.
Earnings in Focus
Nvidia (NVDA):
Market will watch for signs of weaker China-related growth, tied to Trump’s policy on semiconductors and AI.
Key impact expected on tech stocks, semis, and the NASDAQ.
Salesforce (CRM):
Focus on adoption of new AI tools and updates on the $8 billion Informatica acquisition.
Could affect broader enterprise software and cloud sector sentiment.
Key Support and Resistance Levels
Resistance Level 1: 21520
Resistance Level 2: 21850
Resistance Level 3: 22200
Support Level 1: 21000
Support Level 2: 20770
Support Level 3: 20560
This communication is for informational purposes only and should not be viewed as any form of recommendation as to a particular course of action or as investment advice. It is not intended as an offer or solicitation for the purchase or sale of any financial instrument or as an official confirmation of any transaction. Opinions, estimates and assumptions expressed herein are made as of the date of this communication and are subject to change without notice. This communication has been prepared based upon information, including market prices, data and other information, believed to be reliable; however, Trade Nation does not warrant its completeness or accuracy. All market prices and market data contained in or attached to this communication are indicative and subject to change without notice.

HelloHello traders, gamblers and investors.
Now is the perfekt time to buy right before the trump bull market that historically gives insane returns, i am currently in a 20x nasdaq trade stoploss 9.april lows, hold it forever, good luck and enjoy great profits as usual and dont be a bearish american sucker brainwashed by the media loosing money every single day 🤣🤣🤣🤣🤣🤣🤣🤣🤣🤣🤣🤣🤣🤣🤣🤣🤣🤣🤣

Actionable Nasdaq insights: 28-May-2025Rise and shine, traders! Start your day with actionable Nasdaq insights. Let's grow your skills together, one chart at a time.

Since there is no bullish commitmentThen this a short, has been since days ago. yet we gotta get some discounts, why not, cheap prices. I guess.

NASDAQ: More Bullish MovementsHuge drop on the left side which happens to reset the trend. Maybe NAS could continue to rally from this point forward

Hanzo / Nas100 15m Path ( Confirmed Bullish Breakout )Nas100 Chart / Opportunity
🆚 Nas100
The Path of Precision – Hanzo’s Market tactics
🔥 Key Levels & Breakout Strategy – 15M TF
☄️ Bullish Setup After Break Out – 21300 Zone ( Break Out Done )
Price must break liquidity with high volume to confirm the move.
Hanzo / Nas100 15m Path ( Confirmed Bullish Breakout )

Nasdaq 100 Heading Downwards on the 1-Hour TimeframeConsidering the positive trend on the 1-hour and 2-hour timeframes, and the need for energy to continue the upward movement, along with the fact that the M15 trend was negative, given the pullback in this area, we expect a decline towards the 1-hour low.
Please make sure to maintain a 2% risk of your account balance and do not risk more than that. Always take responsibility for your trades.
NASDAQ got the 4H MA50 confirmation it neededNasdaq (NDX) has been trading within a Channel Up since the April 21 bottom and last week it unfolded its latest technical Bearish Leg.
As the 4H RSI bottomed on the 30.00 oversold barrier and the 4H MACD formed a Bullish Cross, that Leg bottomed and today the index gave the confirmation of the new Bullish Leg by breaking above its 4H MA50 (blue trend-line).
This is similar to the April 21 bottom, so we expect at least a minimum of +9.18% rise on the current Bullish Leg, which gives a 22500 short-term Target.
-------------------------------------------------------------------------------
** Please LIKE 👍, FOLLOW ✅, SHARE 🙌 and COMMENT ✍ if you enjoy this idea! Also share your ideas and charts in the comments section below! This is best way to keep it relevant, support us, keep the content here free and allow the idea to reach as many people as possible. **
-------------------------------------------------------------------------------
Disclosure: I am part of Trade Nation's Influencer program and receive a monthly fee for using their TradingView charts in my analysis.
💸💸💸💸💸💸
👇 👇 👇 👇 👇 👇

US1001. I analyzed the U.S. 100 (Nasdaq) and identified a breakout setup.
2. A buy call was placed after confirmation of the breakout above a key resistance level.
3. Both Take Profit (TP) and Stop Loss (SL) levels have been clearly mentioned.
4. The entry was based on a clean breakout with momentum, aligned with the overall trend.

us100us100 is is ready for breakout if we see us100 is now at resistance and made range and the overall trend is up in us 100 if us100 0n 15 min give closing above 21320 then we can see a target of 21500 .

Nasdaq Holds Above 21,000 Ahead of NVIDIA EarningsDespite Risk-Off Headlines, Nasdaq Remains Resilient
AI remains embedded in long-term national strategies across 2030 and beyond, which is keeping tech resilient even amid trade uncertainty and weaker economic data. Markets are now eyeing NVIDIA’s earnings on Wednesday. Expectations are high, but the announcement could raise volatility risks, particularly heading into Wednesday evening and Thursday's U.S. market open.
The Nasdaq remains in a bullish zone above the neckline of a double top pattern that formed between December 2024 and February 2025. Price action is currently consolidating between the 21,500 resistance and the 20,800 support.
A clear breakout above 21,500 could push the index toward 22,200 and potentially the next major high near 23,700.
Conversely, a decisive close below 20,800–20,600 would signal increased selling pressure, targeting 19,600 and 19,100.
- Razan Hilal, CMT

Hanzo / Nas100 15m Path ( Confirmed Bullish Breakout )🆚 Nas100
The Path of Precision – Hanzo’s Market tactics
🔥 Key Levels & Breakout Strategy – 15M TF
☄️ Bullish Setup After Break Out – 21290 Zone ( Break Out Done )
Price must break liquidity with high volume to confirm the move.
🩸 15M Time Frame Confluence
————
CHoCH & Liquidity Grab @ 21300
Key Level / Equal lows Formation - 21000
🔥 1H Time Frame Confirmation
Twin Wicks @ 21250 – Liquidity Engineered
Twin Wicks @ 21150 – Liquidity Engineered
Nasdaq market analysis: 27-May-2025Good morning, traders! Welcome to today's Nasdaq market analysis. Compare my price action insights with your own charts and enhance your trading skills.

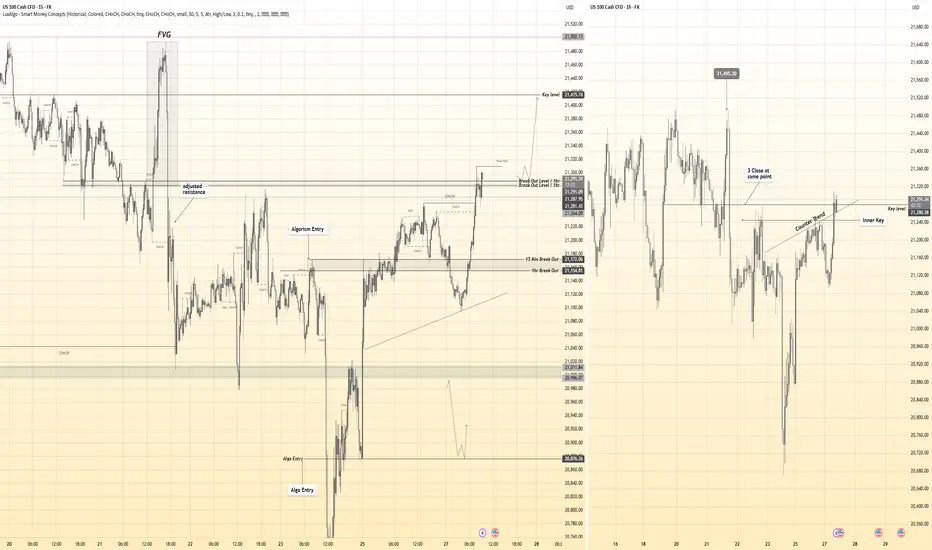
US100 INDEX TRADE IDEA 27 MAY 2025The US100 index is currently demonstrating strong bullish momentum, underpinned by both Smart Money Concepts and supportive market fundamentals. From an SMC perspective, the index recently completed a clear shift in market structure following a major sell-side liquidity sweep below the 16,000 region in April. This move tapped into a long-term demand zone and a bullish order block before sharply reversing upward. The subsequent rally broke the previous bearish structure from February to April, indicating a clear change in sentiment and suggesting that institutional players have re-accumulated positions. Price action reinforces this outlook through a breakout from a falling wedge pattern followed by a bullish continuation channel. The current structure shows a series of higher highs and higher lows, with price consolidating just above a key short-term demand zone near the 21,000 mark. This consolidation phase could represent a reaccumulation before a continuation toward the next liquidity targets.
The technical setup suggests a long opportunity with an entry zone between 21,000 and 21,100, targeting the next major resistance levels at 22,134 and 22,524. A protective stop loss can be placed just below the recent swing low or order block around 20,113, ensuring invalidation only if the bullish structure breaks. From a fundamental standpoint, mid-2025 has been favorable to tech-heavy indices like the Nasdaq, as investors anticipate potential Federal Reserve rate cuts later in the year. Inflation has shown signs of easing, and corporate earnings in the tech sector have continued to outperform expectations, boosting investor sentiment. The broader macroeconomic landscape remains supportive, with resilient labor markets and improving risk appetite driving capital back into equities. With these tailwinds and a technically sound chart setup, the US100 presents a compelling swing long opportunity.

TQQQ/SQQQ Buy/Sell/Hold zones for tomorrow
Buy/Sell/Hold zones in Grn/Red/Ylw for Nasdaq100 tomorrow. I've been exclusively trading TQQQ/SQQQ lately so this is my full trade plan for tomorrow.

this is what june will look likeEveryone thinks the downtrend is over. it's not. the bulls are doomed, we are going to sell off for a year. sorry to be the bearer of bad news.

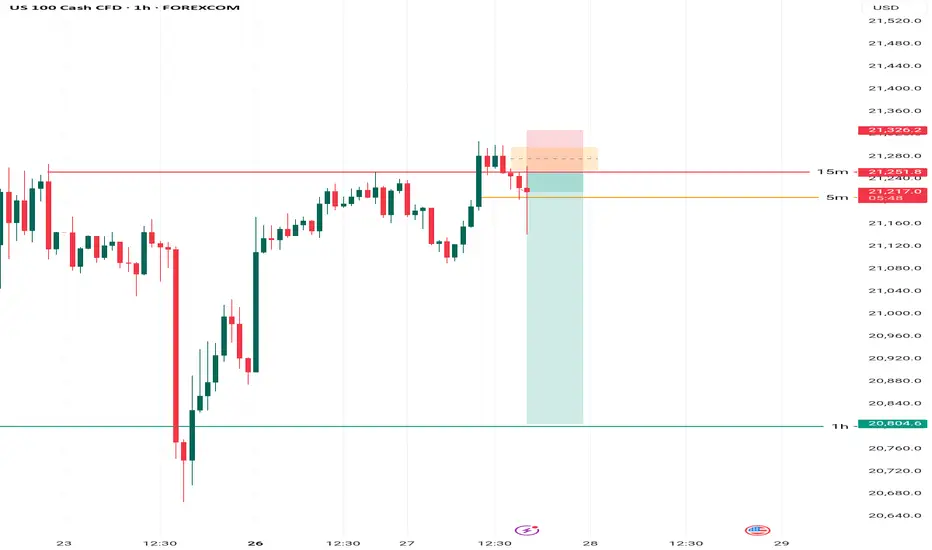
Nasdaq-100 H1 | Swing-low support at 61.8% Fibonacci retracementNasdaq-100 (NAS100) is falling towards a swing-low support and could potentially bounce off this level to climb higher.
Buy entry is at 20,877.40 which is a swing-low support that aligns with the 61.8% Fibonacci retracement.
Stop loss is at 20,640.00 which is a level that lies underneath a swing-low support.
Take profit is at 21,243.05 which is a multi-swing-high resistance.
High Risk Investment Warning
Trading Forex/CFDs on margin carries a high level of risk and may not be suitable for all investors. Leverage can work against you.
Stratos Markets Limited (tradu.com ):
CFDs are complex instruments and come with a high risk of losing money rapidly due to leverage. 63% of retail investor accounts lose money when trading CFDs with this provider. You should consider whether you understand how CFDs work and whether you can afford to take the high risk of losing your money.
Stratos Europe Ltd (tradu.com ):
CFDs are complex instruments and come with a high risk of losing money rapidly due to leverage. 63% of retail investor accounts lose money when trading CFDs with this provider. You should consider whether you understand how CFDs work and whether you can afford to take the high risk of losing your money.
Stratos Global LLC (tradu.com ):
Losses can exceed deposits.
Please be advised that the information presented on TradingView is provided to Tradu (‘Company’, ‘we’) by a third-party provider (‘TFA Global Pte Ltd’). Please be reminded that you are solely responsible for the trading decisions on your account. There is a very high degree of risk involved in trading. Any information and/or content is intended entirely for research, educational and informational purposes only and does not constitute investment or consultation advice or investment strategy. The information is not tailored to the investment needs of any specific person and therefore does not involve a consideration of any of the investment objectives, financial situation or needs of any viewer that may receive it. Kindly also note that past performance is not a reliable indicator of future results. Actual results may differ materially from those anticipated in forward-looking or past performance statements. We assume no liability as to the accuracy or completeness of any of the information and/or content provided herein and the Company cannot be held responsible for any omission, mistake nor for any loss or damage including without limitation to any loss of profit which may arise from reliance on any information supplied by TFA Global Pte Ltd.
The speaker(s) is neither an employee, agent nor representative of Tradu and is therefore acting independently. The opinions given are their own, constitute general market commentary, and do not constitute the opinion or advice of Tradu or any form of personal or investment advice. Tradu neither endorses nor guarantees offerings of third-party speakers, nor is Tradu responsible for the content, veracity or opinions of third-party speakers, presenters or participants.

NASDAQ: Needs to reclaim the 4H MA50.Nasdaq is bullish on its 1D technical outlook (RSI = 62.436, MACD = 467.180, ADX = 28.529) as it maintains its long term bullish trend through the Channel Up pattern, which recently is transitioning into a Rising Wedge. We are willing to turn bullish again upon a 4H candle closing over the 4H MA50 and aim for a +11.17% rise (TP = 23,000) on the HH trendline, like the April 21st rebound did.
## If you like our free content follow our profile to get more daily ideas. ##
## Comments and likes are greatly appreciated. ##
