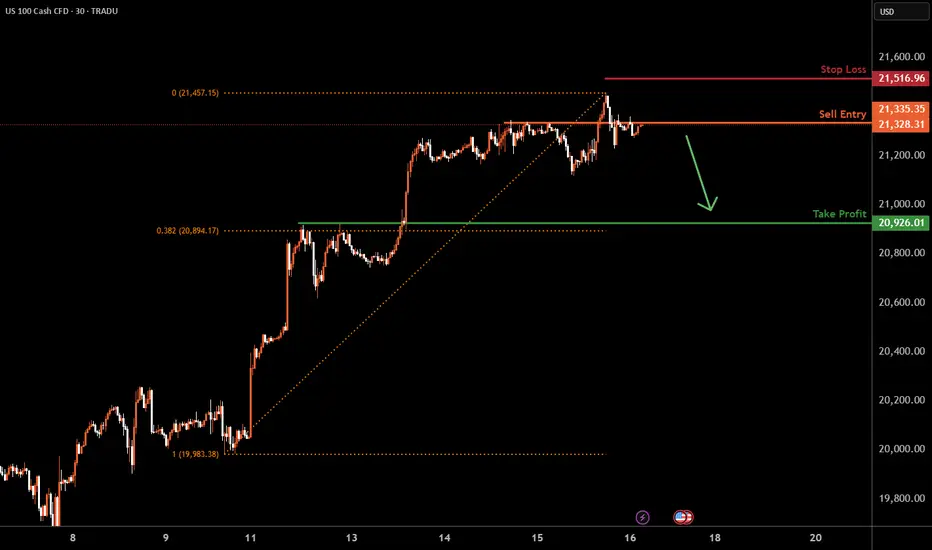
NAS100 I Bearish Drop Based on the H4 chart analysis, we can see that the price is testing our sell entry at 21,335.35, an overlap resistance.
Our take profit will be at 20,926.01, a pullback support that aligns close to the 38.2% Fibo retracement
The stop loss will be placed at 21,516.96, above the swing-high resistance.
High Risk Investment Warning
Trading Forex/CFDs on margin carries a high level of risk and may not be suitable for all investors. Leverage can work against you.
Stratos Markets Limited (tradu.com):
CFDs are complex instruments and come with a high risk of losing money rapidly due to leverage. 63% of retail investor accounts lose money when trading CFDs with this provider. You should consider whether you understand how CFDs work and whether you can afford to take the high risk of losing your money.
Stratos Europe Ltd (tradu.com):
CFDs are complex instruments and come with a high risk of losing money rapidly due to leverage. 63% of retail investor accounts lose money when trading CFDs with this provider. You should consider whether you understand how CFDs work and whether you can afford to take the high risk of losing your money.
Stratos Global LLC (tradu.com):
Losses can exceed deposits.
Please be advised that the information presented on TradingView is provided to Tradu (‘Company’, ‘we’) by a third-party provider (‘TFA Global Pte Ltd’). Please be reminded that you are solely responsible for the trading decisions on your account. There is a very high degree of risk involved in trading. Any information and/or content is intended entirely for research, educational and informational purposes only and does not constitute investment or consultation advice or investment strategy. The information is not tailored to the investment needs of any specific person and therefore does not involve a consideration of any of the investment objectives, financial situation or needs of any viewer that may receive it. Kindly also note that past performance is not a reliable indicator of future results. Actual results may differ materially from those anticipated in forward-looking or past performance statements. We assume no liability as to the accuracy or completeness of any of the information and/or content provided herein and the Company cannot be held responsible for any omission, mistake nor for any loss or damage including without limitation to any loss of profit which may arise from reliance on any information supplied by TFA Global Pte Ltd.
The speaker(s) is neither an employee, agent nor representative of Tradu and is therefore acting independently. The opinions given are their own, constitute general market commentary, and do not constitute the opinion or advice of Tradu or any form of personal or investment advice. Tradu neither endorses nor guarantees offerings of third-party speakers, nor is Tradu responsible for the content, veracity or opinions of third-party speakers, presenters or participants.
USTEC trade ideas
NASDAQ Potential Bullish Reversal OpportunityNASDAQ price action went through a massive correction during the global tariff war.
However after potential recent developments, we may finally see a direction towards the resolution of widespread tariff based uncertainty across the macro economic landscape.
This presents us with a potential Reversal opportunity if we see the formation of a credible Higher High (given a potential proper break out) on the Daily and shorter timeframes.
Trade Plan :
Entry @ 20440
Stop Loss @ 19500
TP 1 @ 21380

The NDX knows what it has to doAs you can see, breaking above the red line would be crucial for the NDX. If that happens, the blue line is next. It's only a matter of time, imo.
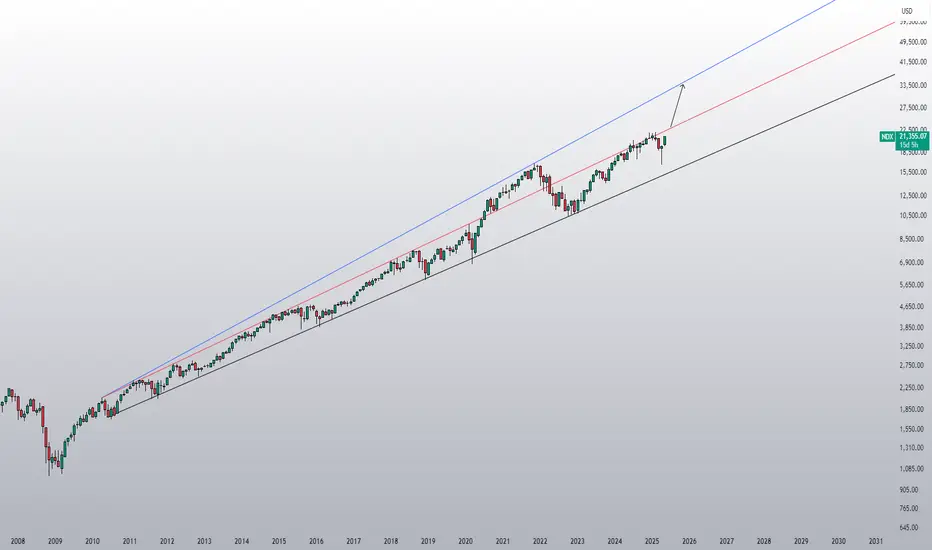
If the red line breaks during a Nasdaq meltdown…If the red line breaks during a Nasdaq meltdown…
Game over.
Gold wins.

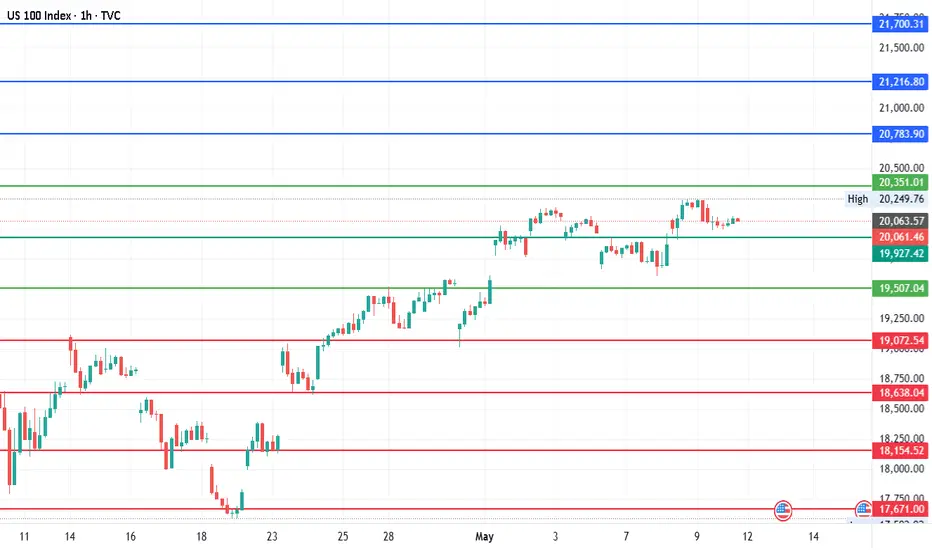
#NDQ - What does these lines say? Do they work?Hey, hope you are all doing great!
I strongly believe that you are looking at these charts to your advantage. Are the lines marked in these charts make any sense? Do these lines really work? check out these charts at a lower time frames and see. Since these are directionless, how to read?
Current Price: 20061.45
Mid-line: 19927.42
Upside: 20783.90, 21216.80, 21700.31 and 22183.83
Downside: 19072.54, 18638.04, 18154.52 and 17671.00
#NDQ

SHORT NAS100Updated Market Read on NAS100 Footprint
🟠 1. Trend & Price Action:
The overall short-term structure remains bearish.
The rally seen around 07:00–08:00 AM failed to hold above 21,220 and got rejected quickly.
Price has rotated back below the 21,200 key level and is currently printing at 21,194.5, below the VWAP-style center line.
🔴 2. Delta & Volume Shifts:
Look at 06:30–07:00 AM:
Strong positive delta: +290 with 11.51K total volume → Buyers were active.
However, the next few candles (07:00–08:00) show delta flipping negative again (-303) despite decent volume (13.49K).
This indicates buying effort was absorbed, and sellers regained control.
📉 3. Sell Imbalances Reappear:
From 07:30 onward, you see clear sell imbalances (left-side red/black clusters) starting to stack again.
Especially at the top of candles — typical of aggressive selling into buyer attempts.
🧊 4. Absorption Failed at Resistance:
The previous support zone at 21,220–21,240 is now acting as resistance.
Price was rejected right at this level, with sellers stepping in forcefully.
✅ Current Bias: Bearish Continuation
Key Supporting Evidence:
Failure to hold above 21,220 resistance.
Return of negative delta dominance.
Rejection after attempted bullish response (failed absorption).
Sell imbalances resuming into highs.
⚠️ Levels to Watch:
Support: 21,140 – held earlier and could still see responsive buyers.
Breakdown Level: If 21,140 breaks on heavy sell delta, next move could extend lower.
Resistance: 21,220–21,240 – current supply zone.
🔁 Trade Implication:
Short bias below 21,200, targeting 21,160 → 21,140.
Invalidate if price closes above 21,240 on strong positive delta and imbalance flip.

NAS100 | Footprint Chart UpdateKey Developments:
Price just closed above the 21,200 key level with a modest bullish footprint.
Positive delta (+18) with relatively light total volume (~110 contracts) suggests controlled buying rather than aggressive initiative buyers.
Buyers successfully absorbed the heavy selling pressure from the previous candle (delta -293) and pushed price higher — a short-term bullish signal.
📊 What This Means:
The market is showing signs of potential reversal after holding 21,160 and reclaiming 21,200.
If buyers can maintain strength above 21,200, we may see a move toward the 21,240–21,260 resistance zone.
Watch for increased buy imbalances and stronger delta on the next candles to confirm follow-through.
⚠️ Caution:
A failure to hold 21,200 and a drop back below it could signal a bull trap, leading to a re-test of 21,160 or even 21,120.
📍Levels to Watch:
Support: 21,200 → 21,160 → 21,120
Resistance: 21,240 → 21,260 → 21,300
🧩 Current Bias: Cautiously Bullish – Awaiting confirmation from next candle’s order flow.
📌 Stay disciplined. React, don’t predict.

NAS100 POssible Sell - Trade ideiaNAS100 POssible Sell - Trade ideia. I see a Switch of structure in 1H and 15min. Not happy that this is not confirmed on 4H but still expect this sell move to come. Lets see

NADAQ US100 MQ1As explained on the bubbles and the recent published drawings this is now the live trade execution.

3 Consistent Winner Beliefs. Do you check off all 3?> Every trader comes to the charts with a story.
Mine is one of obsession, resilience, and belief.
This is what I tell myself every single day before I take a trade — my inner code.
1. Money can be made in markets
I’ve seen the charts. I’ve seen the proof.
Every day, money moves — and the ones with eyes to see take their slice.
Markets aren’t random. They aren’t chaos.
They’re an ocean of opportunity.
The consistent winners?
They’re locked in the present and spot opportunity moment by moment —
then strike when it’s worthwhile.
2. I can make money in markets
Not someone else. Me.
I study. I adapt. I execute.
I’m not here to gamble or guess.
I’m here to observe human behavior and act with precision.
I’ve trained my mind to see what others miss.
And that edge? It’s mine.
> “It’s so incredible how rich one can become without being perfect.”
3. I deserve to make money in markets
This one’s the hardest — and the most powerful.
Because without it, we self-sabotage.
I’ve put in the work.
I’ve sacrificed.
I’ve endured losses, frustration, and silence.
But I never stopped.
So when profit comes, it’s not luck — it’s alignment with who I’ve become.
> I post this not just as motivation — but as a mirror for others walking the same path.
If you’re obsessed with mastering yourself through the charts, then we’re already on the same team.
A belief is any thought you get attached to.
The more you attach, the more you become it.

US100 TO MAKE A MASSIVE DROP !!Price recently made a new lower high after we had a previous lower high around 20,122 price remains bearish as our recent trend isn’t taken out yet. Meaning that there is no new all time high formation yet. I anticipate a drop in price (abound 1000pip ) back to the previous lower high of 20122. Therefore we are looking forward to selling US100.

Nasdaq100/Us100 Possible Explosive Up Move About To Happen
Hello everyone! In this idea I have posted a picture of my current setup. I have taken a long positions once the 1 hour candles broke out of and closed beyond this range (Box) My SL is just the other side of this box and I am targeting the ATH on this position.
If another 1 hour box starts to form higher up I will simple add another position and move Stop losses accordingly.
although we have moved back within the range, the buy pressure is squeezing the candles to the top side of this range. This is why I am execting an explosive move. Once sellers are exhuasted it will propell itself to the next key level.
Let me know what you think.
I am not a financial adviser. Trade at your own risk.

Technical Breakdown on US100 (1H) TIME FRAMETechnical Breakdown on US100 (1H) using Volume Profile, Gann, and CVD + ADX
1. Key Observations (Volume, Gann & CVD + ADX Focused)
a) Volume Profile Insights:
Value Area High (VAH): 21,280
Value Area Low (VAL): 21,190
Point of Control (POC): 21,259.75
High-Volume Nodes: Dense volume between 21,200–21,260 indicating consolidation and potential distribution.
Low-Volume Gaps: Below 21,100 down to 20,800 — fast movement zones with limited participation.
b) Liquidity Zones:
Stop Clusters:
Above 21,300 (recent swing high zone and consolidation top)
Below 21,190 (VA Low, likely stop cluster from long positions)
Absorption Zones:
Strong absorption near 21,000 and again around 20,800 (marked by reversal attempts with high delta volume)
c) Volume-Based Swing Highs/Lows:
Swing Highs: 21,291 (confirmed by peak CVD and high rejection)
Swing Lows: 20,060 (prior major volume base and support)
d) CVD + ADX Indicator Analysis:
Trend Direction: Bearish Bias emerging (CVD divergence at highs, falling structure)
ADX Strength:
ADX > 20 + DI- > DI+ → Confirmed downtrend in progress
CVD Confirmation:
Falling CVD + Bearish Price Action = Clear supply dominance
2. Support & Resistance Levels
a) Volume-Based Levels:
Support:
VAL: 21,190
Lower POC: 20,060.91
Resistance:
VAH: 21,280
POC: 21,259.75
b) Gann-Based Levels:
Confirmed Gann Swing High: 21,291
Confirmed Gann Swing Low: 20,060
Retracement Levels:
1/2 = 20,675
1/3 = 20,537
2/3 = 20,812 → aligns with minor absorption
3. Chart Patterns & Market Structure
a) Trend: Bearish (confirmed by ADX > 20 + falling CVD and price)
b) Notable Patterns:
Distribution Zone forming at highs (flat top)
Descending Channel (Bear Flag) forming after topping — potential continuation lower
Rejection from POC + VAH convergence = strong signal for supply takeover
4. Trade Setup & Risk Management
a) Bullish Entry (watch for reversal confirmation):
Entry Zone: 20,800 (channel bottom/absorption + Gann 2/3)
Targets:
T1: 21,000
T2: 21,190 (VAL retest)
Stop-Loss (SL): 20,600
RR: Minimum 1:2
b) Bearish Entry (confirmed trend setup):
Entry Zone: 21,250–21,280 (POC + VAH)
Target:
T1: 20,800
Stop-Loss (SL): 21,320
RR: Minimum 1:2
c) Position Sizing:
Risk 1–2% of capital per trade to maintain long-term equity curve health

NY AM Silver BulletHigher TF manipulating highs, 7:30 NY high swept at 9
With MSS lower NY swing high and low after 930 and before 10am. OTE entry at 61& of Fib aligns with iFVG to sell. Moerse void below London Low.
Lower TF 5min iFVG that pushed into 7:30 high.
Entry criteria Casper Silver Buller>>$$$

How to Master Premium & Discount For Better EntriesA lot of traders talk about premium and discount, but very few actually know how to use it properly. Most just draw Fibonacci tools on random legs and try to catch reactions at the 61.8% level. That kind of trading lacks structure and context. If you're serious about using Smart Money Concepts the right way, then you need to understand where value exists in the market and how to position yourself accordingly.
This guide is all about mastering the premium vs discount model using a 4H bias, entries on the 1H or 15M, and refinements based solely on Fair Value Gaps. No order blocks. No guessing. Just clean structure, displacement, and a focus on institutional logic.
Establishing a Valid 4H Dealing Range
Your entire analysis starts with the 4H chart. That’s where you define the dealing range, the leg of price that caused a significant shift in market structure, usually confirmed by displacement and a break of a previous swing.
To do this correctly:
Identify a 4H swing high to swing low (or low to high) that broke structure and created an imbalance.
Anchor your range from that swing point to the extreme, this becomes your dealing range.
Mark the 50% of this range — this is your equilibrium line.
Everything above this midpoint is premium, everything below is discount.
You’re not drawing fibs for retracement levels. You’re using them to separate cheap price from expensive price.
Premium vs Discount: Why It Matters
The logic is simple: institutions buy at discount and sell at premium. They don’t place large positions in the middle of the range, they accumulate when price is cheap and distribute when price is expensive.
Once you’ve marked out your 4H range, you now have a framework:
Price in discount (below the 50%) = potential buy setups.
Price in premium (above the 50%) = potential sell setups.
The key is to only look for trades in the right part of the range. If price is in premium and you're trying to long, you're working against smart money. If it's in discount and you're trying to short, you're fading accumulation.
Refining the Setup on 1H or 15M
Once price enters the zone you’re interested in, premium or discount. Drop to the 1H or 15M charts to look for entries.
But we’re not trading any structure or supply/demand zone. We’re only interested in Fair Value Gaps. Why? Because FVGs are the cleanest way to spot imbalance — they show where price moved too aggressively and left inefficiency behind.
Here's what to do:
Watch for displacement on 1H or 15M once price taps into the 4H premium or discount zone.
The move should break short-term structure and leave a clear FVG.
Wait for price to retrace into that FVG.
Entry is placed inside the gap, preferably in the upper or lower third depending on direction.
Your invalidation is the low or high of the displacement move.
The FVG gives you a clean risk-to-reward setup that is backed by structure, context, and smart money intent.
Example: Long from Discount
Let’s say price is trading inside the discount zone of a 4H bullish dealing range. You now drop to 15M and see a sharp move higher that breaks structure and creates a clean 15M FVG.
Now you wait.
If price retraces into that gap and shows some form of reaction (volume, reaction wick, or small lower timeframe shift), you have a valid long. The trade is high probability because:
It’s inside 4H discount
The 15M displacement confirms smart money is stepping in
The FVG is your refined entry zone
Target is always the next liquidity pool inside premium.
Example: Short from Premium
Opposite logic applies.
If price trades into the premium zone of a 4H bearish range, you drop to 1H or 15M and wait for displacement to the downside. When you get a strong bearish move that leaves behind a Fair Value Gap and breaks intraday structure, you mark the FVG.
When price retraces into it, you execute your short. Stop is above the displacement high. Target is the first liquidity level inside discount, such as an old low or a clean equal low.
Rules for FVG Entries (1H/15M)
To keep your execution sharp, stick to these:
Only enter FVGs that form from displacement moves.
The FVG must break intraday structure.
It must form inside the 4H premium or discount zone, no exceptions.
Avoid FVGs that form in the middle of the range or during chop.
Make sure higher timeframe context supports the direction.
This filters out 90% of weak setups and forces you to trade in sync with value.
Targets and Exits
Where you enter is based on imbalance and structure, but where you exit is based on liquidity and the premium/discount model in reverse.
If you long from discount, you should be targeting premium levels.
If you short from premium, you should be targeting discount levels.
More specifically:
Look for old highs/lows
Clean equal highs/lows
Unfilled FVGs in the opposite zone
This way, you’re always exiting into areas where the market is likely to reverse or stall, and not overstaying your trade.
Conclusion
Trading from premium or discount zones isn’t just a concept, it’s a framework that puts you in line with institutional activity. When you combine it with FVGs, you have a clean, mechanical way to structure your trades.
Keep your bias on the 4H. Mark your ranges clearly. Drop to 1H or 15M only when price is in a valid zone, and only take entries on FVGs that form from strong displacement. If you stay disciplined with this model, you’ll avoid chasing price and start trading from areas of true value.
___________________________________
Thanks for your support!
If you found this guide helpful or learned something new, drop a like 👍 and leave a comment, I’d love to hear your thoughts! 🚀
Make sure to follow me for more price action insights, free indicators, and trading strategies. Let’s grow and trade smarter together! 📈
