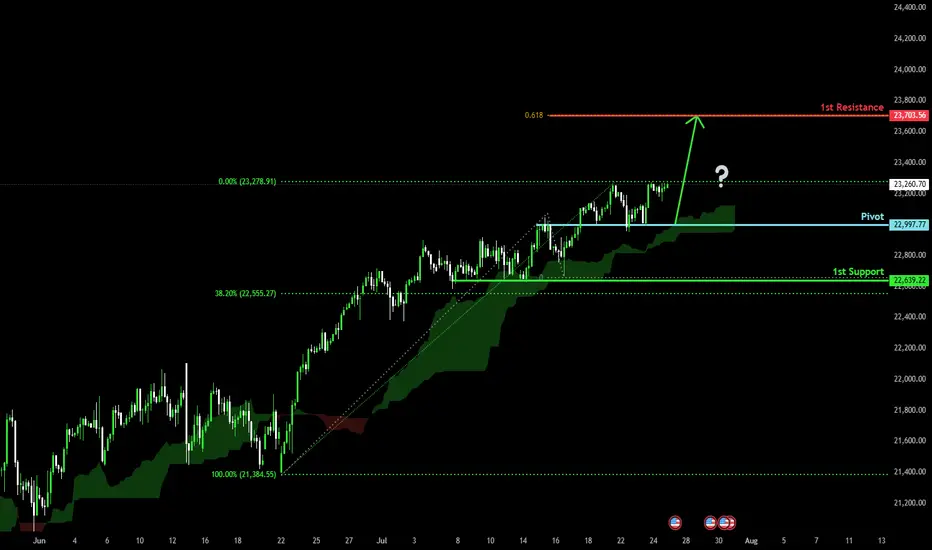
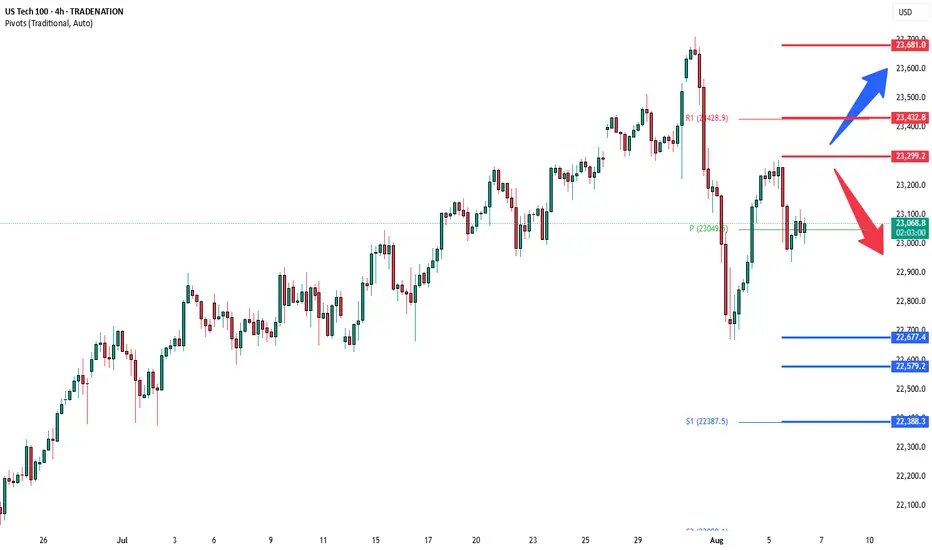
Bullish continuation?USTEC has bounced off the pivot and could potentially rise to the 1st resistancewhihc lines up with the 61.8% Fibonacci projection.
Pivot: 22,997.77
1st Support: 22,639.22
1st Resistance: 23,703.56
Risk Warning:
Trading Forex and CFDs carries a high level of risk to your capital and you should only trade with money you can afford to lose. Trading Forex and CFDs may not be suitable for all investors, so please ensure that you fully understand the risks involved and seek independent advice if necessary.
Disclaimer:
The above opinions given constitute general market commentary, and do not constitute the opinion or advice of IC Markets or any form of personal or investment advice.
Any opinions, news, research, analyses, prices, other information, or links to third-party sites contained on this website are provided on an "as-is" basis, are intended only to be informative, is not an advice nor a recommendation, nor research, or a record of our trading prices, or an offer of, or solicitation for a transaction in any financial instrument and thus should not be treated as such. The information provided does not involve any specific investment objectives, financial situation and needs of any specific person who may receive it. Please be aware, that past performance is not a reliable indicator of future performance and/or results. Past Performance or Forward-looking scenarios based upon the reasonable beliefs of the third-party provider are not a guarantee of future performance. Actual results may differ materially from those anticipated in forward-looking or past performance statements. IC Markets makes no representation or warranty and assumes no liability as to the accuracy or completeness of the information provided, nor any loss arising from any investment based on a recommendation, forecast or any information supplied by any third-party.
USTEC trade ideas
The Markets, the Rabbi and the Goat...It’s funny how sometimes markets react like people in old jokes…
They scream when things get bad, then cheer wildly when things return to how they were — as if something amazing just happened.
Let me tell you one of those jokes.
It’s about a house, a rabbi… and a goat.
A man goes to the Rabbi:
“Rabbi, my house is too small. The kids are screaming, my wife’s yelling, I’m losing my mind!”
The Rabbi calmly replies:
“Bring in the chicken.”
Two days later:
“Rabbi, it’s worse!”
Rabbi:
“Now bring in the duck.
Then the pig.
And finally… the goat."
Now the house is in complete chaos. Smell, noise, no space to move or breathe.
The man returns, ready to break down:
“Rabbi, this is hell!”
The Rabbi smiles:
“Now take them all out.”
A few days later, the man comes back glowing:
“Rabbi… it’s incredible! So much space! So quiet! So fresh!”
📉 Now, 2025 markets
In April, Trump imposed tariffs.
Markets fall sharply. Analysts scream recession. Headlines go full drama.
Recently, “brand new deals” have been announced.
Markets explode to new all-time highs.
Applause. Celebration. “Stability is back.”
But if you read the fine print…
The deal is basically the same old deal. Renegotiated. Repackaged.
Just without the goat.

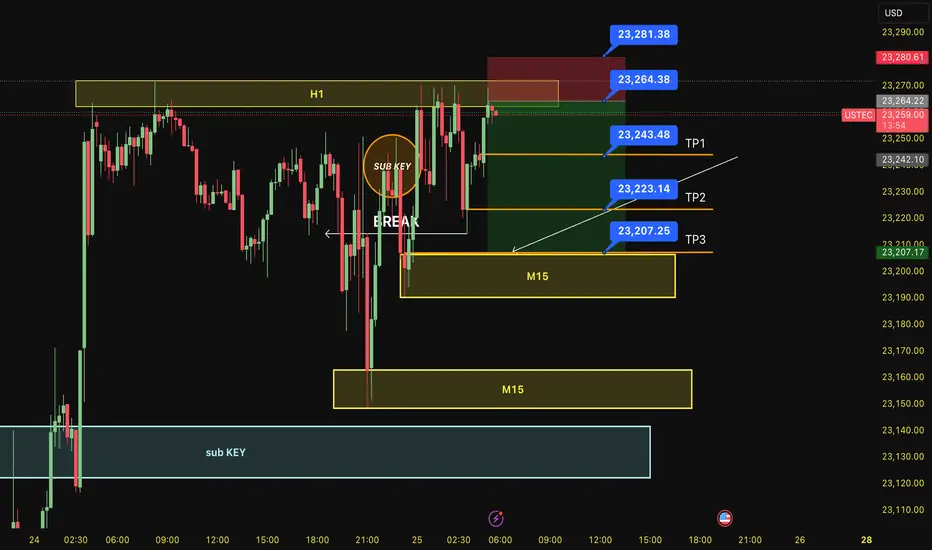
SELL USTEC 25.7.2025Reversal trade order: SELL at H1~M15 (all-time high - ATH)
Type of entry: Limit order
Reason:
- The price breakout the sub key of M15, confirming it will hit the main key M15.
- There is a key H1 support at the entry point.
Note:
- Management of money carefully at the price of bottom of M15 (23,343)
Set up entry:
- Entry sell at 23,264
- SL at 23,281
- TP1: 23,243
- TP2: 23,223
- TP3: 23,207
Trading Method: Price action (No indicator, only trend and candles)

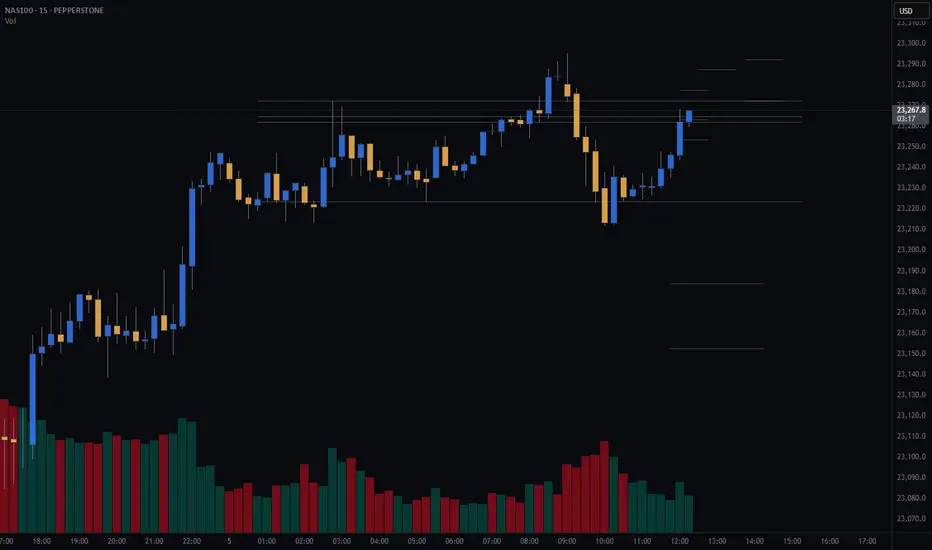
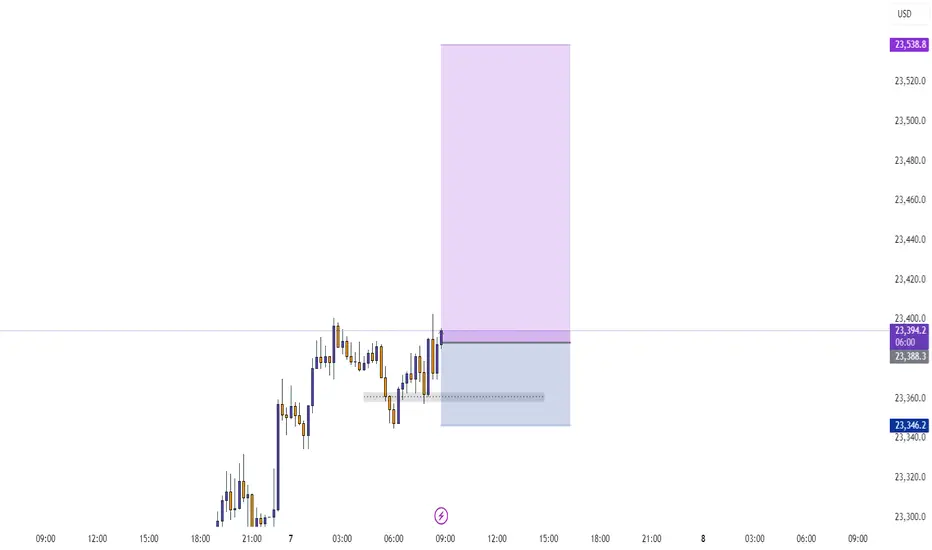
Nasdaq bull flag forming with a sweet entry.I think we've got a bull flag forming on the hourly on the NASDAQ. I think we need to take out this wick. And I think we come down and take out these stops just above where the red box is. And I think that's a pretty sweet entry before we go to new all-time highs. Um, let's see what happens. Hope you guys can follow.

NAS100 - LONGPrice pushed down a lot lower than I thought it would but sentiment still remains the same. Waiting for bullish confirmation for price to reach today's highs.

NAS100 - LONGstrong sell of this morning. Waiting for buyers to reenter the market and push price back to todays highs.

NASDAQ Index (US100 / NASDAQ) Analysis:The NASDAQ index has shown strong bullish momentum recently and is currently trading near a key resistance level at 23,530.
🔻 Bearish Scenario:
If the price fails to break above 23,530 and selling pressure begins to appear, we may see a downside correction toward 23,350. A break below this level could extend the decline toward 23,000.
🔺 Bullish Scenario:
If the price successfully breaks and holds above 23,530, it could support a continued move upward toward 23,730 as the first target. With sustained momentum, we might see a further push toward 24,000.
⚠️ Disclaimer:
This analysis is not financial advice. It is recommended to monitor the markets and carefully analyze the data before making any investment decisions.
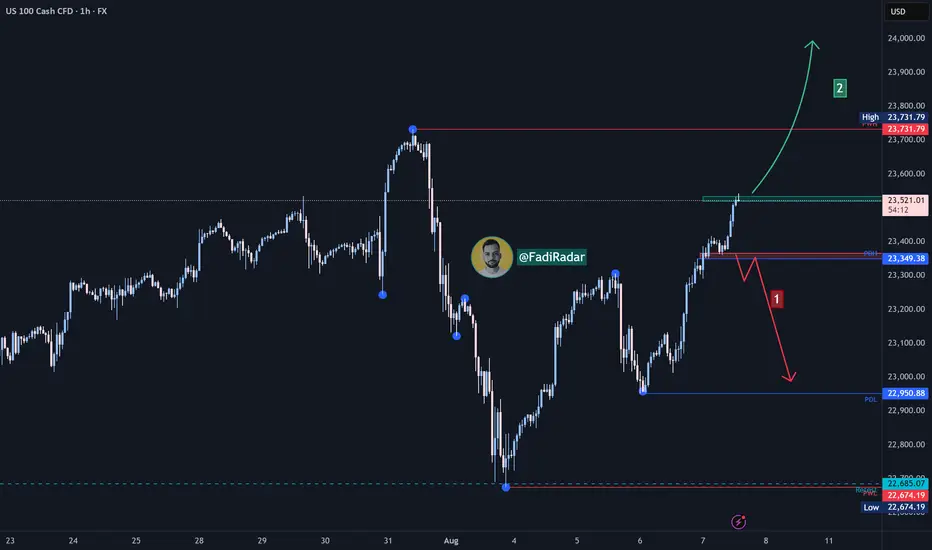
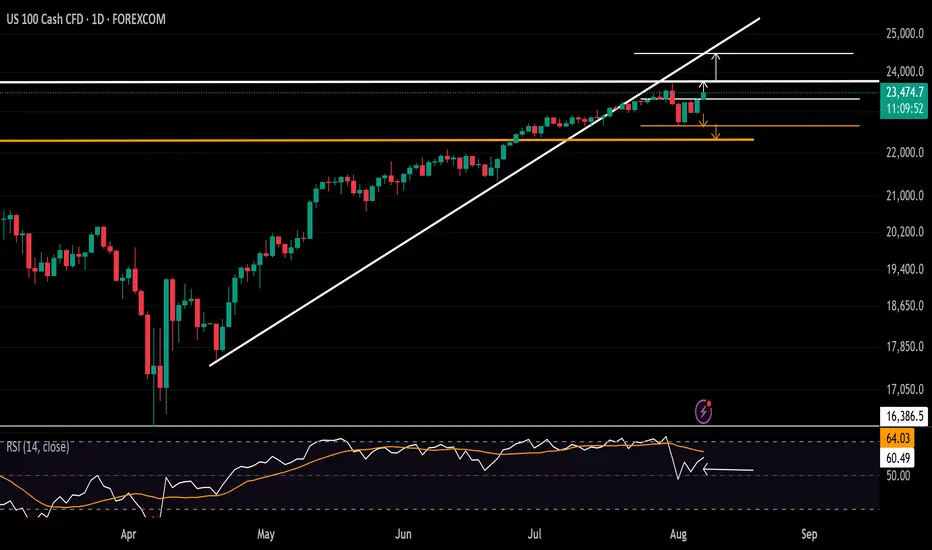
Nasdaq Eyes Record Highs Once AginNasdaq faces pressure as it trades below the trendline connecting the consecutive higher lows from April 2025. However, the latest decline rebounded from strong support at 22,700. Price action has reclaimed the 23,000 and 23,400 levels, suggesting a potential shift in tone.
A clean close above 23,500 is likely needed to push the index toward new highs above 23,700. From there, price may either pull back or continue an extended rally toward 24,000 and 24,400.
On the downside, if price falls back below 22,700, the risk increases for a move toward the previous key peaks from 2025 near 22,400 and 22,200.
- Written by Razan Hilal, CMT

BUY USTEC 7.8.2025Confluence order: BUY at M15
Type of order: Limit order
Reason:
- The current top is not touching anything, expected to rise to the sub-key of H1~M15 above.
- M15~FIBO 0,5-0,618 (same position)
Note:
- Management of money carefully at the last bottom (23,,367)
Set up entry:
- Entry buy at 23,339
- SL at 23,317
- TP1: 23,367 (~1R)
- TP2: 23,403 (~3R)
- TP3: 23,459 (~5R)
Trading Method: Price action (No indicator, only trend and candles)

Aug 6th corrective phase, bullish trade setup The Nasdaq 100 is a tech-heavy index, highly sensitive to macroeconomic factors like interest rates, tech earnings, and market sentiment. On August 6, 2025, the market is likely influenced by:
• Monetary Policy: Recent Federal Reserve actions (rate cuts or pauses) could drive bullish momentum, as lower rates favor growth stocks in the Nasdaq.
• Economic Data: Employment, CPI, or tech sector earnings reports could impact volatility.
• Technical Levels: Fibonacci retracements, support/resistance, and trendlines are critical for intraday trading.
I entered Nasdaq above the 0.382 level (23,056.4), First target 23400 was reach at approximately 7pm PST the next targets are the 1.0 (23,700)
*this is not financial advice entertain at your own risk 📊📈
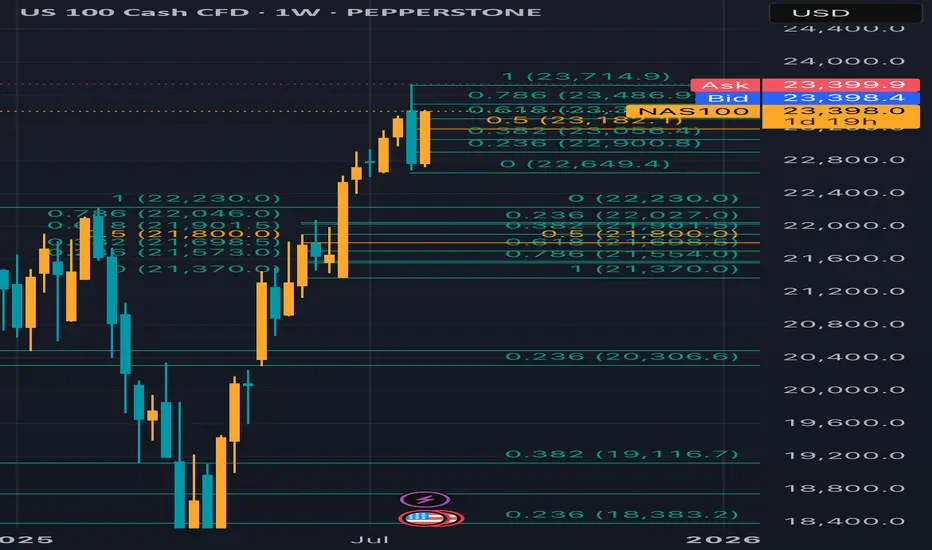
NAS100 at mjaor resistance area Fib 0.5Price has reached the 0.5–0.382 Fibonacci retracement zone of the recent swing. If the bears are strong, we may see a rejection toward the trendline support. However, if this resistance is broken, a bullish continuation is also possible. Let's see how it plays out.

Nasdaq Pumping High, We Might Ride The WavePrice today(Wed) is recovering from yesterday's (Tue) dumping. Our bullish direction is still intact.
Entries should be taken once, price has entered within our Area of Opportunity.
Targets with their success rate have been outlined on the charts.

NSDQ100 Pre US Open Key Trading levelsTrade Policy & Tariff Risks:
Donald Trump escalated trade rhetoric, signaling higher tariffs on countries importing Russian energy, and previewing new tariffs on semiconductors and pharmaceuticals within days. This raises geopolitical and supply chain uncertainty—key risks for NSDQ 100 tech and healthcare stocks, particularly chipmakers, drug manufacturers, and firms exposed to global trade.
Swiss Tariff Dispute:
Swiss President Keller-Sutter is in Washington seeking to lower a newly imposed 39% tariff—highlighting the broader unpredictability of US trade actions, which could fuel market volatility and weigh on investor sentiment.
Ukraine Conflict & Sanctions Outlook:
As the US pushes toward an Aug. 8 deadline to resolve the Ukraine conflict, Trump's envoy is in Moscow. Potential Kremlin concessions (e.g., halting airstrikes) may reduce geopolitical risk premiums, especially for defense, energy, and global consumer tech firms.
Federal Reserve & Rate Policy:
With Fed Governor Kugler resigning, Trump is expected to name a replacement this week. His ongoing pressure on the Fed to cut rates adds policy uncertainty. This could support rate-sensitive NSDQ stocks in the near term, especially growth names in tech, if dovish expectations build.
Takeaway for NSDQ100 Traders:
Expect increased volatility around tariff news, Fed appointments, and geopolitical headlines. Traders should watch for:
Semiconductor stocks (e.g., NVDA, AMD, INTC) under pressure from tariff threats.
Big tech and biotech swings tied to pharma trade policy.
Potential relief rallies if Russia concessions materialize or Fed commentary turns dovish.
Key Support and Resistance Levels
Resistance Level 1: 23300
Resistance Level 2: 22430
Resistance Level 3: 23680
Support Level 1: 22677
Support Level 2: 22580
Support Level 3: 22388
This communication is for informational purposes only and should not be viewed as any form of recommendation as to a particular course of action or as investment advice. It is not intended as an offer or solicitation for the purchase or sale of any financial instrument or as an official confirmation of any transaction. Opinions, estimates and assumptions expressed herein are made as of the date of this communication and are subject to change without notice. This communication has been prepared based upon information, including market prices, data and other information, believed to be reliable; however, Trade Nation does not warrant its completeness or accuracy. All market prices and market data contained in or attached to this communication are indicative and subject to change without notice.
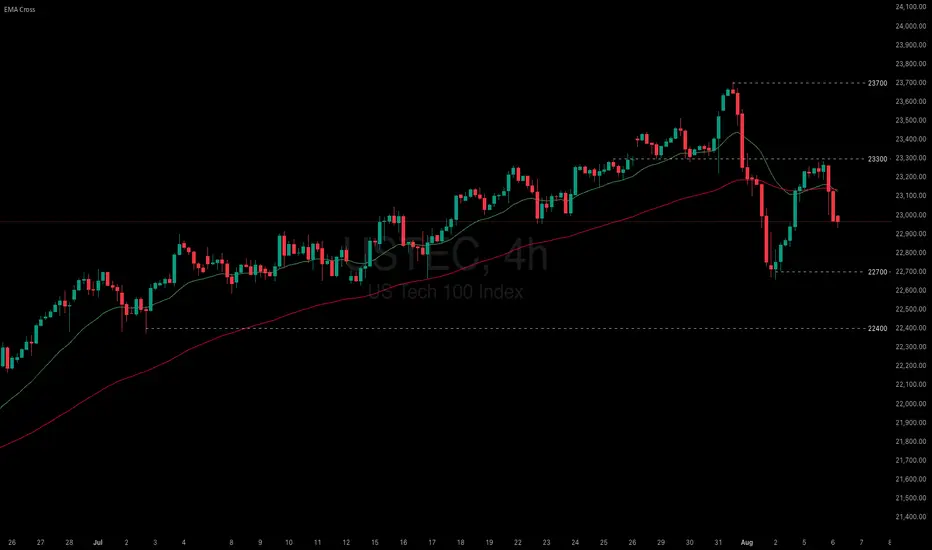
US indices paused as fragile macro data undermined recent gains
US equity gains paused amid President Trump’s renewed tariff threats and weakening economic data. Trump warned of steep tariff hikes on India and a potential 35% levy on the EU if obligations are not met. Meanwhile, the US July Services PMI fell from 50.8 to 50.1, missing the 51.5 consensus. New orders dropped to 50.3, while employment declined to 46.4—the lowest since March.
USTEC briefly tested 23300 before breaking below both EMAs. The widening gap between EMA21 and EMA78 suggests a potential shift toward bearish momentum. If USTEC fails to break above the resistance at 23300, the index could decline further toward 22700. Conversely, if USTEC breaks above both EMAs and 23300, the index may gain bullish traction toward 23700.
NAS100 vs AUS200 ShortThis ratio measure is not net short on the regression break.
It indicates there is mis-pricing of risk and you should take cation in the coming weeks.

In the middle of IndecisionIf we can close the 4h-Candle above 23,409 or 23220 level, then we are extremely bullish and might break above the recent high of 23715. If not, we might see a pullback towards 50% retracement at 22176 and even further.

ISM Report Causes Big red candle🚨 News Candle - ISM report lower than expected 50.5, Actual 50.1 . Big red candle in USTECH / NASDAQ
#ustech #nasdaq #ism

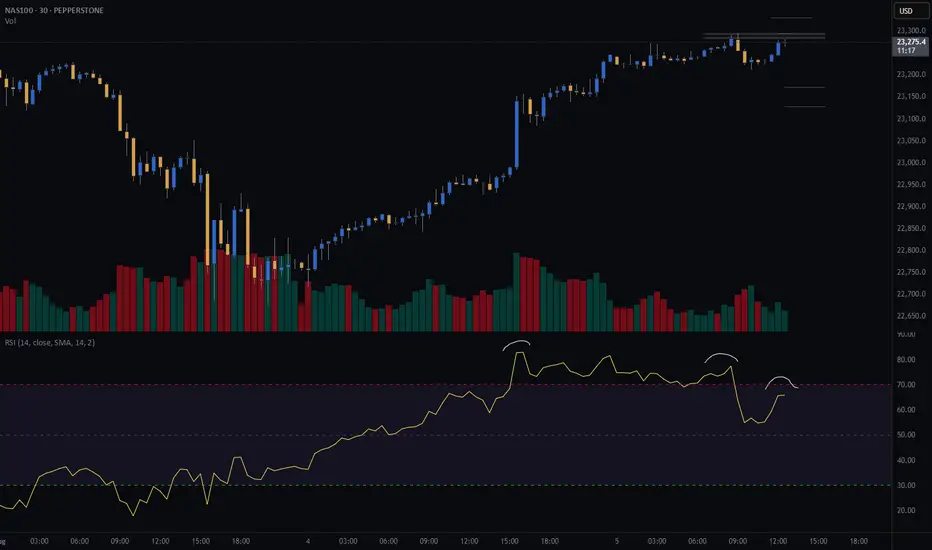
NAS100 (CASH100) Short - Double top 30minThe 15min head and shoulders setup got invalidated.
However, my double top variables are currently being met.
Still need confirmation before entering trade.
Risk/reward = 2.7
Entry price = 23 284
Stop loss price = 23 331
Take profit level 1 (50%) = 23 173
Take profit level 2 (50%) = 23 129
What does everyone thing the NASDAQ is going to do today?
Long entry ON 1min off of daily bullish retracemen going into exMy overall bias is bullish and on the daily price was retracing into a high volume node which I then zoom into the 1min to find an entry. that entry was in a smaller time frame palace zone which price purge and heading upwards. Final TP is at 16.18rr due to me be trying to pass a phase in a prop firm. The real tp is like 40rr if I wasn't doing a challange

NASDAQ (CASH100) SHORT - head and shoulders 15minPotential short on nas100 (cash100) with head and shoulders on the 15min.
Still waiting for confirmation on some of my variables before I enter.
Risk/reward = 3.3
Entry price = 23 262
Stop loss price = 23 287.3
Take profit level 1 (50%) = 23 184
Take profit level 2 (50%) = 23 153
What do you guys and girls think the nasdaq is going to do?