GBP/AUD Heist: Bullish Breakout Plan to Steal Profits!🌟 Pound vs. Aussie Heist: GBP/AUD Trading Plan 🚀💸
Hey Money Makers & Thieves! 🤑💰 Ready to pull off a master heist on the GBP/AUD Forex market? Based on 🔥 Thief Trading Style 🔥 blending technicals and fundamentals, here’s the plan to conquer the "Pound vs. Aussie" with a long entry strategy targeting the high-risk Red Zone. Let’s dive in! 📈🎯
Entry 📈:
The heist is live! Wait for the MA breakout at 2.10000 to strike—bullish profits are calling! 🔔
Set buy stop orders above the Moving Average for breakout entries.
Or, place buy limit orders on a 15 or 30-minute timeframe at the most recent swing low/high for pullback entries.
📌Pro tip: Set an alert on your chart to catch the breakout moment! 🚨
Stop Loss 🛑:
Protect your loot with a Thief SL at the recent swing low/high on the 4H timeframe (2.07400).
Adjust SL based on your risk, lot size, and number of orders. Stay sharp! 🔍
Target 🎯:
Aim for 2.14400 or exit early to secure profits before the target. Don’t get greedy! 💪
Scalpers, Listen Up 👀:
Stick to the long side for quick scalps.
Big players can jump in now; smaller traders, join the swing trade robbery with a trailing SL to lock in gains. 💰
Market Outlook 💵:
GBP/AUD is riding a bullish wave, fueled by fundamentals, macro trends, COT reports, quantitative analysis, sentiment, and intermarket dynamics. Stay updated as these can shift fast! 🌎📊
⚠️ Trading Alert: News & Position Management 📰:
Avoid new trades during news releases to dodge volatility traps.
Use trailing stop-loss orders to protect running positions and secure profits. 🚫
Latest Market Data (UTC+1, May 20, 2025, 12:02 PM BST):
Forex (GBP/AUD): Current price ~2.09850 (source: financialjuice.com).
COT Report (Latest Friday, May 16, 2025):
Non-commercial long positions increased, signaling bullish sentiment among large speculators.
Net long positions rose by 5,200 contracts (source: CFTC.gov).
Commodities & Metals: Gold and oil prices stable, supporting AUD strength but GBP bolstered by UK economic data.
Indices & Crypto: No direct impact, but risk-on sentiment in global indices supports bullish GBP/AUD bias.
💖 Boost the Heist! 💥:
Hit the Boost Button to power up our robbery team! 🤝 With the Thief Trading Style, we’re stealing profits daily. Stay tuned for the next heist plan! 🐱👤🚀
Happy trading, and let’s make that money! 💸🎉
Disclaimer: Trading involves risk. Always manage your risk and stay informed.
GBPAUD trade ideas

GBP/AUD For Bullish as pull-backwait for pull-back near by entry point and then go long
general trend is down trend
current phase is pull-back
have fun :)

GBPAUD Will Collapse! SELL!
My dear subscribers,
This is my opinion on the GBPAUD next move:
The instrument tests an important psychological level 2.0828
Bias - Bearish
Technical Indicators: Supper Trend gives a precise Bearish signal, while Pivot Point HL predicts price changes and potential reversals in the market.
Target - 2.0715
My Stop Loss - 2.0895
About Used Indicators:
On the subsequent day, trading above the pivot point is thought to indicate ongoing bullish sentiment, while trading below the pivot point indicates bearish sentiment.
Disclosure: I am part of Trade Nation's Influencer program and receive a monthly fee for using their TradingView charts in my analysis.
———————————
WISH YOU ALL LUCK

GBPAUD sell Setup nice potentialGBPAUD sell Setup nice potential.
of course this is my view, not recommendation

GBPAUD SELL 2.0966On the 4-hour chart, GBPAUD has stabilized and moved upward in the short term. Currently, we can pay attention to the area around 2.0966 above. This position is a potential short-selling position for a bearish bat pattern, and this position is within the previous supply area.

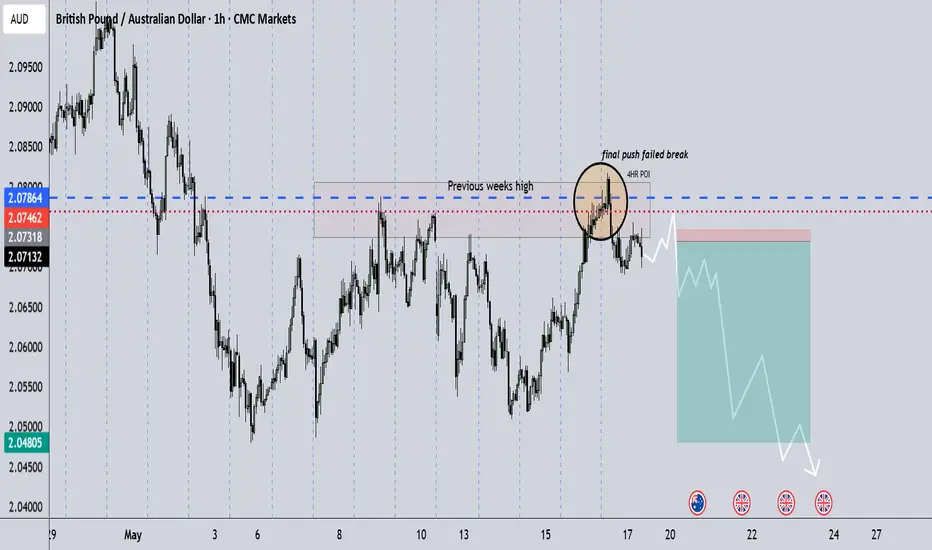
GBPAUD – Eyeing a Short-Term ReboundGBPAUD – Eyeing a Short-Term Rebound
📈 Long Bias | 🎯 Target: 2.07216 | 🕒 15-Min Chart
Looking for a possible reaction back into the 2.07216 zone after this aggressive selloff. Momentum could carry price higher for a quick intraday opportunity. Already monitoring closely.
⚠️ Not financial advice. Trade your own plan.
#GBPAUD #Forex #ReversalZone #IntradaySetup #GlobalHorns #TradingView

GBP-AUD Double Top Pattern! Sell!
Hello,Traders!
GBP-AUD made a retest
Of the horizontal resistance
Level of 2.0820, then
Established a double-top
Pattern and is now going
Down so we are locally
Bearish biased which
Means that we will be
Expecting a further
Bearish move down
Sell!
Comment and subscribe to help us grow!
Check out other forecasts below too!
Disclosure: I am part of Trade Nation's Influencer program and receive a monthly fee for using their TradingView charts in my analysis.

GBPAUDGBP/AUD Interest Rate Differential and Directional Bias (May–June 2025)
Interest Rate Differential
Bank of England (BoE):
Policy rate: 4.25% (cut from 4.5% in May 2025).
Outlook: Further cuts likely, but pace depends on inflation (currently 2.6% YoY) and growth (Q1 GDP: 0.6% QoQ). Markets expect 1–2 more cuts in 2025, potentially lowering rates to 4.0% by year-end.
Reserve Bank of Australia (RBA):
Policy rate: 3.85% (cut by 25 bps on May 20, 2025).
Outlook: Two additional cuts expected in 2025 (to 3.35%) due to subdued core inflation (2.9% in Q1) and global trade risks.
Differential: +0.40% in favor of GBP, narrowing as RBA cuts outpace BoE easing.
Key Economic Data and Drivers
United Kingdom
GDP Growth: Q1 2025 growth outperformed expectations at 0.6% QoQ, though manufacturing and industrial production lagged.
Inflation: March CPI fell to 2.6%, but energy-driven price pressures may push it to 3.5% in Q3 2025.
Australia
Employment: April jobs data showed 20.9K jobs added (vs. 32.2K expected), with unemployment steady at 4.1%.
Trade Risks: U.S.-China tariff ceasefire reduces immediate pressure, but export reliance on China leaves AUD vulnerable.
Directional Bias
Short-Term (Days–Weeks): Bearish GBPAUD
RBA Aggression: Immediate post-cut AUD weakness expected, but faster RBA easing vs. BoE could narrow the rate gap.
Growth Divergence: UK’s stronger GDP vs. Australia’s reliance on China may support GBP.
Long-Term (6+ Months): Bullish GBPAUD
Rate Differential Stability: BoE’s slower cuts vs. RBA’s aggressive easing may widen the gap, favoring GBP.
Commodity Risks: AUD remains exposed to China’s economic slowdown and iron ore price volatility.
Summary Table
Time Frame Bias Key Drivers Technical Levels
Short-Term Bearish RBA cuts, technical breakdown 2.0565 (S), 2.0732 (R)
Medium-Term Neutral/Bullish UK growth resilience, channel support 2.0490–2.0720 (Channel)
Long-Term Bullish Diverging central bank policies, AUD risks 2.1000+ (Target)
Critical Factors to Monitor
BoE Communications: Signals on future cuts (next meeting: June 19, 2025).
RBA Policy: Additional cuts in 2025 (next decision: June 3).
UK Inflation (May 29): Core PCE data critical for BoE’s path.
Conclusion:
GBP/AUD faces near-term bearish pressure from RBA cuts and technical breakdowns, but medium-to-long-term trends favor GBP due to slower BoE easing and UK growth resilience. Watch for shifts in central bank rhetoric and key technical levels for directional confirmation.

GBPAUD: Growth & Bullish Forecast
It is essential that we apply multitimeframe technical analysis and there is no better example of why that is the case than the current GBPAUD chart which, if analyzed properly, clearly points in the upward direction.
Disclosure: I am part of Trade Nation's Influencer program and receive a monthly fee for using their TradingView charts in my analysis.
❤️ Please, support our work with like & comment! ❤️

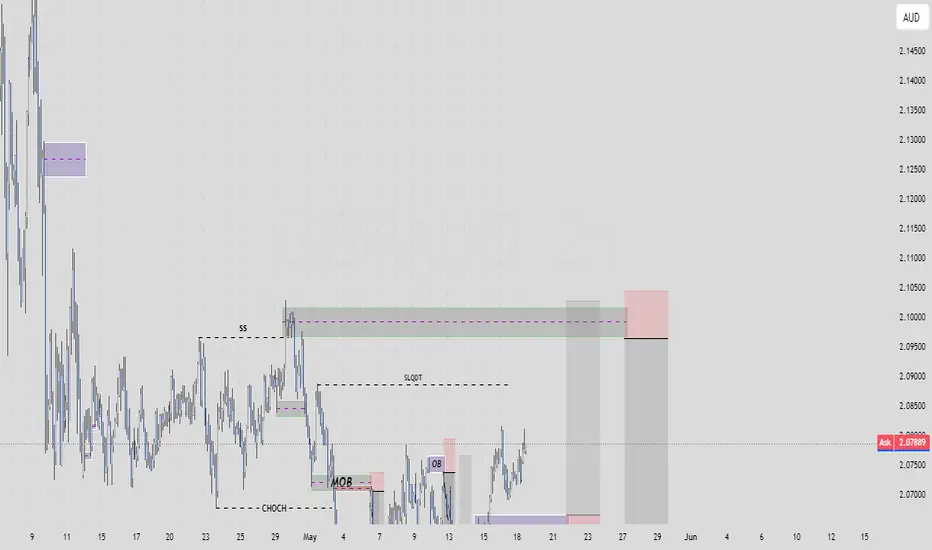
A continuation buy from the OB and a sell (SBI)A continuation buy from the Order Block, we hope to catch the buy. And for the sell, we see a Sweep Break and Retest (SBI), a type one setup. if the buy breaks the current high, then the sell (SBI) is no longer valid, we aim for the next higher high.
gbpaud buy signal. Don't forget about stop-loss.
Write in the comments all your questions and instruments analysis of which you want to see.
Friends, push the like button, write a comment, and share with your mates - that would be the best THANK YOU.
P.S. I personally will open entry if the price will show it according to my strategy.
Always make your analysis before a trade

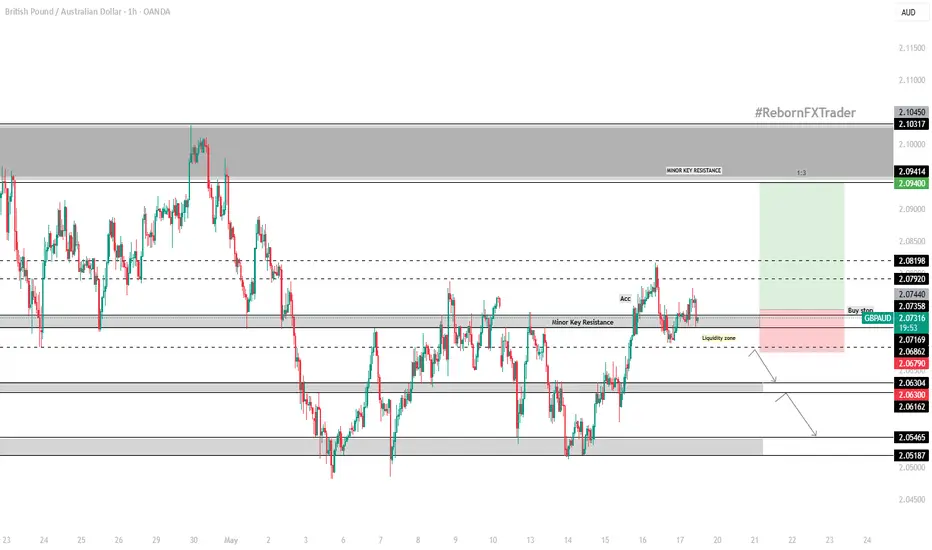
GBP/AUD 1hr-Timeframe – Technical and Fundamental AnalysisGBP/AUD 1hr-Timeframe – Technical and Fundamental Analysis
The GBP/AUD pair is showing signs of bullish continuation on the 1-Hr chart, price was also in consolidation phase from previous uptrend following a breakout above a minor resistance level at 2.07200. This price action signals a potential change of character (CHOCH), suggesting bullish momentum is building.
After the breakout, price began consolidating within the 2.07200–2.07440 zone, forming an accumulation pattern that suggests a liquidity grab occurred below prior lows. The price is now approaching a short-term area of interest around 2.07440. A sustained move above this zone could validate bullish continuation, with a target set at the next resistance level near 2.09400. A protective stop-loss is ideally placed below the recent low at 2.06790.
This chart setup reflects a market preparing for potential upside, supported by both technical structure and broader fundamental drivers.
Fundamental Analysis (As of May 19, 2025):
The British Pound has shown strength relative to the Australian Dollar, driven by diverging economic indicators between the UK and Australia.
📈 Key Drivers of GBP Strength vs AUD Weakness:
Strong UK Economic Performance: Recent data out of the UK, including better-than-expected GDP and employment figures, has boosted confidence in the pound.
Dovish RBA Outlook: The Reserve Bank of Australia has hinted at holding or even cutting interest rates due to weak inflation and economic growth.
Chinese Demand Concerns: As a major trading partner, China’s economic slowdown continues to negatively affect Australia’s export-driven economy, especially in commodities.
Falling Commodity Prices: Softness in global demand for key Australian exports like iron ore and coal has added pressure on the AUD.
Weaker Australian fundamentals, including soft job numbers and a dovish RBA, while AUD faces additional pressure as the cash rate forecast dropped to 3.85% from 4.10%.
📌 Disclaimer:
This is not financial advice. As always, wait for proper confirmation before executing trades. Manage your risk wisely and trade what you see, not what you feel.
GBPAUD LongHi traders, GBPAUD Weekly and Daily market structure are trending in the same direction, and the market is going up from a monthly/weekly resistance support pivot point aera, even if the market on the 4h time frame is trending to the downside, we should still be looking to buy the market to the upside because the higher time frames are stronger. This is my own thoughts.

GBPAUD Buy Setup: Bullish Formation with Strong Support Reaction📈 Weekly Overview:
Price is holding firmly at the weekly support zone, aligned with the 14EMA, suggesting that buyers are stepping in to defend this key level.
📆 Daily Chart Explanation:
The daily timeframe has formed a potential double bottom pattern, a classic reversal signal. Price is rejecting the 50EMA with consecutive bullish candles, indicating a shift in momentum from sellers to buyers.
⏱ 4H Chart Explanation:
On the 4H timeframe, price is trending above the 50EMA, maintaining a bullish structure. It has recently retraced to a discounted zone and shown a clear reaction, suggesting the possibility of a new leg up. I will wait for confirmation from the lower timeframe before entering to ensure the uptrend resumes with strength.
🧭 Plan:
Bias: Bullish
Entry: After confirmation in the lower time frame (1H or 15M bullish structure / trendline break)
Targets: 1st TP near recent swing high, 2nd TP at higher daily resistance
Invalidation: If price breaks below the discounted zone and 4H structure turns bearish

GBPAUDLooking at gbpaud as my possible trade for the coming week,we have come back to the poi after reacting to it and pushing out last week,looknig at news for the week i suspect this coming week will be the big move week
GBPAUD Will Collapse! SELL!
My dear friends,
My technical analysis for GBPAUD is below:
The market is trading on 2.0749 pivot level.
Bias - Bearish
Technical Indicators: Both Super Trend & Pivot HL indicate a highly probable Bearish continuation.
Target - 2.0638
Recommended Stop Loss - 2.0826
About Used Indicators:
A pivot point is a technical analysis indicator, or calculations, used to determine the overall trend of the market over different time frames.
Disclosure: I am part of Trade Nation's Influencer program and receive a monthly fee for using their TradingView charts in my analysis.
———————————
WISH YOU ALL LUCK

What’s the Next Move for GBP/AUD?
The GBP/AUD pair is trading in an uptrend, forming higher highs and higher lows, and the current pullback is considered a corrective move within this upward trend.
The level of 2.05763 is seen as a positive support level for the pair, where a potential rebound to the upside could occur, targeting the 2.07442 level.
However, if the price falls below the 2.05110 level and closes a 4-hour candle beneath it, the bullish scenario would be invalidated, and the trend would shift from bullish to bearish.
Note:
Traders should monitor economic news and data related to the Australian dollar and the British pound, as their outcomes can significantly impact the movement of this currency pair.

GBP/AUD BEST PLACE TO SELL FROM|SHORT
Hello, Friends!
GBP/AUD is trending down which is obvious from the red colour of the previous weekly candle. However, the price has locally surged into the overbought territory. Which can be told from its proximity to the BB upper band. Which presents a great trend following opportunity for a short trade from the resistance line above towards the demand level of 2.047.
Disclosure: I am part of Trade Nation's Influencer program and receive a monthly fee for using their TradingView charts in my analysis.
✅LIKE AND COMMENT MY IDEAS✅

GBPAUDAFTER looking at the central bank policies of both banks and interest rate differentials will seeded a buy idea in favor of British pounds sterling and get a swing into sell zone .we hope that the demand floor will be wept off to align with the descending trendline acting as demand floor for another major swing .

GBP/AUD potential long continuation May 2025Potential long position for what concern this pair.
In the last month we saw a new high set from 2020, passing the previous Covid high, taking out also the January of 2016.
However the candle close with a big wick.
For what concern the eventual targets I'm considering the wick high or the Fibonacci extension.

GBPAUD Wave Analysis – 15 May 2025
- GBPAUD reversed from the support zone
- Likely to rise to resistance level 2.1000
GBPAUD currency pair recently reversed up from the support zone between the pivotal support level 2.050 (which has been reversing the price from the end of March), the lower daily Bollinger Band and the 61.8% Fibonacci correction of the upward impulse from January.
The upward reversal from the support zone stopped the C-wave of the previous short-term ABC correction 4 from the start of April.
Given the predominant daily uptrend, GBPAUD currency pair can be expected to rise to the next resistance level 2.1000.

GBPAUD buy limit at supportWait to buy at support zone line with a short -term target of at least +10%

GBPAUD - Signaling Further Downside PotentialGBPAUD is forming bearish continuation patterns, signaling further downside potential.
Since May 1st, the price has been in a larger accumulation phase.
A new bearish pattern is emerging within the 2.0490 - 2.0770 range.
If the price follows the red scenario, this pattern may continue to develop more before the bearish trend resumes again.
However, a break below 2.0490 could trigger a stronger bearish wave, pushing GBPAUD lower toward key targets as shown from the scenario in blue:
🔹 Target 1: 2.0350 🔹 Target 2: 2.0150
You may find more details in the chart!
Thank you and Good Luck!
❤️PS: Please support with a like or comment if you find this analysis useful for your trading day❤️
Disclosure: I am part of Trade Nation's Influencer program and receive a monthly fee for using their TradingView charts in my analysis.
