GBPAUD trade ideas

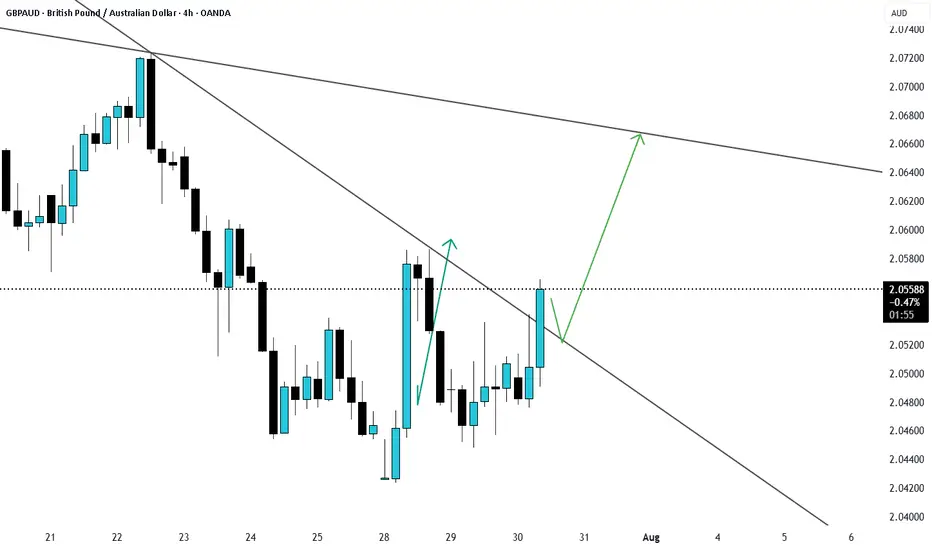
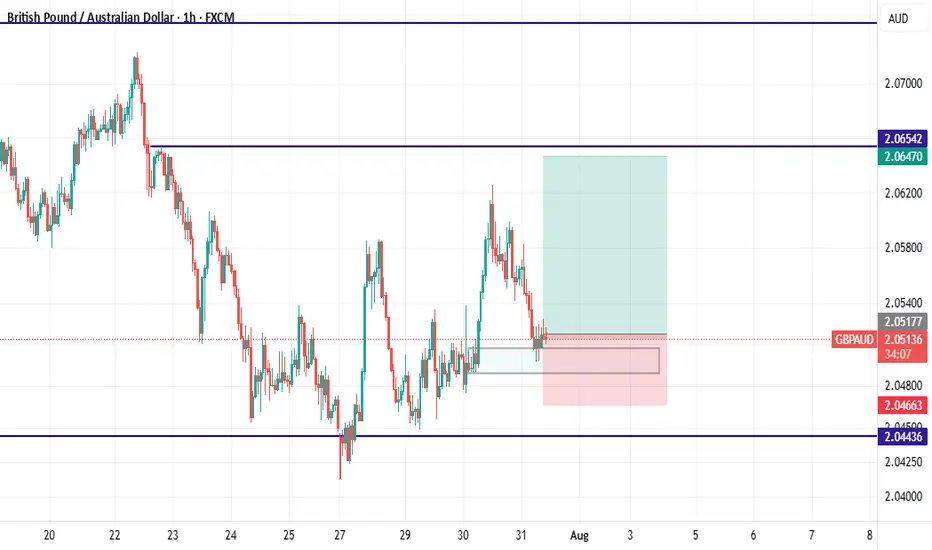
GBP/AUD: Pound Surge to 2.066?FX:GBPAUD is forming a bullish reversal on the 4-hour chart, testing support at 2.05037 with a buy trigger between 2.05037-2.05115. Target 2.066 aligns with the next resistance level, offering a solid risk-reward setup. Set a stop loss at 2.0493 below the recent low. Watch GBP strength and AUD data for catalysts. Trade with precision!
Share your opinion with me in the comments.
#GBPAUD #ForexTrading #TechnicalAnalysis #TradingView #CurrencyPairs #DayTrading #MarketSignals

Lingrid | GBPAUD Bearish Pressure. Potential ShortThe price perfectly fulfilled my previous idea . FX:GBPAUD rebounded from support and has climbed into a tight resistance zone near 2.05836, but momentum remains weak near the downward trendline. The price structure shows a sequence of lower highs and a tight range below resistance, suggesting sellers are still in control. A rejection at this level would confirm another failed breakout attempt. If confirmed, the pair could revisit the 2.03500 support area with bearish continuation pressure.
📌 Key Levels
Sell trigger: Rejection at 2.05836 and break of 2.05000
Sell zone: 2.05800–2.06000
Target: 2.03500
Invalidation: Strong break and close above 2.06000
💡 Risks
Bullish breakout above trendline resistance
Fundamental surprise (UK/AU economic data)
Shift in broader risk sentiment or AUD weakness
If this idea resonates with you or you have your own opinion, traders, hit the comments. I’m excited to read your thoughts!

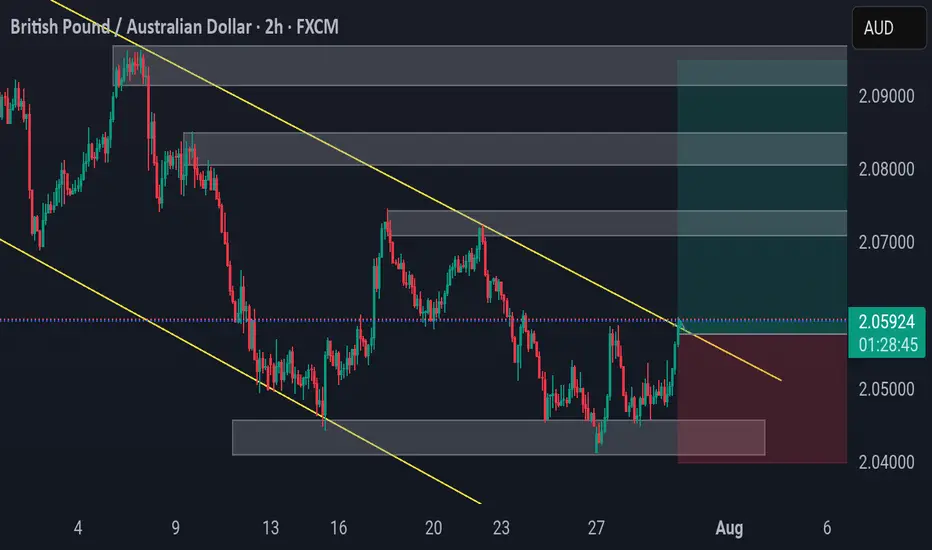
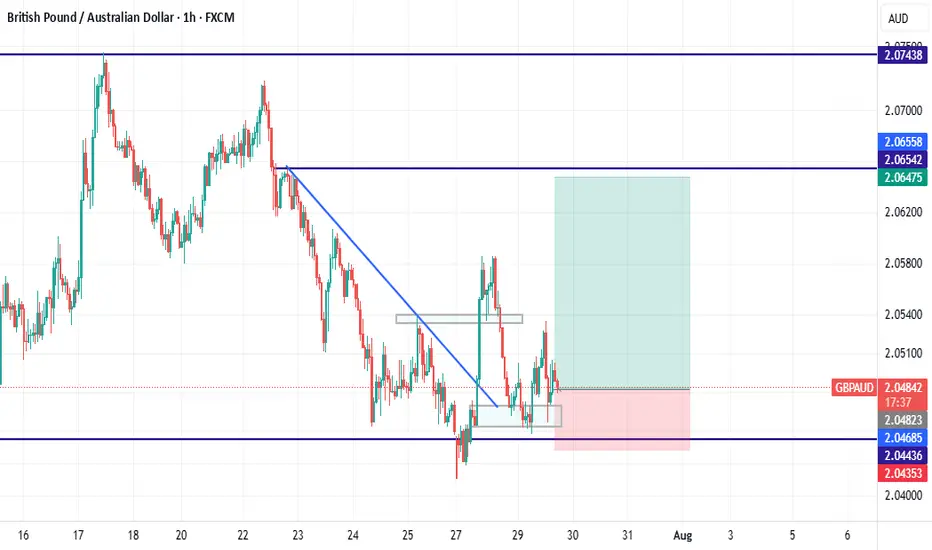
GBP/AUD SHORT 200 PIPS 1-10 RR🎯 1. Resistance at Trendline & Horizontal Zone
The price is touching a descending trendline (in yellow), coupled with a horizontal resistance zone (light-blue/boxed) just above.
This area acted as support earlier and now has flipped to resistance—classic supply–resistance confluence.
2. Structure Shift – Lower High Forming
The most recent swing high is lower than the previous peak, indicating weakening momentum and possible shift into a downtrend.
Market structure aligns in favor of sellers.
3. Trendline Rejection (Backtest)
The price attempted to breach the descending line but failed and pulled back below it.
Indicates lack of bullish conviction and a likely continuation downward.
4. Risk–Reward Zone
The red zone indicates your stop-loss placed just above the resistance zone/trendline confluence — a tight and logical level.
The large blue rectangle below represents your potential profit target — good R:R.
In essence, you're risking small for a larger reward.
5. Confirmation via Price Action
Notice the recent wick-up into resistance followed by bearish rejection (candles showing rejections).
This is a typical reversal signal at a strong confluence area.

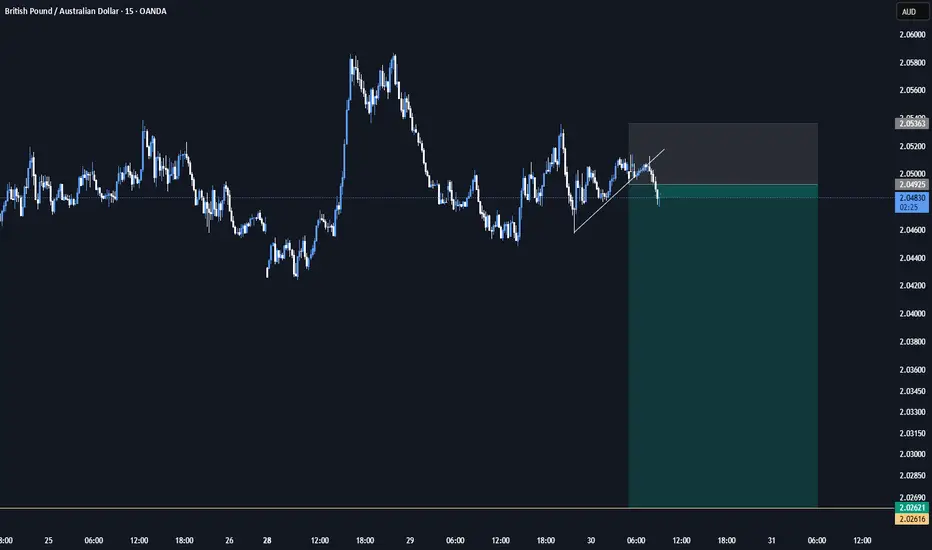
GBP AUD Price is showing strong signs of accumulation near the 2.0450–2.0470 demand zone, forming a clean range low sweep + BOS (Break of Structure).
🔹 Area of Interest: Watching for a retracement back into the marked zone for a potential long setup.
🔹 Confirmation: Break of structure confirmed at ~2.0535
🔹 Stop: Below the sweep low (~2.0420)
🔹 Target: Above previous supply zone (~2.0650–2.07), expecting a strong impulsive leg up if momentum sustains.

GBPAUDI’m confident in the short-term upward trend. I’ll monitor how the price reacts when it reaches my anticipated level, but until then, I need to remain precise and realistic about my targets.

GBP/AUD At Very Interesting Buy Area , Don`t Miss 150 Pips !Here is my GBP/AUD 4H Chart and this is my opinion , the price moved very hard to downside And now creating new wave in the 4H Up Trendline and the price at strong support now 2.05000 which is forced the price many times to go up , so it`s my best place to enter a buy trade , and if you checked the chart you will see the price creating the new higher low to complete the new higher high . if we have a daily closure below my support area then this idea will not be valid anymore .

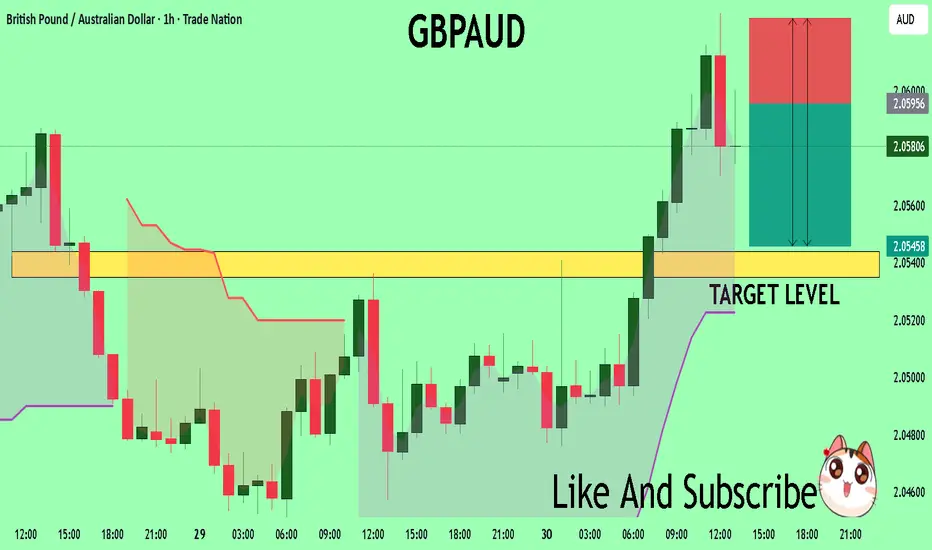
GBPAUD Massive Short! SELL!
My dear subscribers,
My technical analysis for GBPAUDis below:
The price is coiling around a solid key level - 2.0596
Bias - Bearish
Technical Indicators: Pivot Points Low anticipates a potential price reversal.
Super trend shows a clear sell, giving a perfect indicators' convergence.
Goal - 2.0543
My Stop Loss - 2.0626
About Used Indicators:
By the very nature of the supertrend indicator, it offers firm support and resistance levels for traders to enter and exit trades. Additionally, it also provides signals for setting stop losses
Disclosure: I am part of Trade Nation's Influencer program and receive a monthly fee for using their TradingView charts in my analysis.
———————————
WISH YOU ALL LUCK
GBPAUD Breakout of resistance 4 hr GBPAUD candle has broken the trendline resistance and is likely to go up. enter on retesting the support.
GBPAUD 2H – Clean Breakout SetupGBPAUD 2H – Clean Breakout Setup
Price has broken out of a descending channel and is retesting structure. Demand zone held firm, and bullish momentum is building.
Setup by PULSETRADESFX
T g.
#ForexSignals #GBPAUD #BreakoutTrade #RiskManagement #PulseTradesFX
GBPAUD I Weekly CLS I Model 2 I Target 0B and full CLSYo Market Warriors ⚔️
Fresh outlook drop — if you’ve been riding with me, you already know:
🎯My system is 100% mechanical. No emotions. No trend lines. No subjective guessing. Just precision, structure, and sniper entries.
🧠 What’s CLS?
It’s the real smart money. The invisible hand behind $7T/day — banks, algos, central players.
📍Model 1:
HTF bias based on the daily and weekly candles closes,
Wait for CLS candle to be created and manipulated. Switch to correct LTF and spot CIOD. Enter and target 50% of the CLS candle.
Model 1 Done
Analysis done on the Tradenation Charts
Disclosure: I am part of Trade Nation's Influencer program and receive a monthly fee for using their TradingView charts in my analysis.
Trading is like a sport. If you consistently practice you can learn it.
“Adapt what is useful. Reject whats useless and add whats is specifically yours.”
David Perk aka Dave FX Hunter
💬 Don't hesitate to ask any questions or share your opinions

buy gbpaudwe reach to support level and have a up trend and now price reach to a demand zone and we have spin candles and we enter...
GBPAUD SHORT IDEAIm looking for short on GBPAUD based on current trend and price action and RSI not reach yet the overbought level on daily. And CPI AUD news will come in few minutes . All the best traders
buy gbpaudwe reach to a support level and break trend line and also break last LH and also pullback to a strong demand zone....
GBPAUD is Holding above the Support , All Eyes on BuyingHello Traders
In This Chart GBPAUD HOURLY Forex Forecast By FOREX PLANET
today GBPAUD analysis 👆
🟢This Chart includes_ (GBPAUD market update)
🟢What is The Next Opportunity on GBPJPY Market
🟢how to Enter to the Valid Entry With Assurance Profit
This CHART is For Trader's that Want to Improve Their Technical Analysis Skills and Their Trading By Understanding How To Analyze The Market Using Multiple Timeframes and Understanding The Bigger Picture on the Charts


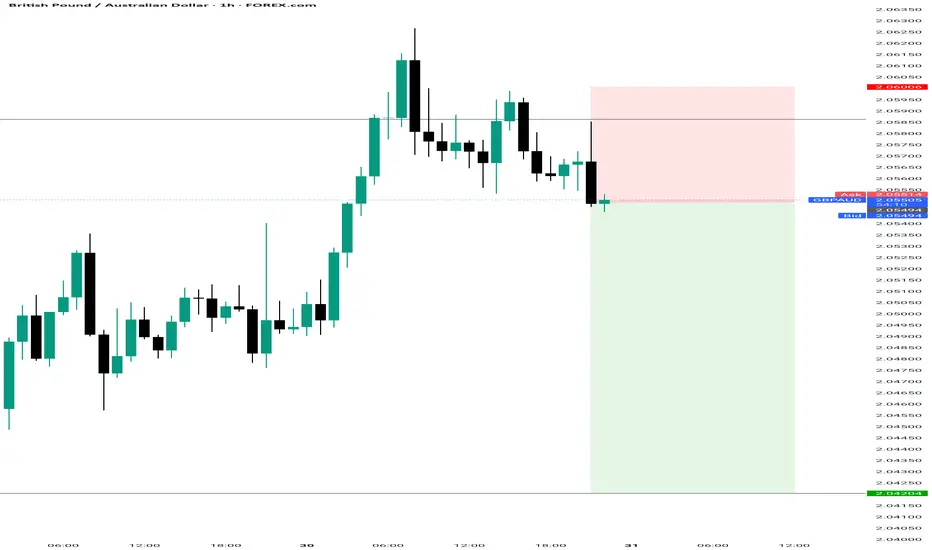
GBPAUD BUY OPPORTUNITY!📊 Current Market Behavior:
Price is retracing back toward the OB and FVG zone after a bullish move.
A small pullback is expected (as shown by the downward leg of the arrow) to mitigate the OB/FVG.
After mitigation, a strong bullish continuation is anticipated.
⚠️ Watch For:
Bullish confirmation inside OB (e.g., bullish engulfing, strong rejection wicks)
Reaction volume and candle strength during the London or NY session
Failure to hold OB may lead to price revisiting 2.04206

GBP-AUD Will Grow! Buy!
Hello,Traders!
GBP-AUD is trading in an
Uptrend and the pair is
Consolidating above the
Horizontal support of 2.059
So we are bullish biased
And we will be expecting a
Further bullish move up
Buy!
Comment and subscribe to help us grow!
Check out other forecasts below too!
Disclosure: I am part of Trade Nation's Influencer program and receive a monthly fee for using their TradingView charts in my analysis.

GBPAUD Potential buy loadingGBPAUD Potential buy loading!
On the 2h time frame we can clearly see a sweep in liquidity down and change of character up.
Price will reverse at the fvg gap at 2.05133 found inside 62 fib retracement


GBPAUDA wycoff pattern is formed up at the end of a spike's correction. I think some signs of strengths are showing up here for a buy position with tp 2

GBPAUD is Holding above the Support , All Eyes on BuyingHello Traders
In This Chart GBPAUD HOURLY Forex Forecast By FOREX PLANET
today GBPAUD analysis 👆
🟢This Chart includes_ (GBPAUD market update)
🟢What is The Next Opportunity on GBPJPY Market
🟢how to Enter to the Valid Entry With Assurance Profit
This CHART is For Trader's that Want to Improve Their Technical Analysis Skills and Their Trading By Understanding How To Analyze The Market Using Multiple Timeframes and Understanding The Bigger Picture on the Charts
