GBPAUD - Short Setup at Key Resistance LevelOANDA:GBPAUD is approaching a major resistance zone, an area where sellers have consistently stepped in, leading to notable reversals in the past. This level is marked by strong selling interest and historical price reactions, increasing the likelihood of a bearish move if sellers regain control.
The current price action suggests that if the pair confirms resistance through bearish engulfing candles, long upper wicks, or increased selling volume, we could see a downward move toward the 1.99200 level. However, if the price breaks above this zone, the bearish outlook could be invalidated, opening the door for further upside.
Just my take on support and resistance zones—not financial advice. Always confirm your setups and trade with solid risk management.
Best of luck!
GBPAUD trade ideas

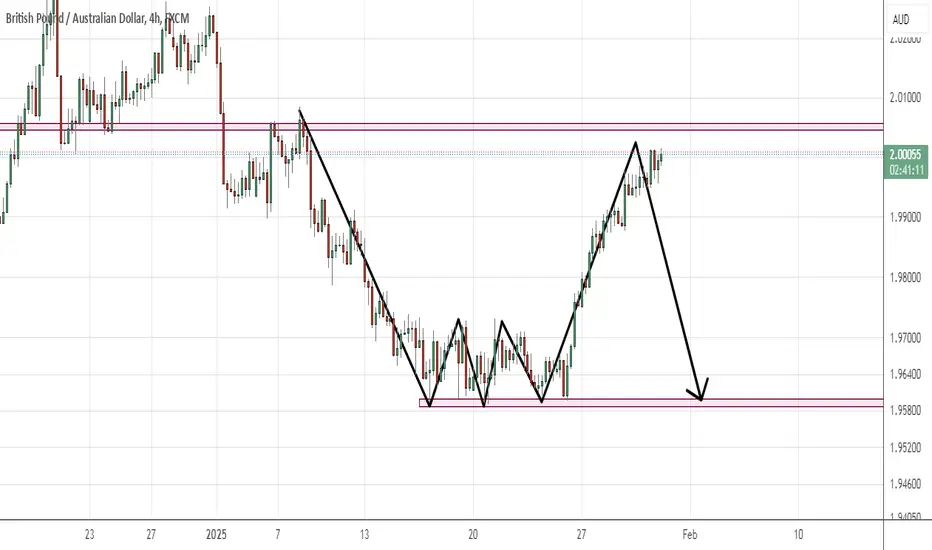
GBP/AUD Descending Triangle: Moving Up for the Fifth TimeGBP/AUD pair has formed a descending triangle pattern. In this pattern, the price is bouncing between a consistent 1.9610 support level and a declining resistance line. The support 1.9610 remains same, while the resistance is getting lower, showing that sellers are getting stronger.
Currently, the price is moving within this triangle, testing the support multiple times while facing resistance at the lower highs. The price recently broke out from a smaller downward movement within this pattern and is approaching the triangle resistance for the fifth time.

GBPaud sell signal. Don't forget about stop-loss.
Write in the comments all your questions and instruments analysis of which you want to see.
Friends, push the like button, write a comment, and share with your mates - that would be the best THANK YOU.
P.S. I personally will open entry if the price will show it according to my strategy.
Always make your analysis before a trade

GBPAUD BUY SETUPInstitutional Trade Plan
📌 Entry Strategy:
Ideal Buy Zone: 1.9900 – 1.9870 (discount zone).
Alternative Entry: If price reacts at 1.9930 FVG, a smaller position can be considered.
📌 Stop Loss (SL):
Safe SL: Below 1.9850 (institutional liquidity protection).
📌 Take Profit (TP) Targets:
TP1: 2.0000 (psychological level).
TP2: 2.0050 (liquidity above highs).
TP3: 2.0100+ (full bullish extension).
📌 Confidence Level: HIGH
Reasons:
Clear BOS on H4 and H1.
Clean liquidity grab below key levels.
Institutional demand zone aligns with premium vs. discount model.
📌 Trade Type: Intraday / Swing
If price reacts from 1.9900, it could be an intraday buy.
If price goes deeper into 1.9870, it may be a swing buy.
Final Institutional Decision
🚀 Conclusion: WAIT for price to retrace before entering a buy.
No need to chase price at highs.
Watch 1.9900–1.9870 for Smart Money reaction.
If price reaches 2.0000–2.0050, watch for potential reversal.
🔥 Final Play: Buy at Discount Zone → Target Buy-Side Liquidity Above 2.0000.

GBPAUD Possible BuyGBPAUD is bullish trading inside the channel , a Buy is in place once price pullback down to the lower channel trendline.
Good LUck


GBPAUD Set To Fall! SELL!
My dear friends,
Please, find my technical outlook for GBPAUD below:
The price is coiling around a solid key level - 1.9973
Bias - Bearish
Technical Indicators: Pivot Points Low anticipates a potential price reversal.
Super trend shows a clear sell, giving a perfect indicators' convergence.
Goal - 1.9888
Safe Stop Loss - 2.0024
About Used Indicators:
The pivot point itself is simply the average of the high, low and closing prices from the previous trading day.
———————————
WISH YOU ALL LUCK

T/R zonesThis idea is based on transient/recurrent zones
Very high probability (90%+) for the price to hit TP.
Probability was calculated on TF 1min.

GBPAUD INTRADAY flag pattern capped by resistance at 2.010The GBPAUD currency pair price action sentiment appears bearish, supported by the longer-term prevailing downtrend.
The key trading level is at 2.010, which is the current swing high from Monday 03rd February’25. A bearish rejection from the 2.010 level could target the downside support at 1.975 followed by 1.960 and 1.946 levels over the longer timeframe.
Alternatively, a confirmed breakout above 2.010 resistance and a daily close above that level would negate the bearish outlook opening the way for further rallies higher and a retest of 2.020 resistance followed by 2.030 levels.
This communication is for informational purposes only and should not be viewed as any form of recommendation as to a particular course of action or as investment advice. It is not intended as an offer or solicitation for the purchase or sale of any financial instrument or as an official confirmation of any transaction. Opinions, estimates and assumptions expressed herein are made as of the date of this communication and are subject to change without notice. This communication has been prepared based upon information, including market prices, data and other information, believed to be reliable; however, Trade Nation does not warrant its completeness or accuracy. All market prices and market data contained in or attached to this communication are indicative and subject to change without notice.

GBPAUD BUY IDEAThis pair is still bullish and i expect price to come into this demand area after taking out liquidity for it to continue it move upward. i will only be buying on confirmation inside the demand area. rejection candle or bullish engulfing candle confirmation and targeting the recent high.

GBP/AUD Short IdeaHi all
Shorting on GBP/AUD..
Reasons being all buy side Liquidity has been swept.
Looking to sell into the strong support zone. Lots of sell side Liquidity to collect.
SL im keeping just above previous high as I dont want to see price go above that previous resistance at all
TP im aiming for PHYC level
Good luck to anyone that follows

gbpaud sell signal. Don't forget about stop-loss.
Write in the comments all your questions and instruments analysis of which you want to see.
Friends, push the like button, write a comment, and share with your mates - that would be the best THANK YOU.
P.S. I personally will open entry if the price will show it according to my strategy.
Always make your analysis before a trade

GBPAUD - 23/02/25GBPAUD - 23/02/25 Ideas for the coming week. Will update the comments if any trades come in to play.

GBPAUD Bullish Breakout!
HI,Traders !
GBP-AUD was trading in a
Narrowing wedge pattern
But now we are seeing a
Bullish breakout so we
Will be expecting a
Further bullish move up !
Comment and subscribe to help us grow !

GBPAUD consolidation, The Week Ahead 24 Feb ‘25The GBPAUD currency pair price action sentiment appears bearish, supported by the longer-term prevailing downtrend.
The key trading level is at 2.010, which is the current swing high from Monday 03rd February’25. A bearish rejection from the 2.010 level could target the downside support at 1.975 followed by 1.960 and 1.946 levels over the longer timeframe.
Alternatively, a confirmed breakout above 2.010 resistance and a daily close above that level would negate the bearish outlook opening the way for further rallies higher and a retest of 2.020 resistance followed by 2.030 levels.
This communication is for informational purposes only and should not be viewed as any form of recommendation as to a particular course of action or as investment advice. It is not intended as an offer or solicitation for the purchase or sale of any financial instrument or as an official confirmation of any transaction. Opinions, estimates and assumptions expressed herein are made as of the date of this communication and are subject to change without notice. This communication has been prepared based upon information, including market prices, data and other information, believed to be reliable; however, Trade Nation does not warrant its completeness or accuracy. All market prices and market data contained in or attached to this communication are indicative and subject to change without notice.

GBPAUD LongGBPAUD has been having a lot of price action in between the HTF Swing High and Swing Low. After HTF (Higher Time Frame) and Internal Demand Zone Mitigation, GBPAUD should be heading towards the next Buyside Internal Liquidity and the Swing High. This is just an analysis and forecast. Trade it at your own risk.

GBPAUD: Bearish Forecast & Outlook
The recent price action on the GBPAUD pair was keeping me on the fence, however, my bias is slowly but surely changing into the bullish one and I think we will see the price go up.
❤️ Please, support our work with like & comment! ❤️

gbpaud is bearishthe pair nicely made a price action pattern at the end of bearish move and then bounce back .according to pattern we should notice price going back to its previous level
please see what wuold happen
GBPAUD Technical Analysis! SELL!
My dear friends,
Please, find my technical outlook for GBPAUD below:
The instrument tests an important psychological level 1.9805
Bias - Bearish
Technical Indicators: Supper Trend gives a precise Bearish signal, while Pivot Point HL predicts price changes and potential reversals in the market.
Target - 1.9787
About Used Indicators:
Super-trend indicator is more useful in trending markets where there are clear uptrends and downtrends in price.
———————————
WISH YOU ALL LUCK

GBP/AUD SELLERS WILL DOMINATE THE MARKET|SHORT
Hello, Friends!
We are targeting the 1.974 level area with our short trade on GBP/AUD which is based on the fact that the pair is overbought on the BB band scale and is also approaching a resistance line above thus going us a good entry option.
✅LIKE AND COMMENT MY IDEAS✅

GBP/AUD - 1H Analysis & Trade Plan📊 GBP/AUD - 1H Analysis & Trade Plan
🔹 Market Structure:
✅ Break of Structure (BOS) confirms trend continuation.
✅ Change of Character (ChoCH) signals potential reversals.
✅ Fair Value Gaps (FVG) highlight imbalance zones.
🔹 Key Levels:
✅ Resistance Zones:
• 1.98820 - 1.98891 (Major resistance)
• 1.98623 - 1.98553 (Lower resistance zone)
• 1.98375 - 1.98397 (Current reaction zone)
✅ Fibonacci Retracement Levels:
• 0.382 (1.9819), 0.5 (1.9812), 0.618 (1.9806), 0.705 (1.9800), 0.786 (1.9796)
📌 Trade Idea:
🔹 Bearish bias remains valid if price rejects from 1.98375 - 1.98397 zone.
🔹 A break above 1.98547 may lead to further bullish momentum.
🔹 Potential downside targets: 1.97803 - 1.97700 region.
#FXFOREVER #GBPAUD #ForexAnalysis #SmartMoney #LiquidityHunt #BOS #FVG #PriceAction

GBPAUD 20/02/2025Weekly:
-Weekly highs.
-H&S pattern.
Daily:
-H&S pattern.
-Bearish W pattern.
-IC.
4H:
-Bearish W pattern.

GBPAUD sideways consolidation The GBPAUD currency pair price action sentiment appears bearish, supported by the longer-term prevailing downtrend.
The key trading level is at 2.010, which is the current swing high from Monday 03rd February’25. A bearish rejection from the 2.010 level could target the downside support at 1.975 followed by 1.960 and 1.946 levels over the longer timeframe.
Alternatively, a confirmed breakout above 2.010 resistance and a daily close above that level would negate the bearish outlook opening the way for further rallies higher and a retest of 2.020 resistance followed by 2.030 levels.
This communication is for informational purposes only and should not be viewed as any form of recommendation as to a particular course of action or as investment advice. It is not intended as an offer or solicitation for the purchase or sale of any financial instrument or as an official confirmation of any transaction. Opinions, estimates and assumptions expressed herein are made as of the date of this communication and are subject to change without notice. This communication has been prepared based upon information, including market prices, data and other information, believed to be reliable; however, Trade Nation does not warrant its completeness or accuracy. All market prices and market data contained in or attached to this communication are indicative and subject to change without notice.
