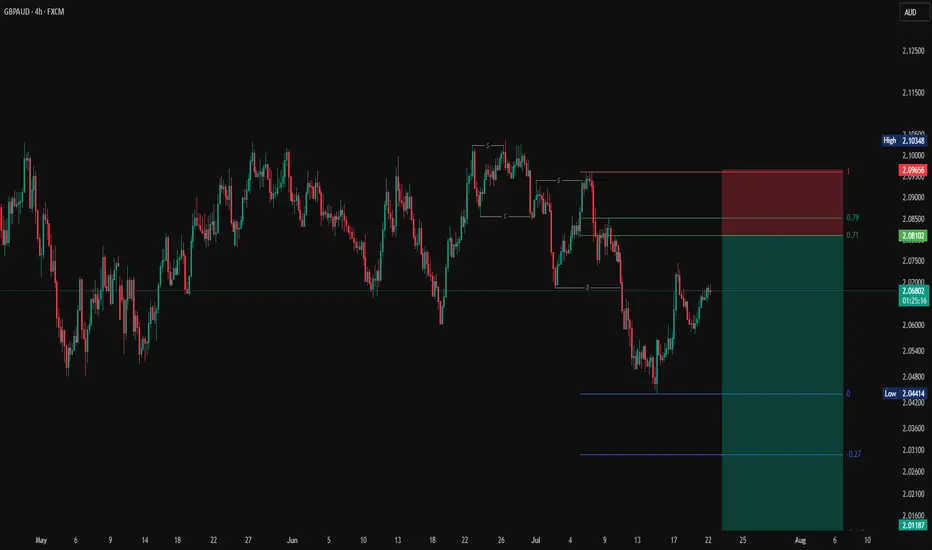
GBPAUD breakdown targets 2.00GBPAUD broke below key triangle support, confirming a bearish pattern with a target near 2.00. A failed retest strengthens the case for further downside. Bounces toward 2.06 may face selling pressure. Reward-to-risk remains attractive around 2.55x.
This content is not directed to residents of the EU or UK. Any opinions, news, research, analyses, prices or other information contained on this website is provided as general market commentary and does not constitute investment advice. ThinkMarkets will not accept liability for any loss or damage including, without limitation, to any loss of profit which may arise directly or indirectly from use of or reliance on such information.
GBPAUD trade ideas

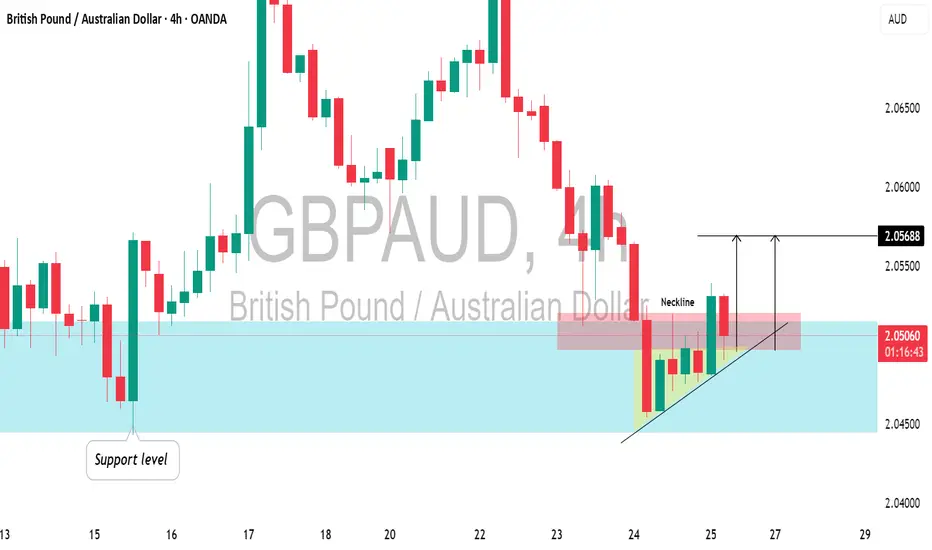
GBPAUD: Another Pullback Trade for TodayGBPAUD formed an ascending triangle pattern at a significant daily/intraday horizontal support.
And breaking its neckline indicates buyer strength.
I anticipate the pair could rise to the 2.0568 level.
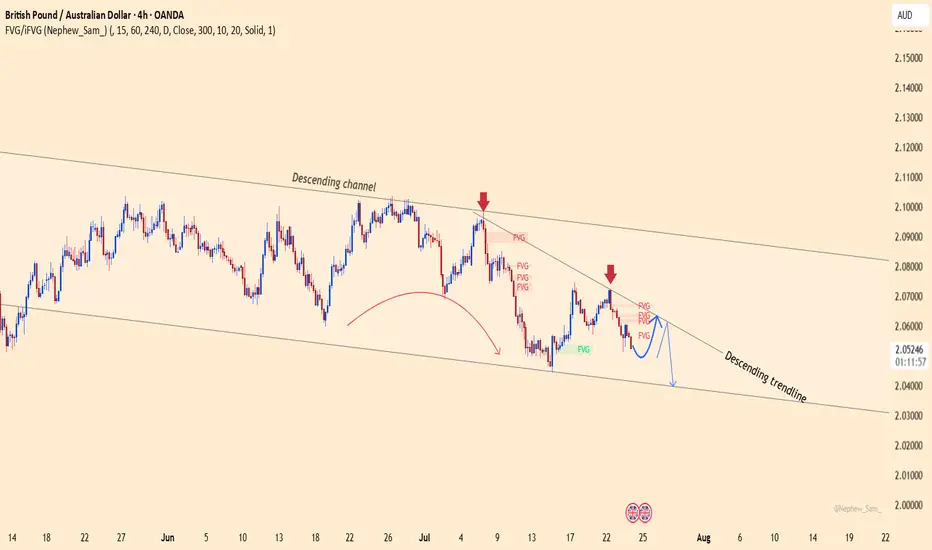
GBPAUD – False breakout or the next sharp drop?The GBPAUD pair continues to trade within a well-defined descending channel, with every bullish attempt being firmly rejected by the descending trendline. Recent candlesticks show a clear sell signal right at the FVG resistance zone.
Market-moving news:
Australia’s manufacturing PMI surprised to the upside → strong support for AUD
GBP remains under pressure after dovish comments from the BoE, diminishing hopes of further rate hikes.
If the price fails to break above the 2.0640 zone — creating yet another fake top — a sharp drop toward 2.0400 is highly likely.
Strategy: Look to SELL near the trendline and FVG zone, targeting 2.0400.

GBPAUD Sellers In Panic! BUY!
My dear followers,
This is my opinion on the GBPAUD next move:
The asset is approaching an important pivot point 2.0491
Bias - Bullish
Technical Indicators: Supper Trend generates a clear long signal while Pivot Point HL is currently determining the overall Bullish trend of the market.
Goal - 2.0573
About Used Indicators:
For more efficient signals, super-trend is used in combination with other indicators like Pivot Points.
Disclosure: I am part of Trade Nation's Influencer program and receive a monthly fee for using their TradingView charts in my analysis.
———————————
WISH YOU ALL LUCK

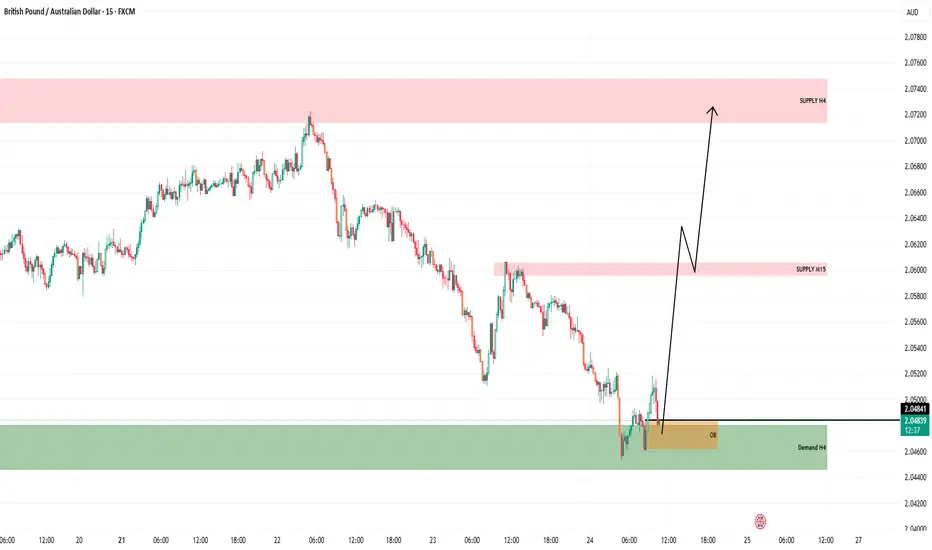
GBPAUD BUY OPPORTUNITY📈 Expected Price Action:
Initial Reaction from Demand H4 & OB:
Bullish rejection confirms buyers stepping in.
Short-Term Target - Supply M15 (Red Zone):
Around 2.0600 – Expect price to react or consolidate here temporarily.
Final Target - Supply H4 Zone:
Around 2.0720–2.0740, where higher-timeframe sellers may step in.
✅ Summary of Bias:
Directional Bias: Bullish
Entry Area: Between OB and Demand H4 zone (2.0450–2.0480)
First Target: 2.0600 (M15 supply)
Final Target: 2.0720+ (H4 supply)
🧠 Notes:
Ensure you monitor price action around the M15 supply for partial profits or re-entry.
A break below the OB and H4 Demand would invalidate the setup.
LONG ON GBP/AUDGA has given us a CHOC (change of character) to the upside after making a new low.
Price has since pulled back to the demand area that created that change leaving us with a possible double bottom forming.
I expect GA to rise to sweep buy side liquidity at the equal highs then reaching the previous supply level / previous High.
Looking to catch 200-300 pips.

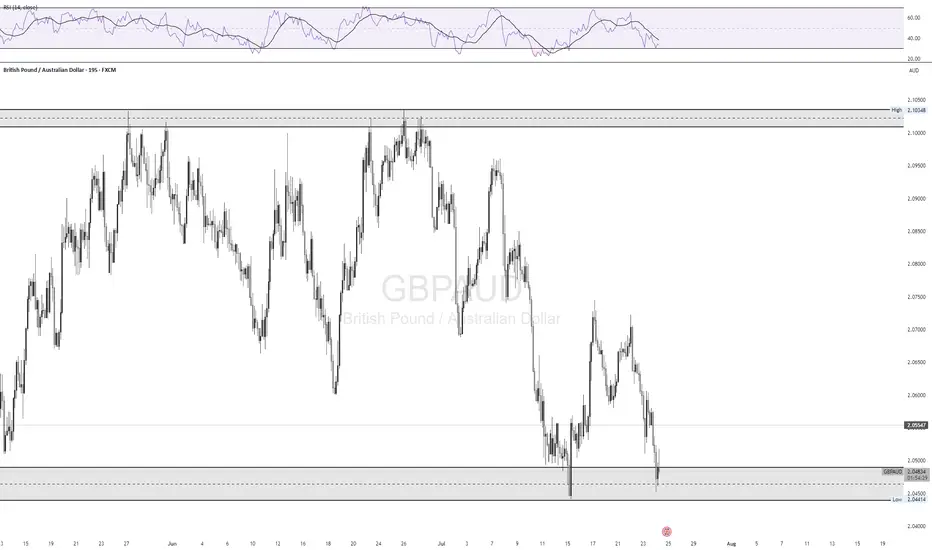
GBPAUD oversold rallies capped at 2.0555The GBPAUD pair is currently trading with a bearish bias, aligned with the broader downward trend. Recent price action shows a retest of the resistance, suggesting a temporary relief rally within the downtrend.
Key resistance is located at 2.0555, a prior consolidation zone. This level will be critical in determining the next directional move.
A bearish rejection from 2.0555 could confirm the resumption of the downtrend, targeting the next support levels at 2.0400, followed by 2.0350 and 2.0290 over a longer timeframe.
Conversely, a decisive breakout and daily close above 2.0555 would invalidate the current bearish setup, shifting sentiment to bullish and potentially triggering a move towards 2.0600, then 2.0645.
Conclusion:
The short-term outlook remains bearish unless the pair breaks and holds above 2.0555. Traders should watch for price action signals around this key level to confirm direction. A rejection favours fresh downside continuation, while a breakout signals a potential trend reversal or deeper correction.
This communication is for informational purposes only and should not be viewed as any form of recommendation as to a particular course of action or as investment advice. It is not intended as an offer or solicitation for the purchase or sale of any financial instrument or as an official confirmation of any transaction. Opinions, estimates and assumptions expressed herein are made as of the date of this communication and are subject to change without notice. This communication has been prepared based upon information, including market prices, data and other information, believed to be reliable; however, Trade Nation does not warrant its completeness or accuracy. All market prices and market data contained in or attached to this communication are indicative and subject to change without notice.

GBPAUD BUY SIGNAL. Don't forget about stop-loss.
Write in the comments all your questions and instruments analysis of which you want to see.
Friends, push the like button, write a comment, and share with your mates - that would be the best THANK YOU.
P.S. I personally will open entry if the price will show it according to my strategy.
Always make your analysis before a trade
GBPAUD 1H LongBearish Trend
Price is testing 1D TF trendline.
Bullish Divergence
Double bottom Pattern
RR 1:1
Price can fall if its break its last LL (Critical Point)

Buy GBPAUDExpecting gains from GBPAUD towards the area of breakage of the bearish flag pattern, from there we will react accordingly. For now we buy

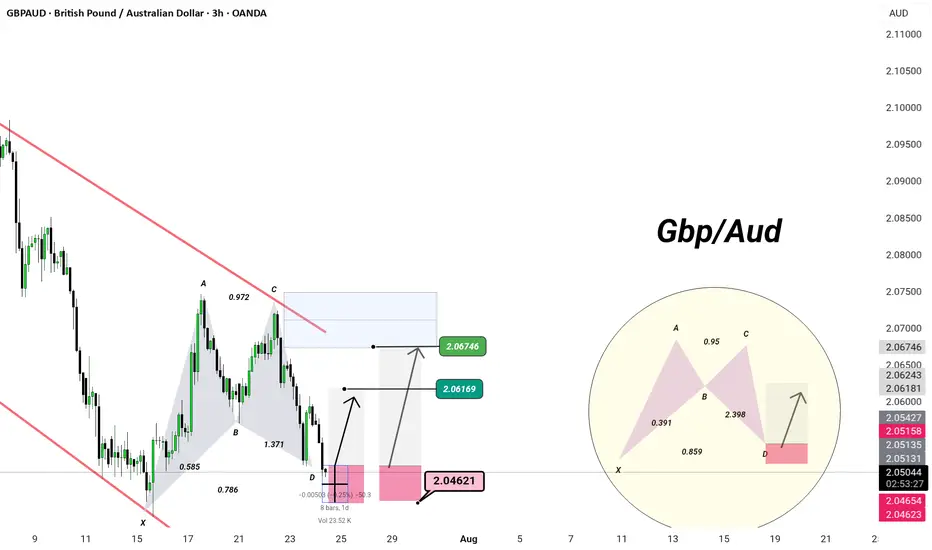
IGBPAUD | 3H Chart | Precision Setup –
🦋 Bullish Harmonic Activation – Deep Zone Precision
When elegance meets geometry — we trade like a Monaco man.
🔺 Pattern: Potential Bullish Bat/Alt Bat
XA → AB → BC → CD
Ideal D-point completion at 2.0462
88.6% XA retracement + 2.0+ BC extension = high-probability reaction zone
🛡️ Demand Zone:
Price is testing the PRZ (Potential Reversal Zone) at 2.0462
Reaction expected → projected targets:
🎯 TP1: 2.0616
🎯 TP2: 2.0674
⚙️ Entry Plan:
Long from 2.0462–2.0465
Invalidation below structure low
Maintain composure. Let the setup mature — precision > prediction
💡 Bias: Tactical long within channel, targeting liquidity above C
🎩
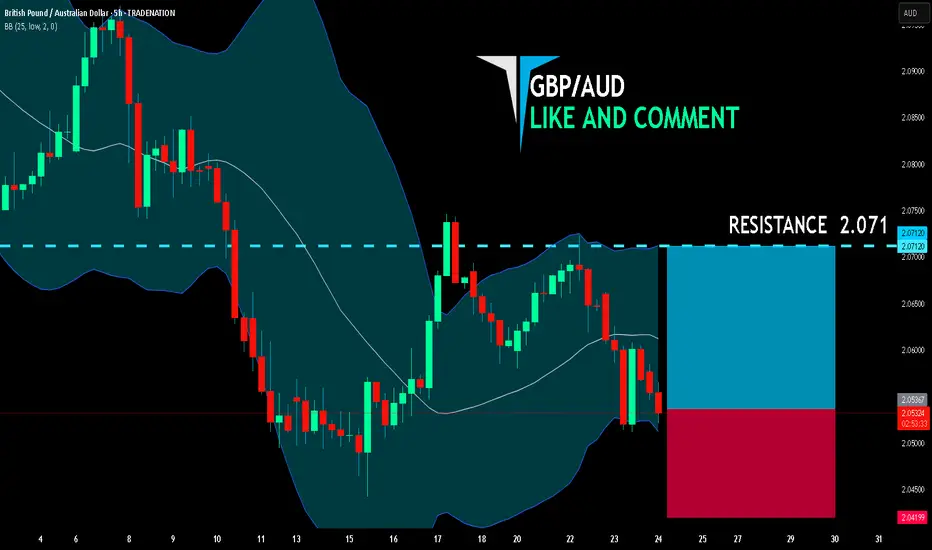
GBP/AUD LONG FROM SUPPORT
GBP/AUD SIGNAL
Trade Direction: long
Entry Level: 2.053
Target Level: 2.071
Stop Loss: 2.041
RISK PROFILE
Risk level: medium
Suggested risk: 1%
Timeframe: 5h
Disclosure: I am part of Trade Nation's Influencer program and receive a monthly fee for using their TradingView charts in my analysis.
✅LIKE AND COMMENT MY IDEAS✅
GBPAUD--SELL--break of ascending long time trendline
--retest and bounce from this trendline
--entry: around 2.0619 TP:2.0452

GBPAUD🔍 Pair: GBPAUD
🕒 Timeframe: 15 Min
🔄 Strategy: Break of Structure (BoS) + Retest
🔹 Price has broken structure, showing bullish intent.
🔹 We’ve now entered the “Area of Interest” for a potential long entry.
🔹 Stop Loss is placed just below the last swing low, managing risk efficiently.
🔹 Waiting for bullish confirmation (strong candle or engulfing) inside the zone before entry.
📌 RSI is recovering, showing early momentum shift.
🎯 Targeting next supply zone above — watch for continuation.
🧠 Discipline is key — wait for the setup to complete. No confirmation = No trade.

GBPAUD - Trading The Range - AGAIN!Hello TradingView Family / Fellow Traders. This is Richard, also known as theSignalyst.
📈GBPAUD has been hovering within a big range.
Last week, as per our previous analysis, GBPAUD rejected the upper bound of the range and traded lower.
This week, GA is retesting the lower bound of the range acting as a support.
As long as the support holds, we will be looking for longs on lower timeframes, targeting the upper bound of the range.
📚 Always follow your trading plan regarding entry, risk management, and trade management.
Good luck!
All Strategies Are Good; If Managed Properly!
~Rich
Disclosure: I am part of Trade Nation's Influencer program and receive a monthly fee for using their TradingView charts in my analysis.

WOULD YOU TAKE THIS TRADE? GBPAUD SELLAll the information you need to find a high probability trade are in front of you on the charts so build your trading decisions on 'the facts' of the chart NOT what you think or what you want to happen or even what you heard will happen. If you have enough facts telling you to trade in a certain direction and therefore enough confluence to take a trade, then this is how you will gain consistency in you trading and build confidence. Check out my trade idea!!
www.tradingview.com

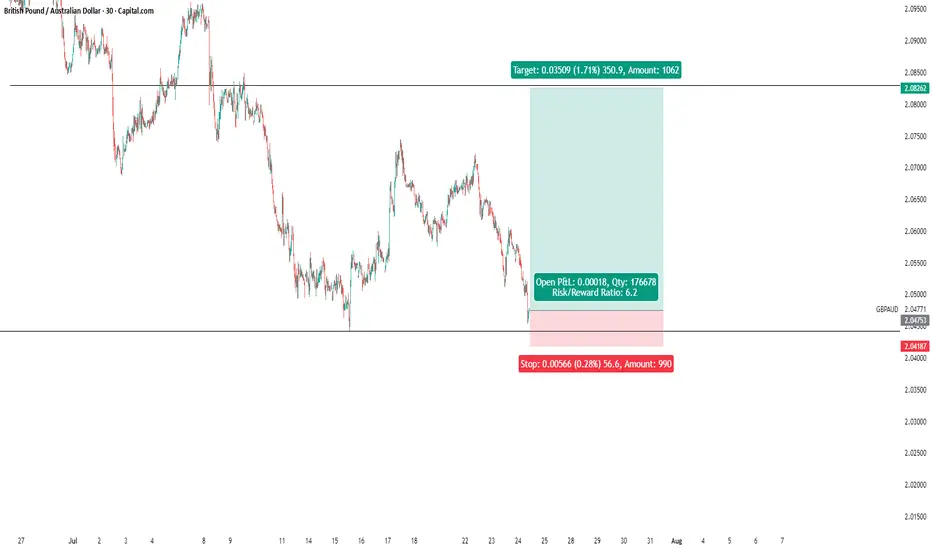
GBPAUD: Liquidity Grab and Fair Value Gap RejectionPrice recently swept liquidity above a key level, grabbing stops resting above that range. Following that, it quickly reversed and left behind a clean Fair Value Gap , suggesting a possible shift in intent.
We are now watching price retrace into the FVG zone. If price reacts from there with a strong bearish confirmation candle like a bearish engulfing or another sign of rejection, we could see a continuation move lower. Our short-term target would be the previous day’s low.
This setup reflects how important it is to wait for confirmation and not chase the first reaction. Let price come to you and show its hand. Patience leads to clarity and better entries.
A trade without confirmation is just a guess. A trade with structure, confluence, and patience is a plan. Stay sharp.

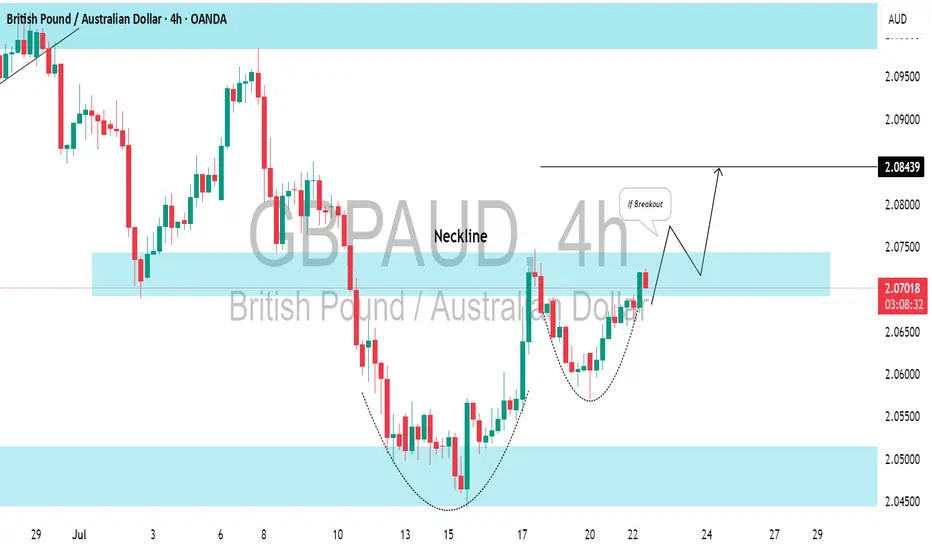
GBPAUD: Another Bullish Pattern⚠️GBPAUD has adhered to a horizontal support level on the intraday chart and has bounced back from it, revealing a strong bullish pattern.
The price has formed a cup and handle pattern and is currently testing its neckline.
Look for a breakout confirmation; a 4-hour candle closing above the 2.0750 level will validate this breakout, leading to an anticipated bullish continuation.
bearish continuationBullish movement is exhausted, price has changed character and started breaking structure to the downside , we anticipate price to retest the premium price as perimeters has been placed
GBPAUD - Bullish TrendGBPAUD is making Bullish Trend after RSI Divergence, will this trend continue?
Entry, Stop Loss & Take Profit are mentioned.

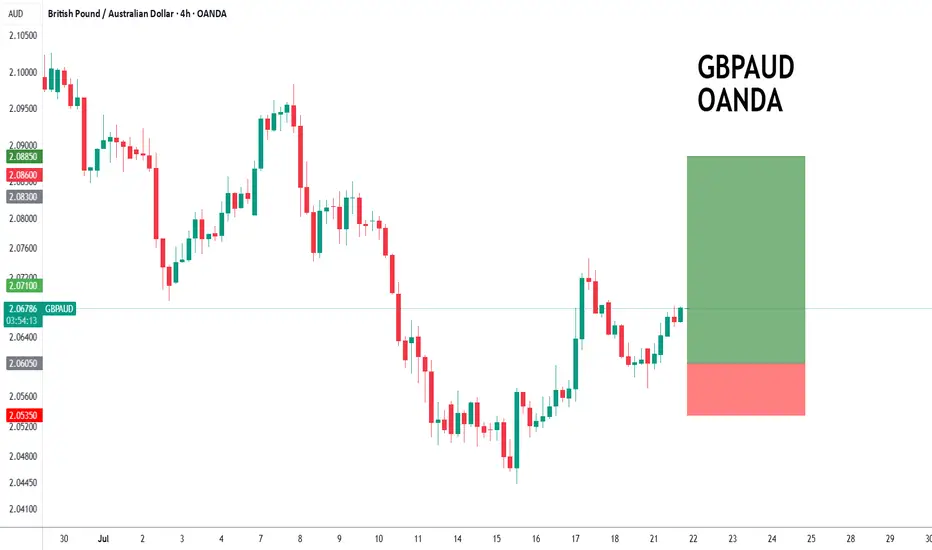
GBPAUD to find buyers at current support?GBPAUD - 24h expiry
The primary trend remains bullish.
Price action looks to be forming a bottom.
We look for a temporary move lower.
Preferred trade is to buy on dips.
Bespoke support is located at 2.0605.
We look to Buy at 2.0605 (stop at 2.0535)
Our profit targets will be 2.0885 and 2.0950
Resistance: 2.0750 / 2.0800 / 2.0970
Support: 2.0600 / 2.0520 / 2.0450
Risk Disclaimer
The trade ideas beyond this page are for informational purposes only and do not constitute investment advice or a solicitation to trade. This information is provided by Signal Centre, a third-party unaffiliated with OANDA, and is intended for general circulation only. OANDA does not guarantee the accuracy of this information and assumes no responsibilities for the information provided by the third party. The information does not take into account the specific investment objectives, financial situation, or particular needs of any particular person. You should take into account your specific investment objectives, financial situation, and particular needs before making a commitment to trade, including seeking advice from an independent financial adviser regarding the suitability of the investment, under a separate engagement, as you deem fit.
You accept that you assume all risks in independently viewing the contents and selecting a chosen strategy.
Where the research is distributed in Singapore to a person who is not an Accredited Investor, Expert Investor or an Institutional Investor, Oanda Asia Pacific Pte Ltd (“OAP“) accepts legal responsibility for the contents of the report to such persons only to the extent required by law. Singapore customers should contact OAP at 6579 8289 for matters arising from, or in connection with, the information/research distributed.