GBPAUD: Bullish Movement Continues 🇬🇧🇦🇺
GBPAUD is going to rise more, following a confirmed intraday bullish reversal:
first, the price violated a resistance line of a falling channel.
It started to consolidate within an inverted head & shoulders pattern then.
Its neckline violation is another strong bullish signal.
Next resistance - 2.0685
❤️Please, support my work with like, thank you!❤️
I am part of Trade Nation's Influencer program and receive a monthly fee for using their TradingView charts in my analysis.
GBPAUD trade ideas

GBPAUD's wide trading range remains intact✏️GBPAUD is trading in a wide range. After the increase on Friday, the pair is retesting the support zone breaking past resistance. And the current reaction point also coincides with the 20 SMA. There is not much momentum for the pair to break out of the wide trading range, so buying the pair to the upper range of 2.097 is a reasonable choice at the moment.
📉 Key Levels
Support: 2.058
Resistance: 2.083-2.096
BUY Trigger: Confirmed bounce from 2.059 (EMA support)
Target 2.09600
BUY DCA Trigger: Break 2.083
Leave your comments on the idea. I am happy to read your views.

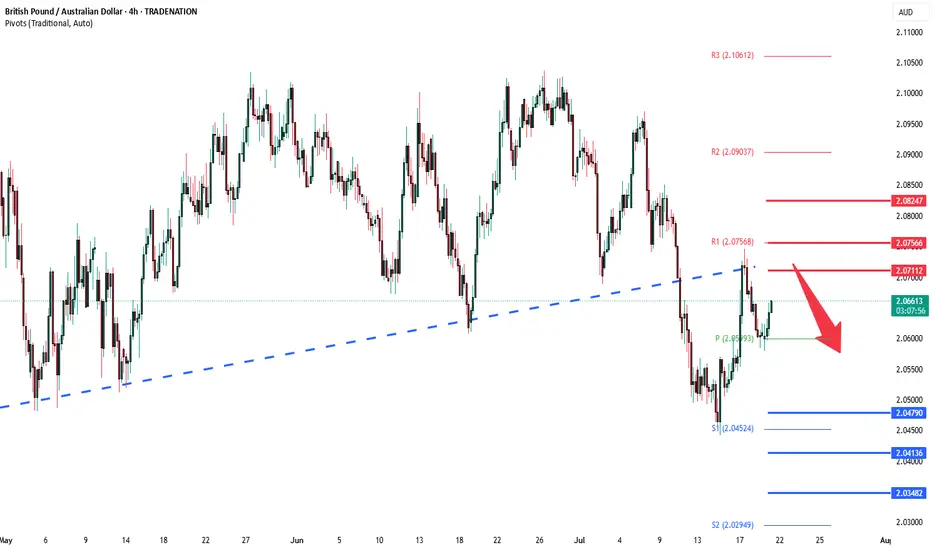
GBPAUD oversold bounceback capped at 2.0710The GBPAUD pair is currently trading with a bearish bias, aligned with the broader downward trend. Recent price action shows a retest of the previous support zone, suggesting a temporary relief rally within the downtrend.
Key resistance is located at 2.0660, a prior consolidation zone. This level will be critical in determining the next directional move.
A bearish rejection from 2.0660 could confirm the resumption of the downtrend, targeting the next support levels at 2.0480, followed by 2.0410 and 2.0350 over a longer timeframe.
Conversely, a decisive breakout and daily close above 2.0660 would invalidate the current bearish setup, shifting sentiment to bullish and potentially triggering a move towards 2.0710, then 2.0750.
Conclusion:
The short-term outlook remains bearish unless the pair breaks and holds above 2.0660. Traders should watch for price action signals around this key level to confirm direction. A rejection favours fresh downside continuation, while a breakout signals a potential trend reversal or deeper correction.
This communication is for informational purposes only and should not be viewed as any form of recommendation as to a particular course of action or as investment advice. It is not intended as an offer or solicitation for the purchase or sale of any financial instrument or as an official confirmation of any transaction. Opinions, estimates and assumptions expressed herein are made as of the date of this communication and are subject to change without notice. This communication has been prepared based upon information, including market prices, data and other information, believed to be reliable; however, Trade Nation does not warrant its completeness or accuracy. All market prices and market data contained in or attached to this communication are indicative and subject to change without notice.

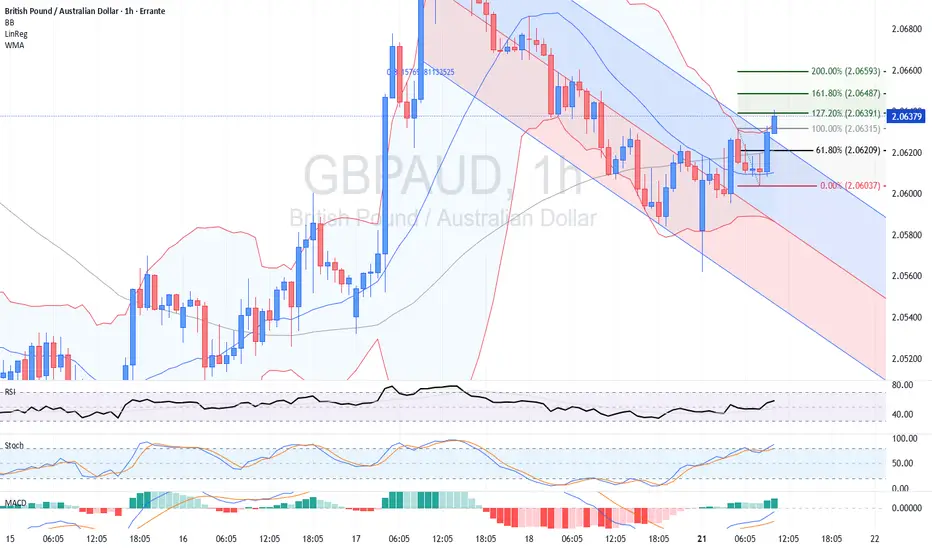
GBP/AUD Edges Higher Amid Risk-On Sentiment, Eyes Economic DataMarket Overview:
GBP/AUD has shown signs of recovery this Monday, bolstered by a modest improvement in risk appetite globally. The Australian dollar faces some pressure due to mixed domestic economic signals and external factors such as cautious investor sentiment on China’s growth prospects. Meanwhile, the British pound is supported by steady housing data, despite some softness seen in Rightmove’s monthly house price index.
Technical Analysis:
The pair is likely to extend its upward momentum towards the Fibonacci extension targets at 2.0639 (127.20%), 2.0650 (141.40%), and 2.0659 (161.80%). The RSI at 57 indicates mild bullish strength without being overbought, while the MACD histogram is positive and widening, suggesting strengthening bullish momentum. Stochastic oscillators are in the overbought territory but not yet showing signs of reversal.
Alternative Scenario:
If the pair fails to sustain above the trend channel resistance and key Fibonacci extensions, a retracement back to the support zone around 2.0604-2.0580 is possible.
21.07.25 Morning ForecastPairs on Watch -
FX:GBPAUD
FX:EURUSD
FX:AUDUSD
OANDA:XAUUSD
A short overview of the instruments I am looking at for today, multi-timeframe analysis down to what I will be looking at for an entry. Enjoy!

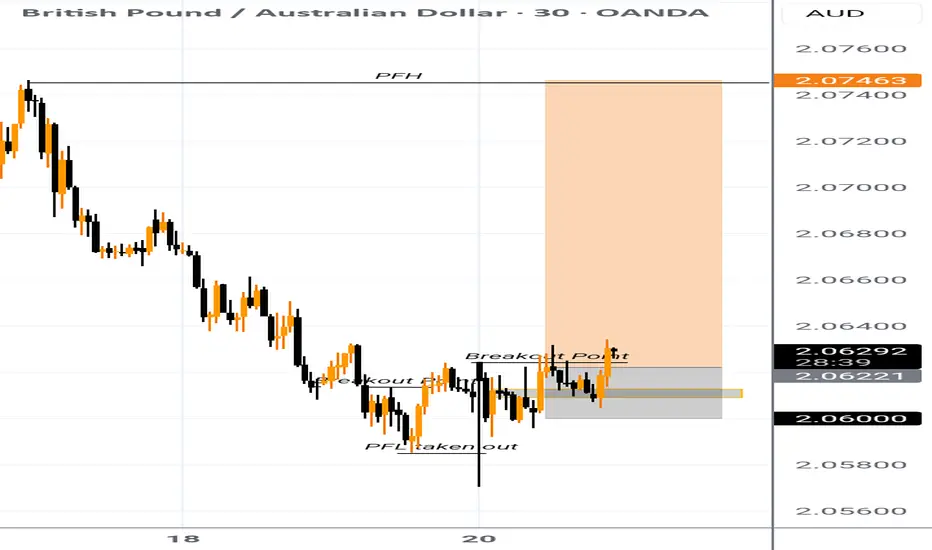
GBPAUD Buy swing setPrice has broken out new zone, we expect bullish continuation to the peak formation high as it aligns with the higher time frame bullish momentum
GBPAUDin an up trend I identify this range as a Wycoff pattern and think I should take a long from here.

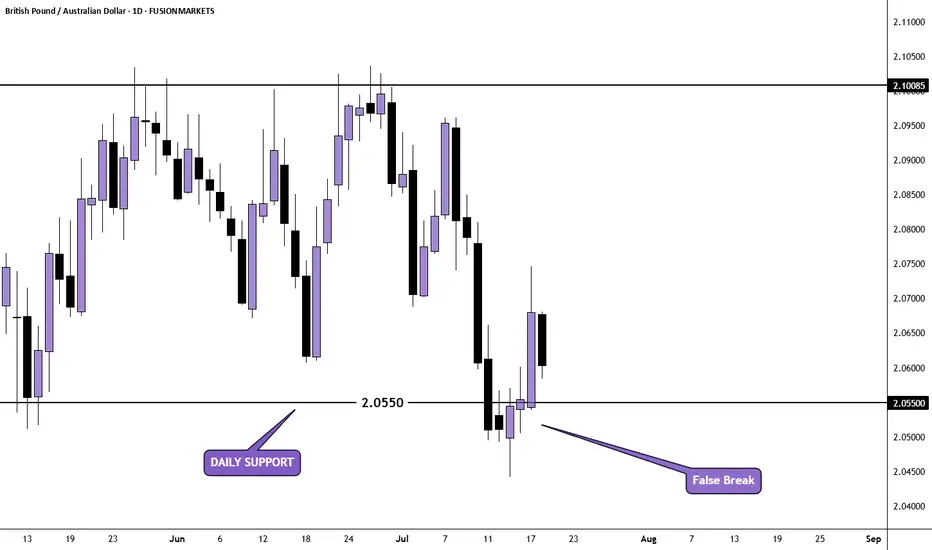
GBP/AUD Daily AnalysisPrice was ranging between resistance at 2.10085 and support at 2.05500
After breaking below support last week, price retested but then closed back above (false break). We may now see buyers step in again.
If you agree with this analysis, look for a trade that meets your strategy rules.
GBPAUD Bullish BiasPrice has entered the weekly demand zone and formed an inverse head and shoulders.
Price also shows bullish divergence on the RSI indicator.
Recent fundamental news of AUD showed increase in unemployment and father rate cuts are expected in the near future.

Short GBPAUD Trendline break outSell: $2.05825
Set up: Trend line break out to the downside
Sl: $2.08021
TP:2.02641

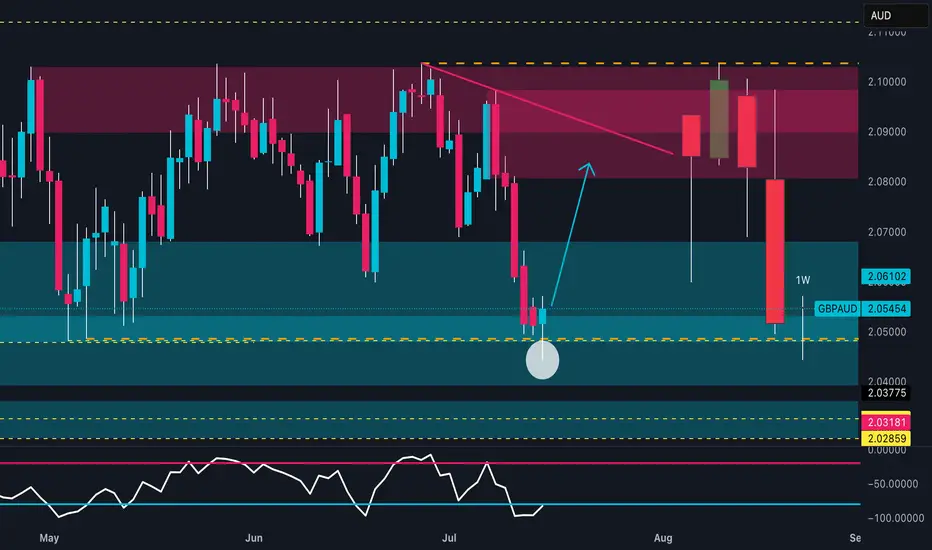
GBPAUD: Weekly Reversal | COT & Seasonality Support Bullish📊 Technical Outlook
Price strongly reacted from a key weekly demand zone between 2.0400 and 2.0500, showing clear absorption of bearish pressure. The RSI is rebounding from the 30 area, signaling early reversal potential.
The next technical target lies between 2.08900 and 2.10000, within a well-defined supply zone.
An early bullish reversal is in progress, with potential for a swing move toward the red zone.
🧠 Commitment of Traders (COT Report – 08/07/2025)
GBP: Non-commercial traders are net long, with positioning growing across the board: +869 longs / -926 shorts. Commercials reduce shorts and increase longs → Bullish bias.
AUD: Non-commercials are clearly short (-2,267 longs / +1,957 shorts). Commercials are increasing long exposure (+2,629), but still in the minority → Bearish bias.
➡️ The COT spread confirms a GBP long vs AUD short bias.
📅 Seasonality (July)
GBP: Historically strong in July, with average monthly gains across all timeframes (especially the 2Y window).
AUD: Less favorable seasonal profile in July; flat to slightly negative across all time horizons.
➡️ Seasonality supports GBP strength.
📉 Retail Sentiment
58% Long / 42% Short on GBPAUD
➡️ Retail traders are still heavily long → a shakeout of weak long hands is possible before the real rally begins.
🎯 Strategic Conclusion
GBP shows bullish convergence across technical, COT, and seasonal factors. AUD presents clear weakness.
The current price zone offers a clean entry point for longs, targeting the 2.08900–2.10000 supply zone.

GBPAUD Will Go Up From Support! Long!
Here is our detailed technical review for GBPAUD.
Time Frame: 4h
Current Trend: Bullish
Sentiment: Oversold (based on 7-period RSI)
Forecast: Bullish
The market is on a crucial zone of demand 2.060.
The oversold market condition in a combination with key structure gives us a relatively strong bullish signal with goal 2.071 level.
P.S
We determine oversold/overbought condition with RSI indicator.
When it drops below 30 - the market is considered to be oversold.
When it bounces above 70 - the market is considered to be overbought.
Disclosure: I am part of Trade Nation's Influencer program and receive a monthly fee for using their TradingView charts in my analysis.
Like and subscribe and comment my ideas if you enjoy them!

GBPAUD Bullish Set-upAfter price formed Accumulation Schematic 2, it entered mark-up phase. Now, correction is approaching the 1h demand level exactly aligning with OTE level.

GBPAUD a bullish momentum in 1hr TFsweep happen at 2.04438
consider the price is at the bottom area in the range of D (larger TF)
if the price at 2.05599 level (0.618) appear consolidation would be perfect
need a breakout of consolidation in small TF
long entry in smaller TF

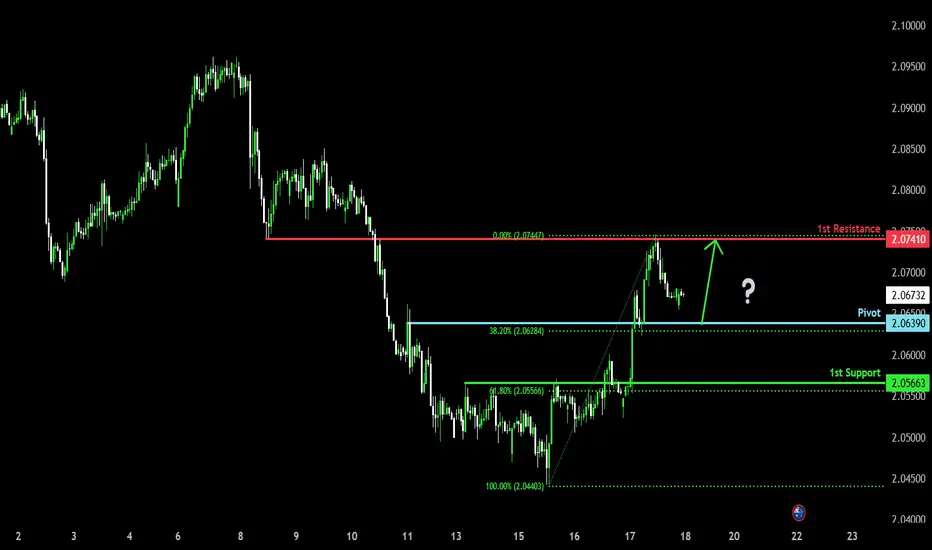
Bullish momentum to extend?GBP/AUD is falling towards the pivot that aligns with the 38.2% Fibonacci retracement and could bounce to the 1st resistance.
Pivot: 2.0639
1st Support: 2.0566
1st Resistance: 2.0741
Risk Warning:
Trading Forex and CFDs carries a high level of risk to your capital and you should only trade with money you can afford to lose. Trading Forex and CFDs may not be suitable for all investors, so please ensure that you fully understand the risks involved and seek independent advice if necessary.
Disclaimer:
The above opinions given constitute general market commentary, and do not constitute the opinion or advice of IC Markets or any form of personal or investment advice.
Any opinions, news, research, analyses, prices, other information, or links to third-party sites contained on this website are provided on an "as-is" basis, are intended only to be informative, is not an advice nor a recommendation, nor research, or a record of our trading prices, or an offer of, or solicitation for a transaction in any financial instrument and thus should not be treated as such. The information provided does not involve any specific investment objectives, financial situation and needs of any specific person who may receive it. Please be aware, that past performance is not a reliable indicator of future performance and/or results. Past Performance or Forward-looking scenarios based upon the reasonable beliefs of the third-party provider are not a guarantee of future performance. Actual results may differ materially from those anticipated in forward-looking or past performance statements. IC Markets makes no representation or warranty and assumes no liability as to the accuracy or completeness of the information provided, nor any loss arising from any investment based on a recommendation, forecast or any information supplied by any third-party.
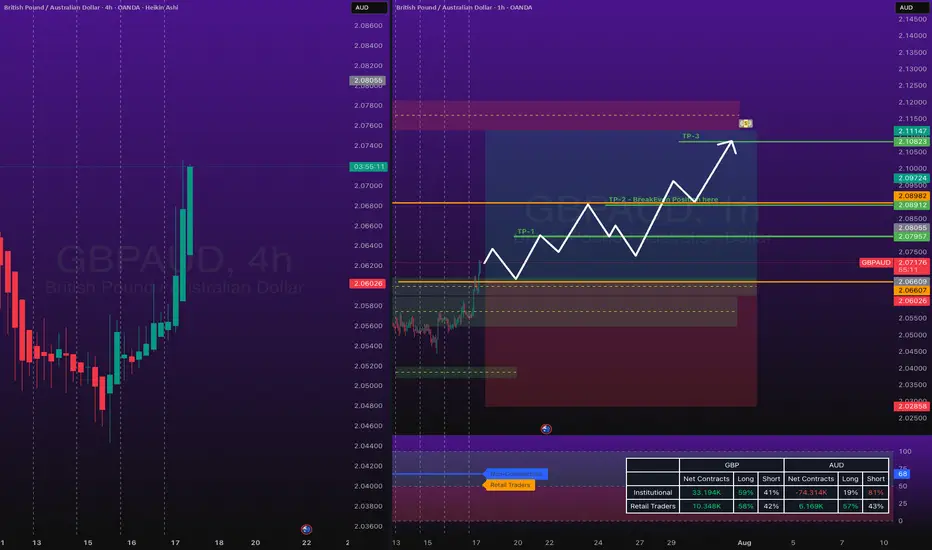
GBPAUD Long Trade OANDA:GBPAUD Long Trade, with my back testing of this strategy, it hits multiple possible take profits, manage your position accordingly.
Note: Manage your risk yourself, its risky trade, see how much your can risk yourself on this trade.
Use proper risk management
Looks like good trade.
Lets monitor.
Use proper risk management.
Disclaimer: only idea, not advice
GBPAUD Technical & Order Flow AnalysisOur analysis is based on a multi-timeframe top-down approach and fundamental analysis.
Based on our assessment, the price is expected to return to the monthly level.
DISCLAIMER: This analysis may change at any time without notice and is solely intended to assist traders in making independent investment decisions. Please note that this is a prediction, and I have no obligation to act on it, nor should you.
Please support our analysis with a boost or comment!

GBPAUD: Pullback From Resistance 🇬🇧🇦🇺
I think that GBPAUD may pull back from a key intraday resistance.
As a confirmation, I see a bearish engulfing candle after its test
on an hourly time frame.
Goal - 2.0655
❤️Please, support my work with like, thank you!❤️
I am part of Trade Nation's Influencer program and receive a monthly fee for using their TradingView charts in my analysis.

GBPAUD SHORT SELL 17-7-2025Trend : bearish
divergence : formed bearish at lower tf
continuation : n/a
reversal : n/a
harmonics : n/a
sentiments : 80 % short
bias : short

GBP/AUD Ready To Go Up After Melted , 2 Entries Valid !Here is my GBP/AUD 1H Chart and this is my opinion , the price moved very hard to downside without any correction and the price at strong support now 2.05000 which is forced the price many times to go up , so it`s my best place to enter a buy trade , and if you checked the chart you will see the price now creating a reversal pattern and i put my neckline and if we have a closure above it to confirm the pattern we can enter another entry to increase our contracts . if we have a daily closure below my support area then this idea will not be valid anymore .

GBPAUD Rebound Ahead!
HI,Traders !
#GBPAUD keeps falling but
A horizontal support level
Is ahead around 2.04853
And as the pair is locally
Oversold we will be expecting
A local bullish rebound !
Comment and subscribe to help us grow !
