GBPAUD Will Go Lower From Resistance! Sell!
Please, check our technical outlook for GBPAUD.
Time Frame: 2h
Current Trend: Bearish
Sentiment: Overbought (based on 7-period RSI)
Forecast: Bearish
The price is testing a key resistance 2.071.
Taking into consideration the current market trend & overbought RSI, chances will be high to see a bearish movement to the downside at least to 2.058 level.
P.S
We determine oversold/overbought condition with RSI indicator.
When it drops below 30 - the market is considered to be oversold.
When it bounces above 70 - the market is considered to be overbought.
Disclosure: I am part of Trade Nation's Influencer program and receive a monthly fee for using their TradingView charts in my analysis.
Like and subscribe and comment my ideas if you enjoy them!
GBPAUD trade ideas

Lingrid | GBPAUD Selling Opportunity From the Key LevelFX:GBPAUD rebounded sharply from the key support zone near 2.0415, forming a corrective leg toward the mid-range resistance at 2.0800. However, the overall structure remains within a downward channel, and the recent lower high under the red resistance trendline suggests continuation of bearish pressure. A rejection from the 2.08–2.10 zone would likely resume the prior impulse leg toward lower support levels. Until a breakout above the descending red trendline occurs, rallies remain corrective.
📉 Key Levels
Sell trigger: Rejection from 2.0800–2.0900
Sell zone: 2.0750–2.0850
Target: 2.0589 and potentially 2.0415
Invalidation: Break and close above 2.1020
💡 Risks
Breakout from the red resistance line could reverse the downtrend
Sudden AUD weakness from macro events
Price closes above the descending channel boundary
If this idea resonates with you or you have your own opinion, traders, hit the comments. I’m excited to read your thoughts!

GBPAUD and the Elliott Wave TheoryFrom the bottom left of the chart, we see the price move upwards to form a Wave 1(Green) then a 2(Green). It is important to note that this Wave 2(Green) was a Zigzag correction. This means we should expect a Flat Correction for Wave 4(Green). Wave 3(Green) is long and goes beyond the 161.8% Fib. level, and this normal expressive behaviour for Waves. Our Wave 3(Green) retests on a W1 Chart Fib. level and then drops. This drop is our Wave A(Black). Wave A(Black) retests severally around the 161.8% Fib. level. We should expect a Flat correction as stated earlier, and this means Wave B should go beyond the ending of Wave 3(Green). A confirmation on the D1 Chart would trigger formation of Wave B(Black).

GBPAUD BUY LOW OF THE RANGE (BLSHS)Price is in 3 month trading range, price attempted breakout in either direction but failed multiple times.
In a Trading Range we Buy Low Sell High Scalp (BLSHS).
- Upper Range is at (2.10379 - 2.09843).
- Low of the Range at (2.05636 - 2.04819) where price is currently at.
- Price formed a new higher low at 2.07375 showing buyers coming.
- Price was rejected strongly at the low of the range and formed RSI Divergence at the level signaling a reversal the upside.
- AUD employment data released today at 4:30AM if negative price will breakout strongly
Stop loss below the new higher low at 2.07375 or below the setup at 2.04423.
Take profit at 2.07045 or at the top of the range at (2.10379 - 2.09843).

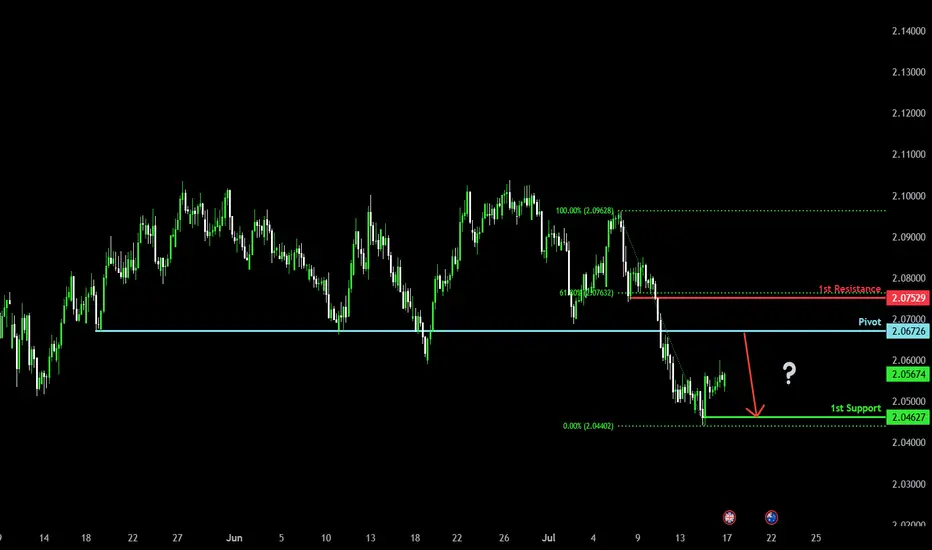
Heading into major resistance?GBP/AUD is rising towards the pivot which is a pullback resistance and could reverse to the 1st support which is a pullback support.
Pivot: 2.0672
1st Support: 2.0462
1st Resistance: 2.0752
Risk Warning:
Trading Forex and CFDs carries a high level of risk to your capital and you should only trade with money you can afford to lose. Trading Forex and CFDs may not be suitable for all investors, so please ensure that you fully understand the risks involved and seek independent advice if necessary.
Disclaimer:
The above opinions given constitute general market commentary, and do not constitute the opinion or advice of IC Markets or any form of personal or investment advice.
Any opinions, news, research, analyses, prices, other information, or links to third-party sites contained on this website are provided on an "as-is" basis, are intended only to be informative, is not an advice nor a recommendation, nor research, or a record of our trading prices, or an offer of, or solicitation for a transaction in any financial instrument and thus should not be treated as such. The information provided does not involve any specific investment objectives, financial situation and needs of any specific person who may receive it. Please be aware, that past performance is not a reliable indicator of future performance and/or results. Past Performance or Forward-looking scenarios based upon the reasonable beliefs of the third-party provider are not a guarantee of future performance. Actual results may differ materially from those anticipated in forward-looking or past performance statements. IC Markets makes no representation or warranty and assumes no liability as to the accuracy or completeness of the information provided, nor any loss arising from any investment based on a recommendation, forecast or any information supplied by any third-party.
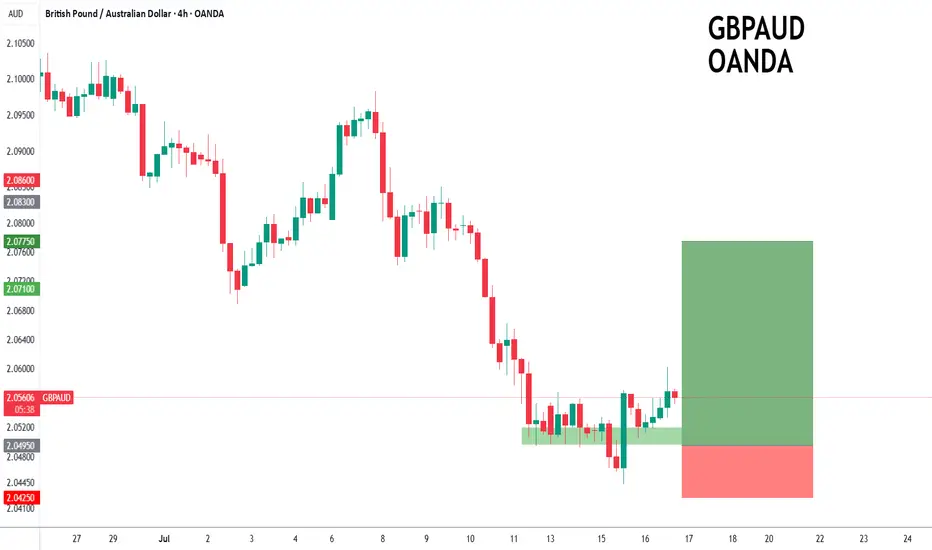
GBPAUD to turnaround?GBPAUD - 24h expiry
The primary trend remains bullish.
Price action looks to be forming a bottom.
We look for a temporary move lower.
Preferred trade is to buy on dips.
Bespoke support is located at 2.0495.
We look to Buy at 2.0495 (stop at 2.0425)
Our profit targets will be 2.0775 and 2.0820
Resistance: 2.0670 / 2.0750 / 2.0830
Support: 2.0490 / 2.0440 / 2.0400
Risk Disclaimer
The trade ideas beyond this page are for informational purposes only and do not constitute investment advice or a solicitation to trade. This information is provided by Signal Centre, a third-party unaffiliated with OANDA, and is intended for general circulation only. OANDA does not guarantee the accuracy of this information and assumes no responsibilities for the information provided by the third party. The information does not take into account the specific investment objectives, financial situation, or particular needs of any particular person. You should take into account your specific investment objectives, financial situation, and particular needs before making a commitment to trade, including seeking advice from an independent financial adviser regarding the suitability of the investment, under a separate engagement, as you deem fit.
You accept that you assume all risks in independently viewing the contents and selecting a chosen strategy.
Where the research is distributed in Singapore to a person who is not an Accredited Investor, Expert Investor or an Institutional Investor, Oanda Asia Pacific Pte Ltd (“OAP“) accepts legal responsibility for the contents of the report to such persons only to the extent required by law. Singapore customers should contact OAP at 6579 8289 for matters arising from, or in connection with, the information/research distributed.
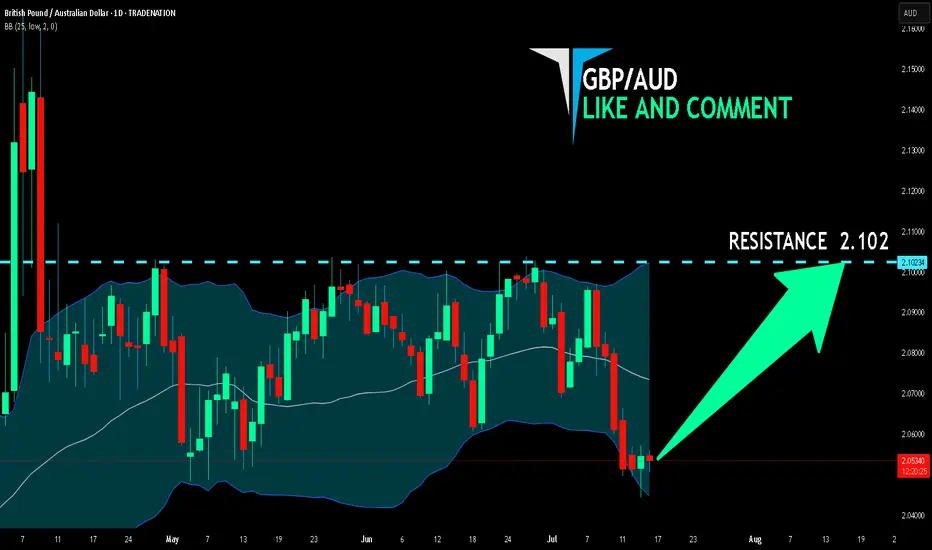
GBP/AUD BULLS ARE STRONG HERE|LONG
Hello, Friends!
Previous week’s red candle means that for us the GBP/AUD pair is in the downtrend. And the current movement leg was also down but the support line will be hit soon and lower BB band proximity will signal an oversold condition so we will go for a counter-trend long trade with the target being at 2.102.
Disclosure: I am part of Trade Nation's Influencer program and receive a monthly fee for using their TradingView charts in my analysis.
✅LIKE AND COMMENT MY IDEAS✅
GBPAUD looking for a long term downside GBPAUD a long term upside completed now its the time to look for shots
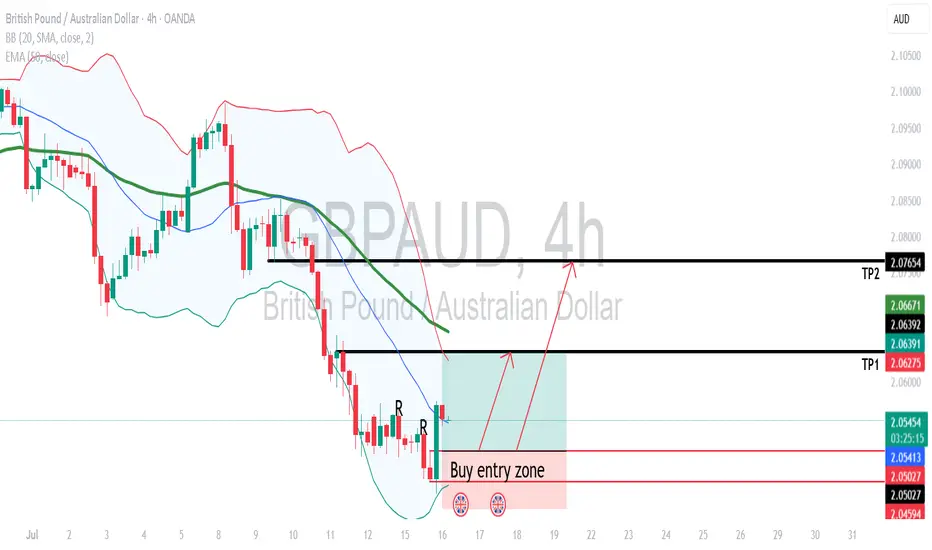
GBPAUD H4 buyer started control the marketBased on candle stick pattern, i observed a clear bullish setup.
I'm expecting the price will pullback to the entry zone.
Intraday target will be TP 1.
Calculate your own risk & reward.
Good Luck
GBPAUD Swing Trade Idea 15-07-2025Hello Traders
Here's a breakdown on GBPAUD: Daily Timeframe
1. Overall trend is bullish; price has been consistently forming HH & respecting HL.
2. Current price is in corrective phase, meaning we should be focusing on sells until we reach our discounted level, and price will be following bearish order flow (Forming LL & respecting LH)
3. Using the identified swing high and swing low, we can place our Fibonacci to identify discounted prices where we can look for possible longs again.
4. Until then we can identify internal swing low and swing high using the H4 timeframe, and we can identify premium levels to look for potential short positions (Counter trend trade) as illustrated.


GBPAUD Weekly Trade Setup–Parallel Channel Breakdown Opportunity1. Overview of GBPAUD Technical Setup
As of 15th July 2025, the GBPAUD 4-hour chart reflects a price currently positioned at a critical support level around 2.0470–2.0480, which has held multiple times since early April. The price action leading to this point has formed a classic descending parallel channel, with price making lower highs and testing horizontal support with increased frequency.
Key observations:
Price is well below the 200 EMA (currently around 2.0794), confirming a bearish long-term bias.
The resistance zone at 2.1070–2.1120 has proven strong over time, pushing back multiple rallies.
Price is compressing — getting squeezed into the lower boundary of the channel with shorter pullbacks, often a precursor to breakout.
The setup is aligning for a high-probability short trade, with a potential move toward the next major demand zone around 2.0100.
The Breakdown Thesis – What We See on the Chart
The current structure of GBPAUD tells a very clear story:
After a rally in early April, price has been trading within a consolidation range, failing to make higher highs.
The support around 2.0470 has now been tested repeatedly with lower bounces each time.
Price recently made a lower high and returned to support with momentum, increasing the probability of a breakdown.
We are expecting a bearish breakout of this support level, followed by a re-test of the broken zone, and then a strong downside continuation.
Risk Management Strategy
Every trade setup — no matter how technically perfect — must begin with a strong risk management plan.
For this GBPAUD setup:
Entry Trigger: Breakdown below 2.0470 and successful re-test rejection with bearish candle confirmation
Stop Loss: Above re-test high; ideally, just above 2.0530 (~66 pips risk)
Target 1: 2.0300 (170+ pips)
Target 2: 2.0200
Target 3 / Final: 2.0100 (potential 370+ pip move)
This gives us an excellent Risk:Reward ratio of ~1:5 or more, allowing traders to be wrong several times and still remain profitable over time.
Opportunities in the market don’t come from guessing — they come from waiting. The GBPAUD parallel channel setup is a brilliant example of structure-based trading that combines logic with discipline. Whether you're a full-time FX trader or a part-time swing participant, setups like these are where consistency is built.
Watch the breakdown. Wait for the re-test. Execute only when the market confirms your plan.
Happy Trading!
=================================================================
Disclosure: I am part of Trade Nation's Influencer program and receive a monthly fee for using their TradingView charts in my analysis.
=================================================================

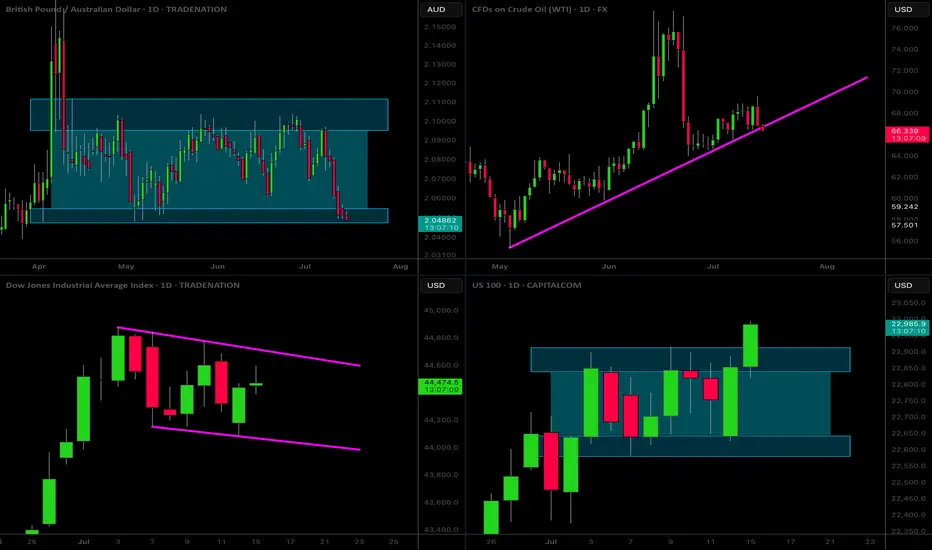
MarketBreakdown | GBPAUD, WTI CRUDE OIL, US30, US100
Here are the updates & outlook for multiple instruments in my watch list.
1️⃣ #GBPAUD daily time frame 🇬🇧🇦🇺
The market is trading within a wide horizontal parallel channel.
The price is stuck on its support.
Probabilities will be high that the market will start growing from that.
Alternatively, its bearish breakout will provide a strong bearish signal.
2️⃣ #WTI CRUDE OIL daily time frame 🛢️
The price is now testing a significant rising trend line.
It is a critical decision moment for the market.
A bearish breakout of that may trigger a strong bearish continuation.
Monitor intraday price action today. If you see a strong bullish pattern,
it will provide a reliable confirmation to buy,
3️⃣ DOW JONES INDEX #US30 daily time frame
The market started a correction movement in
a bullish flag pattern.
Your next signal to buy will be a breakout of its resistance
and a daily candle close above that.
4️⃣ NASDAQ INDEX #US100 daily time frame
The market is now breaking a resistance of a horizontal parallel channel.
IF a today's daily candle closes above that, it will confirm a start of
another bullish wave.
The market will continue growing then.
Do you agree with my market breakdown?
❤️Please, support my work with like, thank you!❤️
I am part of Trade Nation's Influencer program and receive a monthly fee for using their TradingView charts in my analysis.
GBP/AUD Tests 2.048 for Potential ReboundFenzoFx—GBP/AUD is testing the critical support level at 2.048, coinciding with the VWAP. From a technical perspective, a bullish move toward an upper resistance level is likely.
In this scenario, GBP/AUD has the potential to test the bearish FVG at approximately 2.070. Please note that the bullish outlook should be invalidated if GBP/AUD falls and stabilizes below 2.048.

GBPAUD previous support now resistance at 2.0660The GBPAUD pair is currently trading with a bearish bias, aligned with the broader downward trend. Recent price action shows a retest of the previous support zone, suggesting a temporary relief rally within the downtrend.
Key resistance is located at 2.0660, a prior consolidation zone. This level will be critical in determining the next directional move.
A bearish rejection from 2.0660 could confirm the resumption of the downtrend, targeting the next support levels at 2.0480, followed by 2.0410 and 2.0350 over a longer timeframe.
Conversely, a decisive breakout and daily close above 2.0660 would invalidate the current bearish setup, shifting sentiment to bullish and potentially triggering a move towards 2.0710, then 2.0750.
Conclusion:
The short-term outlook remains bearish unless the pair breaks and holds above 2.0660. Traders should watch for price action signals around this key level to confirm direction. A rejection favours fresh downside continuation, while a breakout signals a potential trend reversal or deeper correction.
This communication is for informational purposes only and should not be viewed as any form of recommendation as to a particular course of action or as investment advice. It is not intended as an offer or solicitation for the purchase or sale of any financial instrument or as an official confirmation of any transaction. Opinions, estimates and assumptions expressed herein are made as of the date of this communication and are subject to change without notice. This communication has been prepared based upon information, including market prices, data and other information, believed to be reliable; however, Trade Nation does not warrant its completeness or accuracy. All market prices and market data contained in or attached to this communication are indicative and subject to change without notice.

GBPAUD Will Move Higher! Buy!
Please, check our technical outlook for GBPAUD.
Time Frame: 1D
Current Trend: Bullish
Sentiment: Oversold (based on 7-period RSI)
Forecast: Bullish
The price is testing a key support 2.052.
Current market trend & oversold RSI makes me think that buyers will push the price. I will anticipate a bullish movement at least to 2.082 level.
P.S
We determine oversold/overbought condition with RSI indicator.
When it drops below 30 - the market is considered to be oversold.
When it bounces above 70 - the market is considered to be overbought.
Disclosure: I am part of Trade Nation's Influencer program and receive a monthly fee for using their TradingView charts in my analysis.
Like and subscribe and comment my ideas if you enjoy them!

GBP/AUD SHORT FROM RESISTANCE
GBP/AUD SIGNAL
Trade Direction: short
Entry Level: 2.098
Target Level: 2.062
Stop Loss: 2.122
RISK PROFILE
Risk level: medium
Suggested risk: 1%
Timeframe: 1D
Disclosure: I am part of Trade Nation's Influencer program and receive a monthly fee for using their TradingView charts in my analysis.
✅LIKE AND COMMENT MY IDEAS✅


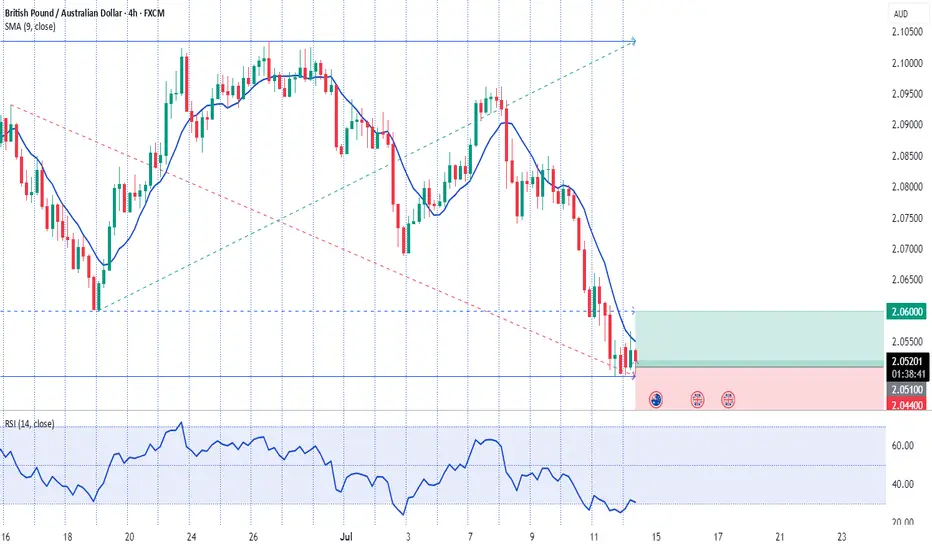
GBP/AUD: Familiar support holds as global growth fears biteThe bearish unwind in GBP/AUD stalled in familiar territory, bouncing from 2.0500 in Asian trade, continuing the pattern seen since April when Donald Trump first unveiled reciprocal tariff rates on U.S. trading partners. Now, like then, the bounce likely reflects concern about the outlook for the global economy following the unveiling of 30% tariff rates on E.U. imports entering the United States from August 1. The headline-driven nature of the move overrides the deeply bearish message coming from momentum indicators like RSI (14) and MACD.
If the pair were to move towards 2.0500 again, it would create a decent long setup where positions could be established above the level with a stop beneath for protection. 2.0600 and 2.0700 screen as possible targets, although the most appealing target would be 2.0800 from a risk-reward perspective—that level has seen plenty of work either side of it over recent months and has the 50-day moving average located just above.
If the pair were to reverse back through 2.0500 and close there, the bullish setup would be invalidated, opening the door for bearish trades to be set targeting support at 2.0300.
Good luck!
DS

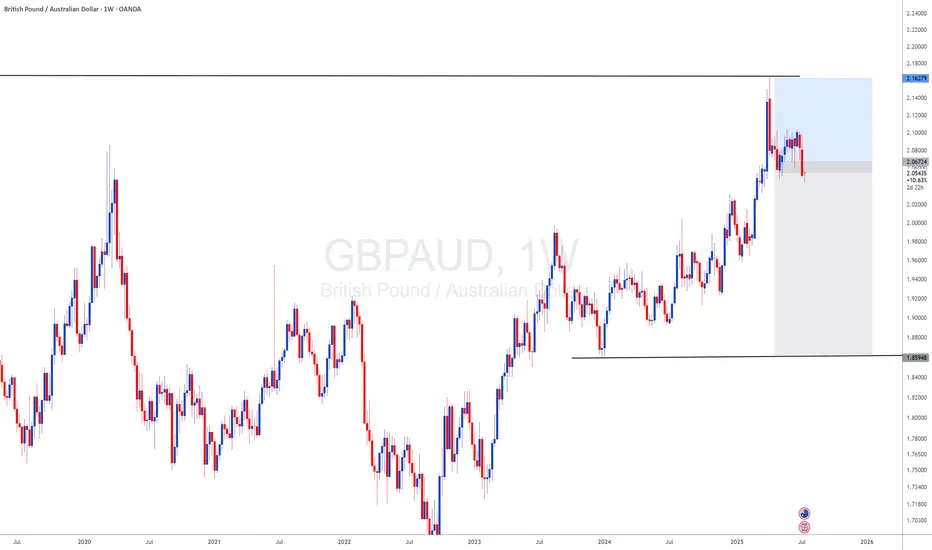
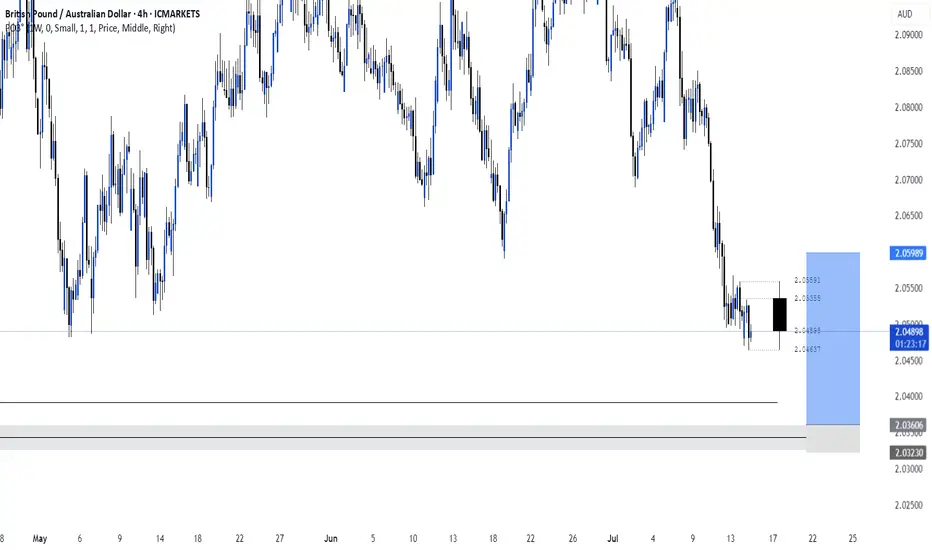
GBPAUD Weekly Chart Short setup for Swing trade💫Hello Traders, here is a new ICT Short setup in GBPAUD weekly chart.
This idea can be used for Swing trade and intraday trade main direction.
We expect GBPAUD will land on a Swing high marked by the blue Demand Zone.
Good luck.💝

GBP-AUD Risky Long! Buy!
Hello,Traders!
GBP-AUD keeps falling and
The pair is locally oversold
So as the pair is retesting
The horizontal support
Of 2.0480 we will be expecting
A local bullish correction
On Monday
Buy!
Comment and subscribe to help us grow!
Check out other forecasts below too!
Disclosure: I am part of Trade Nation's Influencer program and receive a monthly fee for using their TradingView charts in my analysis.
