GBPCAD: Could we see price continue to the downside?Price on GBPCAD looks quite interesting at the moment, this latest moves continues the narrative of a downtrend.
As it is following a downtrend, each touch has served as a catalyst for a directional move. The most recent interaction is particularly interesting, because it's hovering here for some time now, and this could be a clue that we can use.
What may follow is subtle but telling: compression at trendline, low-volume candles suggesting exhaustion, all aligning for more potential release downward.
My target would be toward 1.8100 where we have a clear support zone. Momentum has respected structure and if this move plays out, I don't think it will be a breakout, but a continuation of a narrative that’s already been happening. This is what makes the setup so compelling. It’s not new, it’s the a "story being told".
Though a scenario for more upside is possible and can happen just as much. Still, I would take the side for more downside taken into account all above.
GBPCAD trade ideas

GBPCAD – Resistance Test After Ascending Triangle BreakdownGBPCAD recently broke down from an ascending triangle pattern, with price now retesting the resistance area near 1.8500.
Key Resistance: 1.8700 – 1.8500
First Target: 1.8000 (strong low)
Second Target: 1.7800 (demand zone)
Support Level: ~1.7200
Structure shows multiple tops and a weakening bullish trendline, indicating sellers may remain active below resistance. A confirmed rejection could lead to a move toward the demand zone.
Chart highlights:
Ascending triangle breakdown
Bearish retest at resistance
Two-step target projection based on structure
This analysis is for educational purposes only and not financial advice

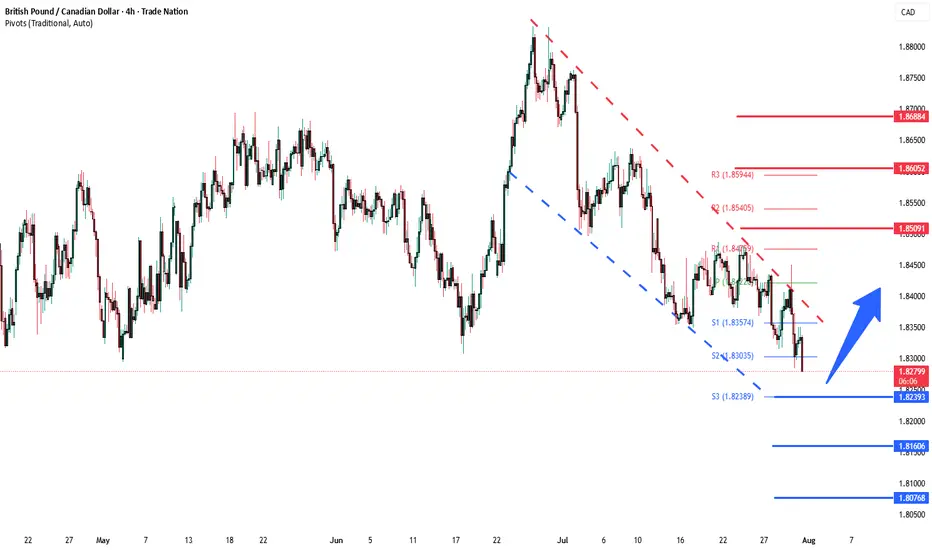
GBPCAD Forming Descending ChannelGBPCAD is currently trading within a well-defined descending channel on the 4H chart, and price action is showing early signs of a potential breakout to the upside. After multiple rejections from the lower boundary, the pair is now consolidating just beneath the channel resistance. If bulls manage to push above the upper trendline with strong volume, it would confirm a bullish breakout, offering a short-term trend reversal opportunity. A clean breakout could lead to a sharp rally toward the 1.8500–1.8600 levels, supported by momentum and market structure.
On the fundamental side, the British pound is gaining strength as markets continue to digest the Bank of England's recent tone, which remains relatively hawkish compared to other G7 central banks. With UK core inflation still elevated and wage growth running hot, the BoE is likely to remain cautious about rate cuts. Meanwhile, the Canadian dollar is under pressure, weighed down by falling oil prices and softer-than-expected Canadian employment data, which fuels expectations of a more dovish Bank of Canada. This divergence creates a bullish backdrop for GBPCAD in the near term.
Traders should watch for a clear break and candle close above the descending channel, especially above the 1.8350–1.8370 resistance zone. A breakout with follow-through would validate bullish continuation, and dips back toward the breakout zone could serve as a retest for new longs. Risk management remains key, with invalidation below recent swing lows around 1.8200. The setup aligns with trendline breakout strategies and could provide favorable risk-to-reward potential for buyers.
Overall, GBPCAD is setting up for a possible bullish reversal after weeks of steady downside. With technical structure aligning and fundamentals supporting GBP strength over CAD, this pair may offer a clean breakout play. Momentum traders should stay alert for confirmation signals and position accordingly to ride the next potential leg up.

GBP/CAD - H4 - Bearish Flag (26.07.2025)The GBP/CAD Pair on the H4 timeframe presents a Potential Selling Opportunity due to a recent Formation of a Bearish Flag Pattern. This suggests a shift in momentum towards the downside in the coming Days.
Possible Short Trade:
Entry: Consider Entering A Short Position around Trendline Of The Pattern.
Target Levels:
1st Support – 1.8242
2nd Support – 1.8139
🎁 Please hit the like button and
🎁 Leave a comment to support for My Post !
Your likes and comments are incredibly motivating and will encourage me to share more analysis with you.
Best Regards, KABHI_TA_TRADING
Thank you.
Disclosure: I am part of Trade Nation's Influencer program and receive a monthly fee for using their TradingView charts in my analysis.

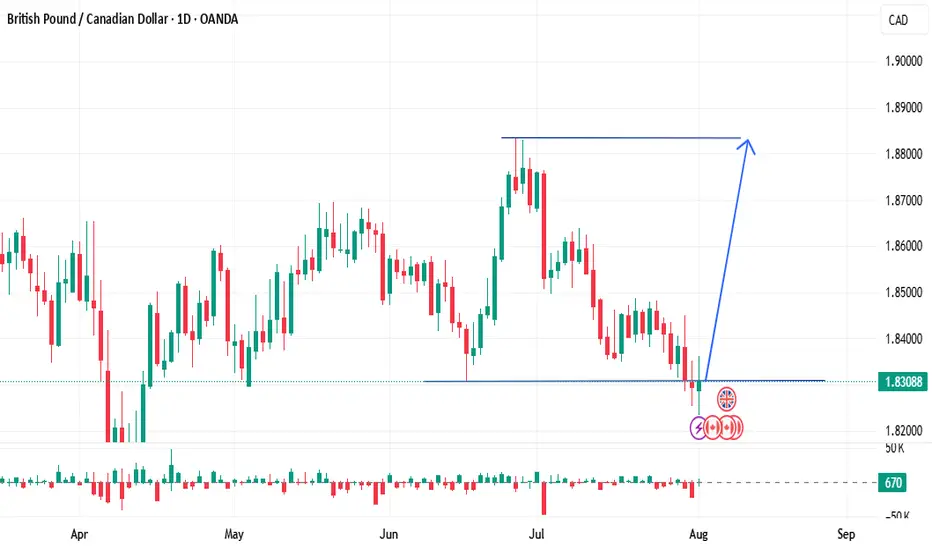
GBP/CAD: Strong Bullish Move - Target 1.8590 and 1.8755GBPCAD is showing bullish movement after bouncing from its support level at 1.8300. This means buyers (the bulls) are in control and are pushing the price higher. Our first target for this move is 1.8590. If the price breaks above this level, the next target we expect is 1.8755.

GBPCADWe took two consecutive losses, which means I deviated from my trading plan. I'm obsessed with improvement, and I learn from every loss, because losses are inevitable, the casualties of war. The battle continues. I'm anticipating a drop in GBP/CAD, and I’ve got my fingers crossed that it plays out,but regardless am not attached to the outcom.

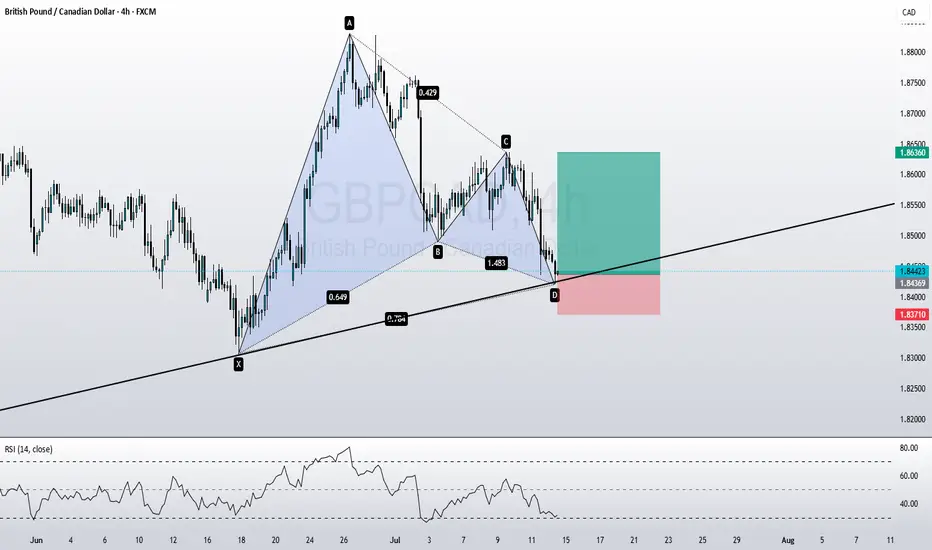
GBPCAD longOn the GBPCAD chart, we have a bullish Gartley harmonic pattern that aligns with an upward trendline. I expect the price to move to the upside.
GBP_CAD SHORT FROM RESISTANCE|
✅GBP_CAD is set to retest a
Strong resistance level above at 1.8511
After trading in a local uptrend for some time
Which makes a bearish pullback a likely scenario
With the target being a local support below at 1.8430
SHORT🔥
✅Like and subscribe to never miss a new idea!✅

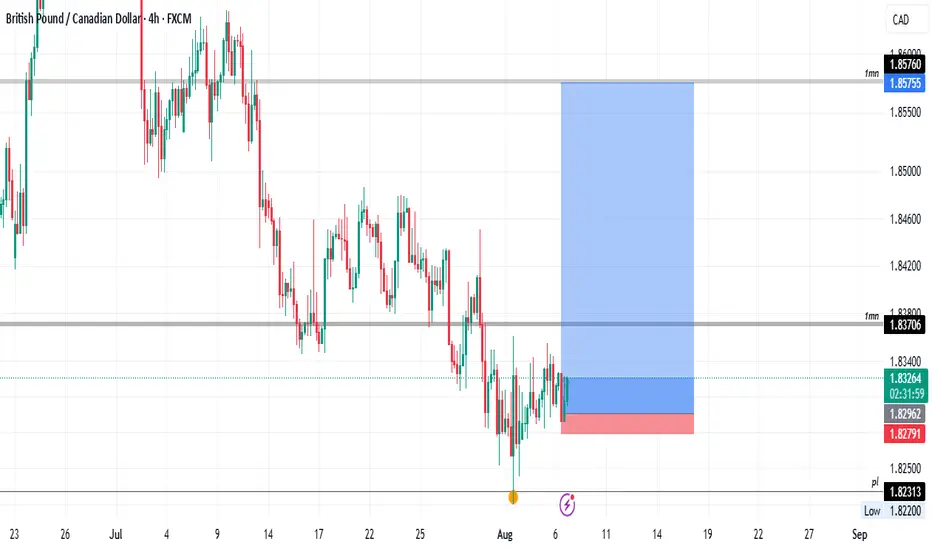
GBPCAD – Buy the Dip, Ride the TrendGBPCAD – Buy the Dip, Ride the Trend
Strong trends don’t die quietly — they pause, reload, and launch again. GBPCAD is pulling back into a key support zone after a powerful run, and the setup is looking ripe for a bounce. Oversold conditions and bullish price action are lighting up this dip as a buy opportunity.
📈 I’m bullish on GBPCAD — looking to buy at support in an uptrend.
Here’s what’s backing this view:
Uptrend intact on higher timeframes ✅
Price at support + oversold conditions 📉
Bullish signals on recent candles 🕯️
Weak CAD sentiment + UK resilience 💷🍁
Rising net short positioning against CAD
The UK economy is showing resilience. Q1 growth came in at 0.7%, and while May GDP dipped slightly, momentum hasn’t collapsed. The Bank of England is expected to cut rates slowly, with markets fully pricing in a 25bps cut on August 7. Sentiment around the Pound is mixed, but GBPCAD isn’t about raw GBP strength — it’s about CAD weakness.
Canada’s recent data is muddy. Job gains are strong, but GDP shrank in both April and May. Inflation is holding around 2.5%, so further Bank of Canada cuts are less likely — but bearish sentiment toward the CAD is climbing fast. Net short positions hit a six-week high, and falling oil prices plus tariff risks are turning the Canadian dollar into a sell candidate.
The technicals and fundamentals are aligning. GBPCAD may grind higher as capital flows away from CAD and into stronger currencies.
Would you ride this rebound? Or are you fading the trend? Let’s hear your take.

Buy GBP/CAD approaching very strong daily support.GBP/CAD has been in decline for 6 weeks now but is approaching very strong Daily support that pushed the price up many times before. This Daily support also lines up with the 200 Daily MA.
Buy : 1.8240
Stop : 1.812
Profit : 1.8540
Risk : 1/2.50

weekend analysis for GBPCAD.price likely to move back towards the upside, favouring the bulls ready for the market next week.
GBPCADIn the monthly (higher timeframes) we are bullish on GBPCAD, although we have a current break of structure.
In the weekly timeframes we are bullish, and reacted after a retracement to a potential psychological level.
In the lower time frames prices have been accumulating in the psychological level thus expecting a bullish trend continuation from the area.
We risked 17 Pips aiming for a 1:16 trade.
GBPCAD Technical & Order Flow AnalysisOur analysis is based on a multi-timeframe top-down approach and fundamental analysis.
Based on our assessment, the price is expected to return to the monthly level.
DISCLAIMER: This analysis may change at any time without notice and is solely intended to assist traders in making independent investment decisions. Please note that this is a prediction, and I have no obligation to act on it, nor should you.
Please support our analysis with a boost or comment!


GBP-CAD Bearish Bias! Sell!
Hello,Traders!
GBP-CAD keeps growing
And the pair is locally overbought
So after the pair hits the
Horizontal resistance
Of 1.8530 we will be expecting
A local bearish correction
Sell!
Comment and subscribe to help us grow!
Check out other forecasts below too!
Disclosure: I am part of Trade Nation's Influencer program and receive a monthly fee for using their TradingView charts in my analysis.

GBPCAD: The Hunt for the Previous Month's LowLike a predator stalking its prey, the market often moves with a clear objective. For GBPCAD, the primary target is now the massive pool of liquidity resting below the Previous Month's Low. This isn't a random drop; it's a calculated hunt. This analysis lays out the plan to join the reversal after the hunt is complete.
The price of GBPCAD is approaching a large pool of liquidity in the form of the Previous Month's Low (PML) , with the May 5th low located just below it. There is a high probability that this liquidity will be swept in the near future, because with only a few days left until the end of the month, the PML will no longer act as such a strong magnet for the price as it does now.
The capture of this liquidity would be accompanied by the mitigation of a daily order block in conjunction with a daily FVG . This confluence of factors could act as strong support for a potential price bounce, with a minimum target of a liquidity sweep of the Previous Week's High (PWH) .
SETUP CONDITIONS
The condition for the long setup to form would be a sharp downside liquidity sweep with a candle wick, which mitigates the upper part of the daily order block, followed by the start of a bullish order flow on a lower timeframe .
► Invalidation: Invalidation of the long scenario would be a daily candle body closing below the May 5th low, or a sharp drop to the middle of the daily order block.
~~~~~~~~~~~~~~~~~~~~~~~~~~~~~~~~~~~~~~~~~~~~~~~~~~~~~~~~~~~~~~~~~
The principles and conditions for forming the manipulation zones I show in this trade idea are detailed in my educational publication, which was chosen by TradingView for the "Editor's Picks" category and received a huge amount of positive feedback from this insightful trading community. To better understand the logic I've used here and the general principles of price movement in most markets from the perspective of institutional capital, I highly recommend checking out this guide if you haven't already. 👇
P.S. This is not a prediction of the exact price direction. It is a description of high-probability setup that become valid only if specific conditions are met when the price reaches the marked POI. If the conditions are not met, the setup are invalid. No setup has a 100% success rate, so if you decide to use this trade idea, always apply a stop-loss and proper risk management. Trade smart.
~~~~~~~~~~~~~~~~~~~~~~~~~~~~~~~~~~~~~~~~~~~~~~~~~~~~~~~~~~~~~~~~~
If you found this analysis helpful, support it with a Boost! 🚀
Have a question or your own view on this idea? Share it in the comments. 💬
► Follow me on TradingView to get real-time updates on THIS idea (entry, targets & live trade management) and not to miss my next detailed breakdown.
~~~~~~~~~~~~~~~~~~~~~~~~~~~~~~~~~~~~~~~~~~~~~~~~~~~~~~~~~~~~~~~~~

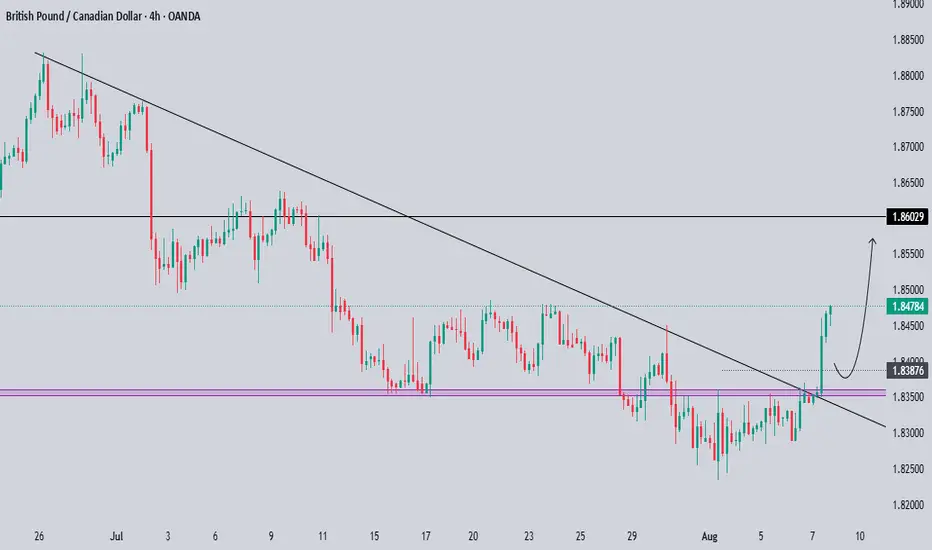
GBPCAD At Support - High probability reversalGBPCAD descended with strength, and has now reached a strong support zone.
Price now hovers above and this zone and is a great indication to use for possible reversal move, that could send price into the 1.86100 level.
But if price breaks below support with momentum, then I’ll back off this bullish bias and reassess, and consider the reversal idea invalidated, with potential for further downside.
Just sharing my thoughts for the charts, this isn’t financial advice. Always confirm your setups and manage your risk properly.
Disclosure: I am part of Trade Nation's Influencer program and receive a monthly fee for using their TradingView charts in my analysis.

GBPCAD waiting to shortbased on daily candle closed yesterday, i'm expecting another bearish move today.
i'm marked the possible resistant area and waiting lower timeframe to do reversal pattern.
calculate your own risk & reward.
Good luck

GBPCAD is in the bearish directionHello Traders
In This Chart gbpcad HOURLY Forex Forecast By FOREX PLANET
today GBPCAD analysis 👆
🟢This Chart includes_ (GBPCAD market update)
🟢What is The Next Opportunity on GBPCAD Market
🟢how to Enter to the Valid Entry With Assurance Profit
This CHART is For Trader's that Want to Improve Their Technical Analysis Skills and Their Trading By Understanding How To Analyze The Market Using Multiple Timeframes and Understanding The Bigger Picture on the Chart

GBPCAD corrective pullback supported at 1.8240The GBPCAD remains in a bullish trend, with recent price action showing signs of a corrective pullback within the broader uptrend.
Support Zone: 1.8240 – a key level from previous consolidation. Price is currently testing or approaching this level.
A bullish rebound from 1.8240 would confirm ongoing upside momentum, with potential targets at:
1.8510 – initial resistance
1.8600 – psychological and structural level
1.8690 – extended resistance on the longer-term chart
Bearish Scenario:
A confirmed break and daily close below 1.8240 would weaken the bullish outlook and suggest deeper downside risk toward:
1.8160 – minor support
1.8076 – stronger support and potential demand zone
Outlook:
Bullish bias remains intact while the GBPCAD holds above 1.8240. A sustained break below this level could shift momentum to the downside in the short term.
This communication is for informational purposes only and should not be viewed as any form of recommendation as to a particular course of action or as investment advice. It is not intended as an offer or solicitation for the purchase or sale of any financial instrument or as an official confirmation of any transaction. Opinions, estimates and assumptions expressed herein are made as of the date of this communication and are subject to change without notice. This communication has been prepared based upon information, including market prices, data and other information, believed to be reliable; however, Trade Nation does not warrant its completeness or accuracy. All market prices and market data contained in or attached to this communication are indicative and subject to change without notice.
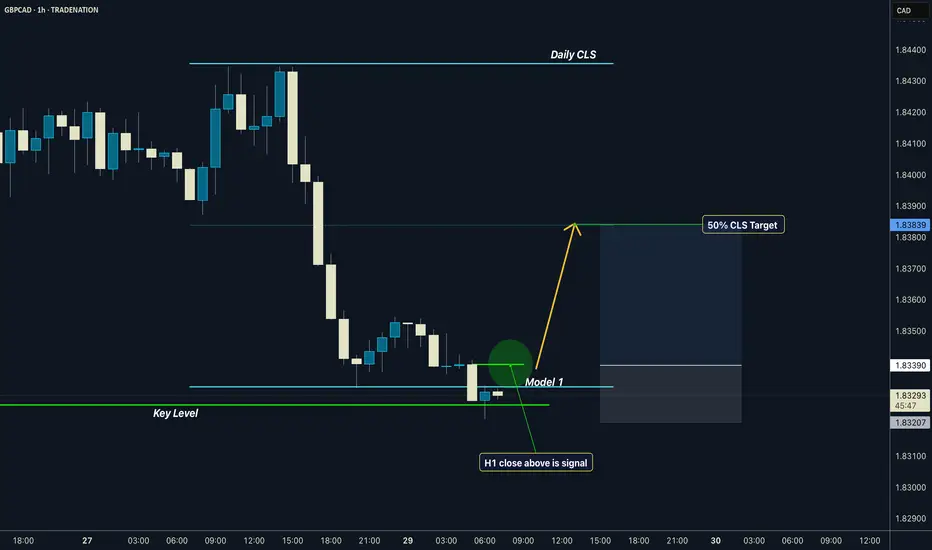
GBPCAD I Daily CLS I Model 1 I 50% CLS TargetYo Market Warriors ⚔️
Fresh outlook drop — if you’ve been riding with me, you already know:
🎯My system is 100% mechanical. No emotions. No trend lines. No subjective guessing. Just precision, structure, and sniper entries.
🧠 What’s CLS?
It’s the real smart money. The invisible hand behind $7T/day — banks, algos, central players.
📍Model 1:
HTF bias based on the daily and weekly candles closes,
Wait for CLS candle to be created and manipulated. Switch to correct LTF and spot CIOD. Enter and target 50% of the CLS candle.
For high probability include Dealing Ranges, Weekly Profiles and CLS Timing.
Analysis done on the Tradenation Charts
Disclosure: I am part of Trade Nation's Influencer program and receive a monthly fee for using their TradingView charts in my analysis.
Trading is like a sport. If you consistently practice you can learn it.
“Adapt what is useful. Reject whats useless and add whats is specifically yours.”
David Perk aka Dave FX Hunter
💬 Don't hesitate to ask any questions or share your opinions
GBP/CAD Possible Buy Trade With Great Pips!The price is standing at a strong area of support that is a historical area of support and pushed the price multiple. I think it can be a great area to enter a buy trade but I have 2 conditions to enter this trade:
1- great bullish price action above an area of support.
2- if we have a daily closure below this area of support this trade will be canceled.
I will commit to these conditions and see what will happen.
