GBPCAD - BEARISH MOVE !Hello Traders !
On Monday 19 May, The GBPCAD reached the resistance level (1.86946 - 1.87188).
The price broke the support line.
So, I expect a bearish move📉
_______________
TARGET: 1.84150🎯
GBPCAD trade ideas

GBPCAD 08/06/2025Weekly:
-Price is at weekly highs and we could expect a reaction.
Daily:
-H&S pattern.
4H:
-Bearish W pattern.
-H&S pattern.

GBP/CAD BULLISH BIAS RIGHT NOW| LONG
Hello, Friends!
GBP/CAD pair is trading in a local uptrend which know by looking at the previous 1W candle which is green. On the 1H timeframe the pair is going down. The pair is oversold because the price is close to the lower band of the BB indicator. So we are looking to buy the pair with the lower BB line acting as support. The next target is 1.853 area.
Disclosure: I am part of Trade Nation's Influencer program and receive a monthly fee for using their TradingView charts in my analysis.
✅LIKE AND COMMENT MY IDEAS✅

GBP-CAD Will Go Down! Sell!
Hello,Traders!
GBP-CAD is already going
Down from the wide horizontal
Resistance of 1.8583 so we are
Locally bearish biased and
We will be expecting a
Further bearish move down
Sell!
Comment and subscribe to help us grow!
Check out other forecasts below too!
Disclosure: I am part of Trade Nation's Influencer program and receive a monthly fee for using their TradingView charts in my analysis.

GBP Bearish Outlook | Potential GBP Short Setup The GBP is currently showing signs of weakness as it approaches a key resistance zone. Price action suggests a potential bearish reversal, with lower highs forming and momentum indicators signaling exhaustion. A rejection from this level could lead to a continuation of the downtrend. Traders may look for short opportunities upon confirmation of a breakdown below support, with potential targets at previous swing lows.
Key Points:
Price testing major resistance zone.
Bearish candlestick patterns visible.
Momentum divergence / overbought RSI (if applicable).
Potential short entry on breakdown with tight risk management.
This is just idea not financial advice

GBPCAD SELLBy utilizing levels, historical patterns, , we can formulate a hypothesis that the market might follow a similar trajectory if bearish sentiment prevails.

GBPCAD - Bearish BAT Pattern Market is forming Bearish BAT pattern, we plan our entry on break on "A" point and then plan our TP till market reaches PRZ. as these pattern are reversal patterns, we plan our next entry on D point after good bearish signal is observed. we will look into divergence or any good bearish candle. as BAT pattern usually form Divergence before Bearish trend.
For Buy Entry : Place stop loss below the "C" point and TP at PRZ
For Sell Entry : Place stop loss above PRZ (which is also a good resistance level)

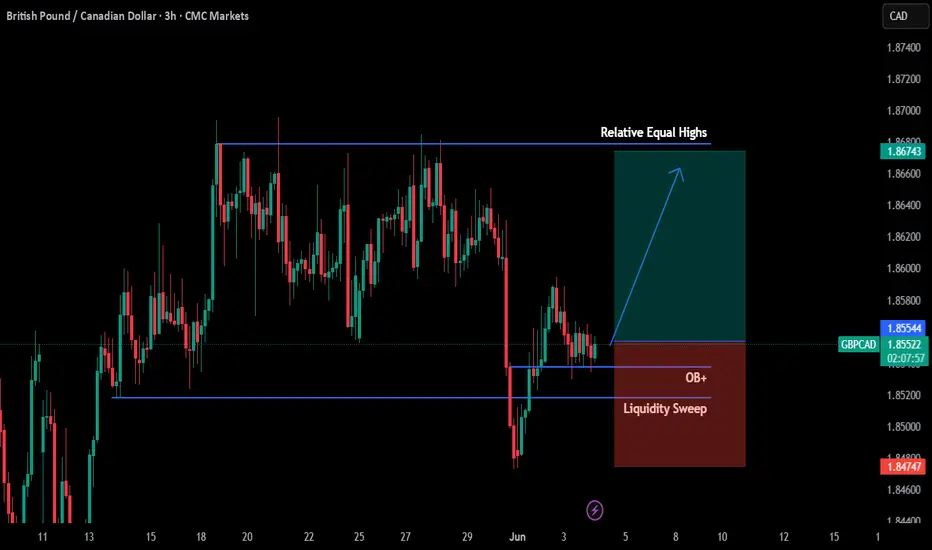
GBP/CAD Potential Upward Movement💡 Buy Market Order @ 1.85544
🎯 Target Profit 1.86743
🛑 Stop Loss 1.84747
❌ Do not risk more than 1% of your account on each trade
Description:
The price has swept liquidity under the swing lows and bounced back quickly. GBP/CAD is in a consolidation mode before a new move upward all the way up toward 1.86 mark.
-------------------------------------------------------------------------------------
Please press “Like” if you appreciate the trading idea 👍
“Follow” for more trading ideas in the future 👀
“Comment” below to share your thoughts with us and other traders 👥
-------------------------------------------------------------------------------------
Risk Disclaimer: All trading ideas published by “PriceActionDesk” are for educational purposes only. These posts can help you to enhance your trading skills, but please do your own research before opening any trading position. ⚠️
-------------------------------------------------------------------------------------
🙂 Good Luck!
GBPCAD Counter-Trend SELL(Weekly) - Price hit previous extreme high at (1.85932 - 1.87820) and was rejected forming double top neckline at (1.81470 - 1.80561) .
(Weekly) - Previous Week Candle Close is Shooting Star showing sellers taking action at Key Resistance level.
(Daily) - Price formed double top inside our resistance level at (1.85932 - 1.87820).
(Daily) - Price broke double neckline at (1.85533 - 1.85774).
(H4) - Price was in distribution at (1.86602 - 1.85774).
(H4) - Rising Trendline that price broke connecting (1.80561 - 1.86011).
Trade Entry.
(H4) - Wait for price to retest our daily double top neckline & low of the distribution at (1.85533 - 1.85774) to join the reversal.
(H4) - Take profit at Weekly Double Top Neckline at (1.81470 - 1.80561).

GBPCAD SHORT POTENTIALGBPCAD broke the previous support level, pull-back created. Based on my strategy is a good time to sell.
-
-
What do you think?

GBPCAD SHORT Market structure bearish on HTFs DW
Entry at both Weekly and Daily AOi
Weekly Rejection at AOi
Daily Rejection At AOi
Previous Structure point Daily
Around Psychological Level 1.86000
H4 EMA retest
H4 Candlestick rejection
Rejection from Previous structure
Levels 4.78
Entry 100%
REMEMBER : Trading is a Game Of Probability
: Manage Your Risk
: Be Patient
: Every Moment Is Unique
: Rinse, Wash, Repeat!
: Christ is King.

GBPCAD Massive Long! BUY!
My dear subscribers,
GBPCAD looks like it will make a good move, and here are the details:
The market is trading on 1.8497 pivot level.
Bias - Bullish
My Stop Loss - 1.8456
Technical Indicators: Both Super Trend & Pivot HL indicate a highly probable Bullish continuation.
Target - 1.8577
About Used Indicators:
The average true range (ATR) plays an important role in 'Supertrend' as the indicator uses ATR to calculate its value. The ATR indicator signals the degree of price volatility.
Disclosure: I am part of Trade Nation's Influencer program and receive a monthly fee for using their TradingView charts in my analysis.
———————————
WISH YOU ALL LUCK

GBPCAD short movePrice had broken the neckline and a retested had happened and hence i expect the price to continues to drop to the next support level 1.82662 or more.

GBPCAD new bearish push expecting
OANDA:GBPCAD price break zone, currently in BEARISH PENNANT, after todays BOC event here for expect bearish push
SUP zone: 1.85800
RES zone: 1.84200, 1.83800

GBP/CAD bearish move in the making?HI Traders.
We see a clear breakout from a correction pattern.
Now i will look if a ltf correction is forming. My entry will be the breakout from the ltf correction

GBPCAD SHORTPrice broke the structure with impulse movement, IF the price breaks the correction then i expect to moving further to the downside.
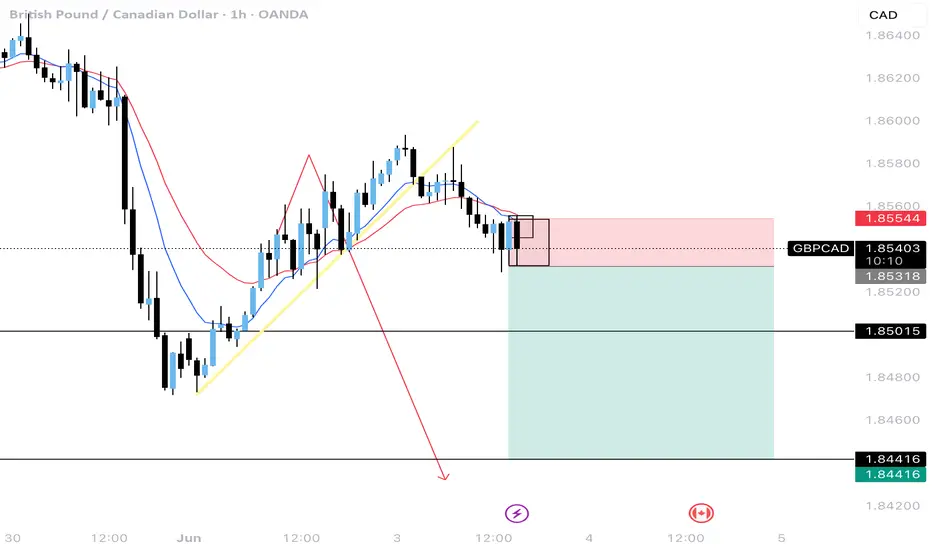
GBPCAD Sell- Go for short sell then manage your trade
- potentially go lower but beware of pull back manipulation when break low
- Refine entry with smaller SL for better RR, if your strategy allow
A Message To Traders:
I’ll be sharing high-quality trade setups for a period time. No bullshit, no fluff, no complicated nonsense — just real, actionable forecast the algorithm is executing. If you’re struggling with trading and desperate for better results, follow my posts closely.
Check out my previously posted setups and forecasts — you’ll be amazed by the high accuracy of the results.
"I Found the Code. I Trust the Algo. Believe Me, That’s It."

GBPCAD ENTER INTO DOWNTREND STRUCTUREGBPCAD ENTER INTO DOWNTREND STRUCTURE.
Price break the key support level and formed lower low.
Market is expected to remain Bearish in upcoming sessions.
On higher side market may test the resistance level of 1.8690.
On bearish side market may achieve target level of 1.8320.

GBPCADPrice rejected daily resistance. H4 support was broken and retest is being made. Looking for bearish confirmations to short.

GBPCAD SELL OPPORTUNITY 5 MIN TIMEFRAMEClear trend breakout and retest has occured. Targetting for it to hit the large imbalance on the left before going down which it did. Targetting imbalances on 5 min tf. the 30 min and 4 hr 10 and 20 EMA on downtrend too
GBPCAD is in the bearish directionHello Traders
In This Chart gbpcad HOURLY Forex Forecast By FOREX PLANET
today GBPCAD analysis 👆
🟢This Chart includes_ (GBPCAD market update)
🟢What is The Next Opportunity on GBPCAD Market
🟢how to Enter to the Valid Entry With Assurance Profit
This CHART is For Trader's that Want to Improve Their Technical Analysis Skills and Their Trading By Understanding How To Analyze The Market Using Multiple Timeframes and Understanding The Bigger Picture on the Chart

Nearly 3 years respected data on GBPCADLong term bullish reversal in views if channel support is respected

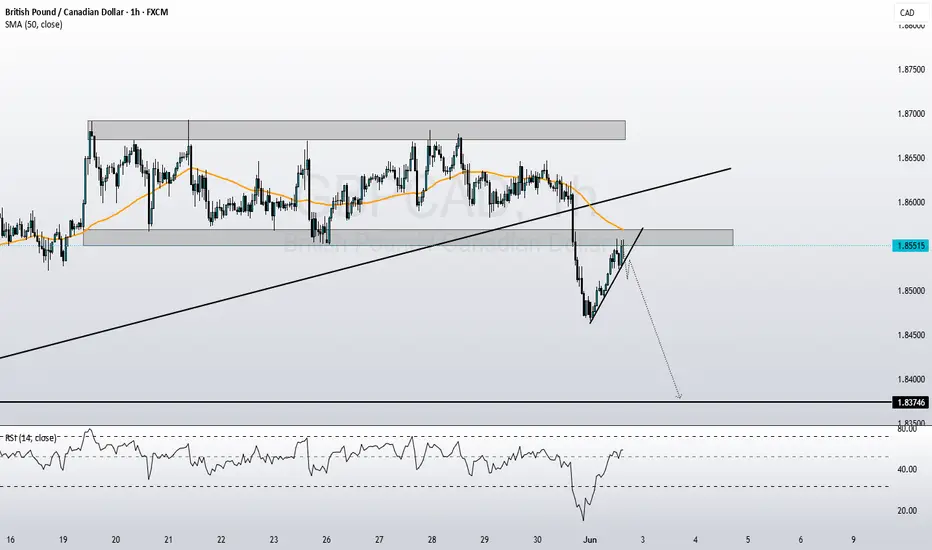
GBPCAD Short SetupPrice broke below the ascending structure and is now pulling back for a potential retest of the underside (previous support turned resistance). I’m watching the marked red zone for a possible bearish reaction – ideally with rejection wicks or bearish engulfing confirmation.
RSI is recovering but approaching potential overbought territory. If price reacts at the retest zone, I expect continuation down toward the lower boundary of the larger descending channel.
⚠️ Patience here – no entry yet, just planning the short if conditions align.
Let the market come to you.
