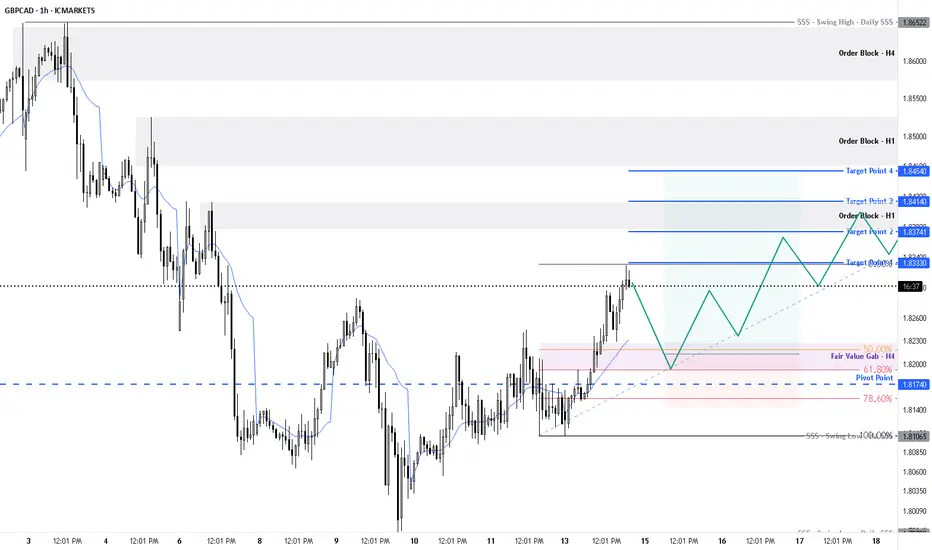
GBPCAD – Bullish Setup (1H Divergence)✅ Setup Summary:
Timeframe: 1 Hour
Signal: Bullish Divergence
Bias: Short-term bullish – Potential reversal or corrective bounce
🔍 Technical Breakdown:
Divergence Present:
Price made a lower low, while RSI/MACD made a higher low
→ Sign of bearish momentum weakening
Support Area:
Price reacting near a previous demand zone or horizontal support
Candlestick Clue:
Watch for bullish engulfing, hammer, or structure break
📈 Trade Plan – LONG
Entry:
On confirmation from bullish candle
Or break of minor 1H resistance or trendline
Stop-Loss:
Below the divergence swing low
Target:
TP1: Last 1H high
TP2: Fib 0.5 or 0.618 retracement of recent bearish move
R:R Ratio: Minimum 1:1.5
⚠️ Watch Out For:
GBP or CAD news (e.g. oil prices affecting CAD)
Break below divergence low = invalidates the setup
Best paired with a break of internal structure
GBPCAD trade ideas

GBPCAD💡Chart analysis of the GBP/CAD currency pair (daily time frame). The price is currently retesting the broken structure - a demand zone. If it fails to break above it, it may return to the downside towards the support area (S.1). The MACD indicator shows decreasing upward momentum, supporting the possibility of an upcoming decline.
⛔️Not investment advice for educational purposes only.

SHORT ON GBP/CADGBP/CAD is currently in the pullback phase of its overall uptrend.
Its has given a perfect BOS (break of structure) to the downside followed by a perfect retest of the supply area that created the BOS.
I will be selling GBP/CAD to the next demand level for a 500-600 pip move.


GBPCAD Technical Analysis! SELL!
My dear subscribers,
GBPCAD looks like it will make a good move, and here are the details:
The market is trading on 1.8356 pivot level.
Bias - Bearish
Technical Indicators: Both Super Trend & Pivot HL indicate a highly probable Bearish continuation.
Target - 1.8184
About Used Indicators:
The average true range (ATR) plays an important role in 'Supertrend' as the indicator uses ATR to calculate its value. The ATR indicator signals the degree of price volatility.
Disclosure: I am part of Trade Nation's Influencer program and receive a monthly fee for using their TradingView charts in my analysis.
———————————
WISH YOU ALL LUCK

More DATA = Better Trades, adopt a "Top Down" approach!! All the information you need to find a high probability trade are in front of you on the charts so build your trading decisions on 'the facts' of the chart NOT what you think or what you want to happen or even what you heard will happen. If you have enough facts telling you to trade in a certain direction and therefore enough confluence to take a trade, then this is how you will gain consistency in you trading and build confidence. Check out my trade idea!!
www.tradingview.com

Tue 15th Apr 2025 GBP/CAD Daily Forex Chart Buy SetupGood morning fellow traders. On my Daily Forex charts using the High Probability & Divergence trading methods from my books, I have identified a new trade setup this morning. As usual, you can read my notes on the chart for my thoughts on this setup. The trade being a GBP/CAD Buy. Enjoy the day all. Cheers. Jim

Pullback resistance ahead?GBP/CAD is rising towards the resistance which is a pullback resistance that lines up with the 127.2% Fibonacci extension and could reverse from this level to our take profit.
Entry: 1.8372
Why we like it:
there is a pullback resistance that lines up with the 127.2% Fibonacci extension.
Stop loss: 1.8465
Why we like it:
There is an overlap resistance that is slightly below the 161.8% Fibonacci extension.
Take profit: 1.8227
Why we like it:
There is a pullback support level.
Enjoying your TradingView experience? Review us!
Please be advised that the information presented on TradingView is provided to Vantage (‘Vantage Global Limited’, ‘we’) by a third-party provider (‘Everest Fortune Group’). Please be reminded that you are solely responsible for the trading decisions on your account. There is a very high degree of risk involved in trading. Any information and/or content is intended entirely for research, educational and informational purposes only and does not constitute investment or consultation advice or investment strategy. The information is not tailored to the investment needs of any specific person and therefore does not involve a consideration of any of the investment objectives, financial situation or needs of any viewer that may receive it. Kindly also note that past performance is not a reliable indicator of future results. Actual results may differ materially from those anticipated in forward-looking or past performance statements. We assume no liability as to the accuracy or completeness of any of the information and/or content provided herein and the Company cannot be held responsible for any omission, mistake nor for any loss or damage including without limitation to any loss of profit which may arise from reliance on any information supplied by Everest Fortune Group.

GBP/CAD For Bullishwait for pull-back near by entry point and then go long
general trend is up trend
have fun :)
gbpcad swing sell following market structureas always the trend is always your friend here in this senerio we have a simple smc concept and a breaker block as our poi, since all condition is met am shorting this trade..... 1:8 RR quite cool right? check me out on tiktok equal fx.

GBPCAD Another Reversal? Picture says it all.
We break the resistance on the 3H Candle and we should be looking at going upwards, we stay below and we'll probably start another reversal.

Bullish bounce off pullback support?GBP/CAD has bounced off the pivot which has been identified as a pullback support and could rise to the 1st resistance which aligns with the 61.8% Fibonacci retracement.
Pivot: 1.8091
1st Support: 1.7913
1st Resistance: 1.8417
Risk Warning:
Trading Forex and CFDs carries a high level of risk to your capital and you should only trade with money you can afford to lose. Trading Forex and CFDs may not be suitable for all investors, so please ensure that you fully understand the risks involved and seek independent advice if necessary.
Disclaimer:
The above opinions given constitute general market commentary, and do not constitute the opinion or advice of IC Markets or any form of personal or investment advice.
Any opinions, news, research, analyses, prices, other information, or links to third-party sites contained on this website are provided on an "as-is" basis, are intended only to be informative, is not an advice nor a recommendation, nor research, or a record of our trading prices, or an offer of, or solicitation for a transaction in any financial instrument and thus should not be treated as such. The information provided does not involve any specific investment objectives, financial situation and needs of any specific person who may receive it. Please be aware, that past performance is not a reliable indicator of future performance and/or results. Past Performance or Forward-looking scenarios based upon the reasonable beliefs of the third-party provider are not a guarantee of future performance. Actual results may differ materially from those anticipated in forward-looking or past performance statements. IC Markets makes no representation or warranty and assumes no liability as to the accuracy or completeness of the information provided, nor any loss arising from any investment based on a recommendation, forecast or any information supplied by any third-party.

GBP/CAD Trading plan (long position)✅ GBP/CAD Trading Plan (Long Position)
Strategy: Reversal Trade + Break of Trendline
Timeframe: 4H
Date: April 13, 2025
Pair: GBP/CAD (British Pound / Canadian Dollar)
Platform: OANDA (via TradingView)
🔍 Market Insight
• The pair has been in a strong downtrend.
• Price is now:
• Bouncing off a clearly marked support zone (~1.8050–1.8100).
• Broke a descending trendline, suggesting a shift in momentum.
• Formed multiple bullish wicks and a bullish engulfing pattern near support.
• BBandLE (buy entry signal) confirms buying pressure.
🎯 Trade Entry
• Entry Price: Around 1.8140
• Reason for Entry:
• Bounce off strong demand zone (support)
• Bullish momentum shift after a trendline break
• Price showing higher lows forming at support
• Clean risk-to-reward zone mapped out
📉 Stop-Loss (SL)
• SL Price: 1.8045
• Risk: ~95 pips
• Justification:
• SL placed below the rejection wicks and structure low
• Gives trade room in case of volatility or retests
📈 Take-Profit (TP)
• TP1: 1.8300
• Early resistance and previous structure
• Take 50% off here and move SL to breakeven
• TP2: 1.8680
• Final target at the previous swing high/resistance zone
📊 Risk-to-Reward Ratio (RRR)
• TP1 RRR: ~1:1.7
• TP2 RRR: ~1:5.5
• Overall trade has excellent reward potential with tight risk
🧠 Trade Management
• Monitor price action at 1.8300 zone
• If bullish momentum continues strongly, you can trail SL and ride the wave
• If price stalls or prints reversal signals, secure gains early
⚠️ Risks
• GBP or CAD economic data/news may cause volatility
• Oil price surges could strengthen CAD unexpectedly
• Failure to hold 1.8050 invalidates this reversal idea
🛠️ Contingency Plan
• If price returns to 1.8050:
• Watch for bullish rejection patterns again for possible re-entry
• If price closes below 1.8040, exit and wait for a fresh setup
📅 Time Horizon
• Swing Position: Hold for 3–7 trading days
• Adjust if fundamentals or price action changes

GBPCAD BUY📉 GBPCAD: Clean Break of 1.80, But No Need to Rush In! 🧠
I’ve tried to keep this analysis as simple as possible:
🔹 A major ascending trendline that’s been respected for a while.
🔹 A clear breakout of the 1.8000 zone, which has already been retested.
➡️ Now the real question is: Are we late for a precise entry? 🤔
💡 In this kind of setup, patience is key. Let’s monitor the pair closely and wait for a clear confirmation before jumping in.
📊 Stay sharp and good luck, traders!

GBPCAD Elliott Wave AnalysisHello friends
In the GBPCAD currency pair, we are witnessing the formation of a 5-wave pattern or a zigzag.
Our hypothesis is the formation of a 5-wave pattern.
Waves 1 to 4 have formed. It is currently in the support range.
This support range is formed by the collision of static and dynamic supports, which is relatively reliable, and the price has also corrected by 61.8% Fibonacci.
Now we expect the price to grow, and the limits of wave 5 are indicated in the figure.
The first target is 1.8800 and the second target is 1.9200. The third target is far from expected, but not impossible.
Also consider the stop loss below wave 1.
Be successful and profitable.

GBPCAD 10/04/2025Weekly:
-Bullish market structure.
-OB could create a reaction to the upside.
-Order flow leg.
Daily:
-Bullish M pattern.
-FVG.
-Liquidity sweep.
4H:
-Bullish M pattern.
-Inverse H&S pattern.
-IC.

GBPCAD bearish continuation below 1.8440Market Sentiment:
The prevailing trend for GBPCAD remains bearish, with the recent price action appearing to be an oversold bounce rather than a sustained recovery.
Key Levels:
Resistance: 1.8440 (Previous consolidation zone)
Support Levels: 1.8050 followed by 1.7980 and 1.7870
Potential Scenarios:
Bearish Continuation: If GBPCAD fails to break above1.8440 and faces rejection, it could resume its downtrend, targeting 1.8040 initially, followed by 1.7980 and 1.7870 over the longer term.
Bullish Breakout: A confirmed breakout and daily close above 1.8440 would shift the sentiment bullish, paving the way for a rally toward 1.8500 and potentially 1.8570
Conclusion:
GBPCAD remains in a bearish structure unless a breakout above 1.8440 is confirmed. Until then, price action suggests that any rally is likely to be a short-term relief within a broader downtrend.
This communication is for informational purposes only and should not be viewed as any form of recommendation as to a particular course of action or as investment advice. It is not intended as an offer or solicitation for the purchase or sale of any financial instrument or as an official confirmation of any transaction. Opinions, estimates and assumptions expressed herein are made as of the date of this communication and are subject to change without notice. This communication has been prepared based upon information, including market prices, data and other information, believed to be reliable; however, Trade Nation does not warrant its completeness or accuracy. All market prices and market data contained in or attached to this communication are indicative and subject to change without notice.

GBPCAD: Long Signal Explained
GBPCAD
- Classic bullish setup
- Our team expects bullish continuation
SUGGESTED TRADE:
Swing Trade
Long GBPCAD
Entry Point - 1.8200
Stop Loss - 1.8094
Take Profit - 1.8372
Our Risk - 1%
Start protection of your profits from lower levels
Disclosure: I am part of Trade Nation's Influencer program and receive a monthly fee for using their TradingView charts in my analysis.
❤️ Please, support our work with like & comment! ❤️

GBPCAD- Buy IdeaGBPCAD has formed a bullish divergence at key support levels at the 4H and 1H time frames. Look to buy if it breaks above the previous LH and retraces back to the resistance-turned support level, as shown in the chart.

LONG GBP/CAD 4H Investment Opportunity
Hello, I am Trader Andrea Russo and today I want to share with you an interesting LONG investment opportunity on GBP/CAD. We are on a 4-hour (4H) chart, and several technical indicators are highlighting an increase in bullish pressure. Oversold signals and the recovery of momentum suggest a potential reversal to the upside, making this configuration particularly promising.
Investment Setup:
Entry Price: 1.812
Signal: BUY with Target Price set at 1.835 (TP: 1.27%).
Stop Loss: set at 1.8033 (SL: 0.48%).
Thanks to our SwipeUP Reversal Radar Multi-Timeframe Alerts indicator, we were able to identify:
The oversold zone, which suggested the opportunity for a rebound.
The Break Point, which confirmed the beginning of a potential reversal to the upside.
The entry point, to maximize the risk/reward ratio.
As a Target point, we have chosen the area highlighted in the photo, which is the first important resistance that in our opinion represents a key level where the price could slow down.
👉 This setup takes advantage of the current bullish pressure and offers a favorable risk/reward ratio. I encourage you to monitor this setup and implement solid risk management in your trading plan.
Happy trading everyone! 📈

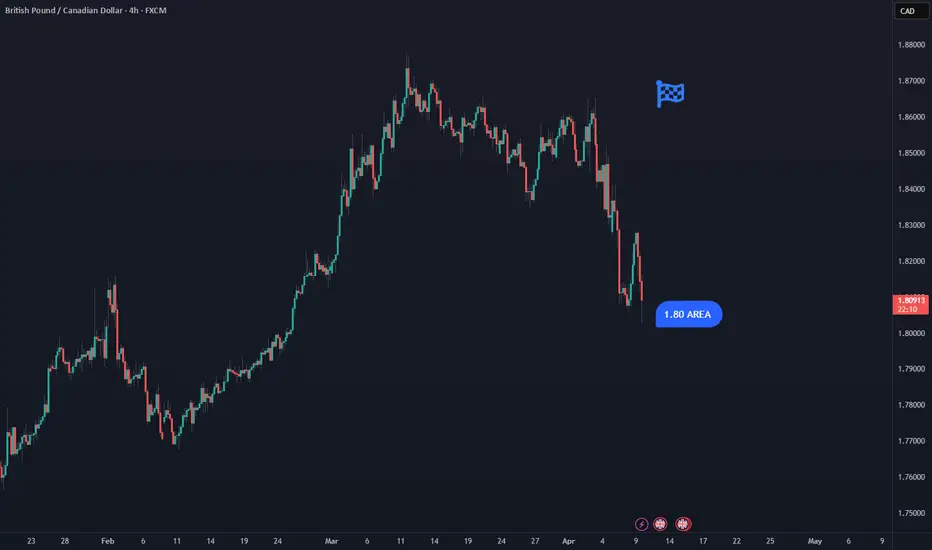
GBP CAD swing ideaPossible swing opportunity around 1.80-1.81 area with 1st target at 1.83 and then 1.87-1.88. We'll see.
GBP/CAD At Interesting Area To Sell It And Get 250 Pips !This Is An Educational + Analytic Content That Will Teach Why And How To Enter A Trade
Make Sure You Watch The Price Action Closely In Each Analysis As This Is A Very Important Part Of Our Method
Disclaimer : This Analysis Can Change At Anytime Without Notice And It Is Only For The Purpose Of Assisting Traders To Make Independent Investments Decisions.

Tyree Thomas Jr Buy GBP/CAD Bias 4/8/25I looked at GBP/CAD and checked the pair with the key points of my trading strategy. My trade idea is to enter a buy when the pair breaks out of the Fibonacci Retracement tool and then take profit at the first green line of the Fibonacci Extension tool. My name is Tyree Thomas Jr, and this is my bias of GBP/CAD for a buy.
