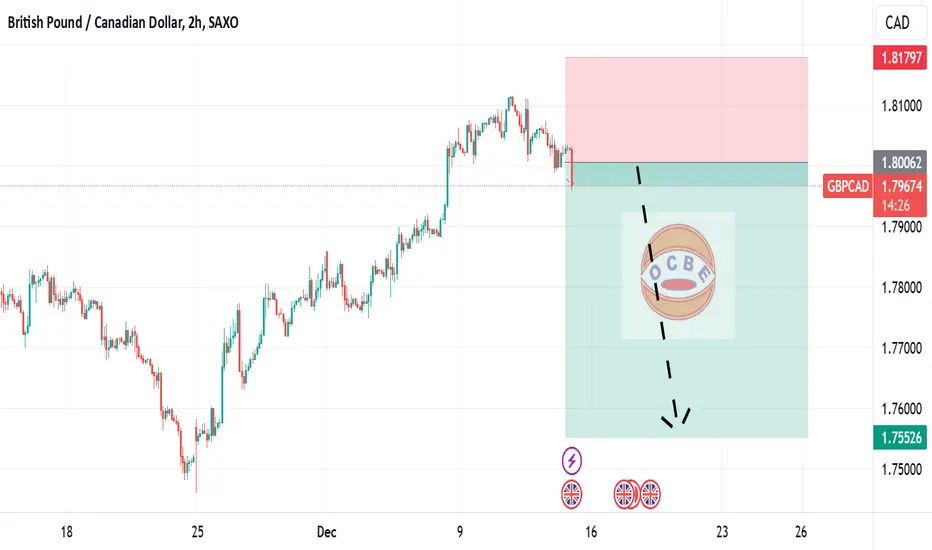
Bearish drop?GBP/CAD is reacting off the pivot which is a pullback support and could drop to the 1st support which acts as a pullback support that is slightly above the 50% Fibonacci retracement.
Pivot: 1.7999
1st Support: 1.7901
1st Resistance: 1.8107
Risk Warning:
Trading Forex and CFDs carries a high level of risk to your capital and you should only trade with money you can afford to lose. Trading Forex and CFDs may not be suitable for all investors, so please ensure that you fully understand the risks involved and seek independent advice if necessary.
Disclaimer:
The above opinions given constitute general market commentary, and do not constitute the opinion or advice of IC Markets or any form of personal or investment advice.
Any opinions, news, research, analyses, prices, other information, or links to third-party sites contained on this website are provided on an "as-is" basis, are intended only to be informative, is not an advice nor a recommendation, nor research, or a record of our trading prices, or an offer of, or solicitation for a transaction in any financial instrument and thus should not be treated as such. The information provided does not involve any specific investment objectives, financial situation and needs of any specific person who may receive it. Please be aware, that past performance is not a reliable indicator of future performance and/or results. Past Performance or Forward-looking scenarios based upon the reasonable beliefs of the third-party provider are not a guarantee of future performance. Actual results may differ materially from those anticipated in forward-looking or past performance statements. IC Markets makes no representation or warranty and assumes no liability as to the accuracy or completeness of the information provided, nor any loss arising from any investment based on a recommendation, forecast or any information supplied by any third-party.
GBPCAD trade ideas

1st Empathy Strat Revised 12/12/24Last strategy for GBP/CAD:
CAD looks like a stable market to invest in due to the momentum gaining around the currency, the oversold levels and currently low declined volatility makes it perfect for significant inclines due to unstable bearish buying power. with a economic counter to GBP's interest rate decisions week of DEC 8, and the volatility gaining around the coin, plus the bearish sustaining momentum sell GBP buy Cad.
Strategy:
Final Tp = 2.5% Round 1.75745
SMA = 1.3% Avg SMA = 0.60% retracment = 0.35%/0.70%
12/11/24
Note
Strategy struggling pulled out of market readjusting to market situation
new revised Strategy 12/12/24:
since this strategy had a hard time on the decline after researching GBP market expect inclined push on fx securities due to lower prices in historical data of fx securities, plus the US PPI & natural gas fluke expect gas securities to fluke due to electric switch-over globally for sometime.
CAD tech tariffs will cause dollar volatility for now expect GBP to rally

GBPCAD - Long from bullish OB !!Hello traders!
‼️ This is my perspective on GBPCAD.
Technical analysis: Here we are in a bullish market structure from 4H timeframe perspective, so I look for a long. I expect price to continue the retracement to fill that huge imbalance and then to reject from bullish OB + institutional big figure 1.79000.
Like, comment and subscribe to be in touch with my content!


GBPCAD Will Explode! BUY!
My dear followers,
This is my opinion on the GBPCAD next move:
The asset is approaching an important pivot point 1.8058
Bias - Bullish
Technical Indicators: Supper Trend generates a clear long signal while Pivot Point HL is currently determining the overall Bullish trend of the market.
Goal - 1.8076
About Used Indicators:
For more efficient signals, super-trend is used in combination with other indicators like Pivot Points.
———————————
WISH YOU ALL LUCK

Gbp/cad entry on buyTrend is up
Trend is oversold
Highee timeframe is up
It has made a double bottom
This trade would is a high probability set up


#GBPCAD 1DAYGBPCAD Daily Analysis
The GBPCAD pair has broken below a key trendline on the daily chart, signaling potential bearish momentum. After the breakdown, the price is now retesting the trendline from below, which could act as resistance. This setup presents a potential sell opportunity if the price faces rejection at the retest level.
Technical Outlook:
Pattern: Trendline Breakdown and Retest
Forecast:** Bearish (Sell Opportunity)
Entry Strategy:** Enter a sell position if the price confirms rejection at the retested trendline with bearish price action signals.
Traders should look for confirmation such as bearish candlestick patterns (e.g., shooting star or bearish engulfing) or indicators like RSI indicating bearish divergence. Proper risk management is crucial, with stop-loss orders placed above the retested trendline and profit targets set at the next support zones.

GBPCAD-SELL strategy 12-hourly chartThe pair has moved a little lower, but is held up by the cross selling of GBPAUD, i.e. AUDCAD moved strongly higher due to ecenomic data release from Australia, which were positive outcomes.
For now, the strategy remains in SELL mode due to stochastic, SMI and MACD etc suggesting lower levels, and we are still overbought (reduced).
Strategy SELL @ 1.80550-1.8100 for a move to 1.7917 and lower.

GBPCAD at trend reversalGBPCAD in bullish trend, printing a rising channel expected trend reversal from bullish to bearish. RSI diversion can be seen

Bearish drop off multi swing high resistance?GBP/CHF is reacting off the resistance level which is a multi swing high resistance and could drop from this level to our take profit.
Entry: 1.8094
Why we like it:
There is a multi swing high resistance level.
Stop loss: 1.8242
Why we lik eit:
There is a resistance level at the 127.2% Fibonacci extension.
Take profit: 1.7912
Why we like it:
There is a pullback support that is slightly above the 38.2% Fibonacci retracement.
Enjoying your TradingView experience? Review us!
Please be advised that the information presented on TradingView is provided to Vantage (‘Vantage Global Limited’, ‘we’) by a third-party provider (‘Everest Fortune Group’). Please be reminded that you are solely responsible for the trading decisions on your account. There is a very high degree of risk involved in trading. Any information and/or content is intended entirely for research, educational and informational purposes only and does not constitute investment or consultation advice or investment strategy. The information is not tailored to the investment needs of any specific person and therefore does not involve a consideration of any of the investment objectives, financial situation or needs of any viewer that may receive it. Kindly also note that past performance is not a reliable indicator of future results. Actual results may differ materially from those anticipated in forward-looking or past performance statements. We assume no liability as to the accuracy or completeness of any of the information and/or content provided herein and the Company cannot be held responsible for any omission, mistake nor for any loss or damage including without limitation to any loss of profit which may arise from reliance on any information supplied by Everest Fortune Group.

GBPCAD - 1H - Bearish ReversalFollowing are the factors involved in the Bearish Reversal:
1 Bearish Divergence
2. Double Top Pattern

GBPCAD_SELLThe chart you provided for GBPCAD appears to present a sell trade setup. Here's the analysis:
Observations:
1. **Resistance Zone:**
- Price is testing a significant resistance level near **1.8109-1.8173**.
- The area has acted as resistance in the past, rejecting price movements multiple times.
2. **Bearish Rejection:**
- A potential reversal is hinted as price shows signs of struggle to break above the resistance zone.
- If bearish candlestick patterns form here (e.g., shooting star, engulfing), it strengthens the sell bias.
3. **Risk-Reward Ratio:**
- The trade setup indicates a **Risk/Reward Ratio of 4.59**, suggesting a favorable potential return compared to the risk.
- The **stop-loss** is placed slightly above the resistance at **1.8173**, providing a buffer for false breakouts.
- The **take-profit** is set around **1.7703**, near a previous support level.
4. **Trend Analysis:**
- While the recent trend shows an upward move, the sell setup suggests a correction or reversal if the resistance holds.
5. **Confluence:**
- The 50-day moving average (blue line) acts as dynamic support in the middle of the trade range, which may influence price behavior during the decline.
### Potential Scenarios:
- **Bearish Confirmation:**
Look for a clear rejection or bearish candlestick pattern at the resistance zone before entering the trade.
- **Invalidation:**
If the price breaks and closes above the resistance zone, the bearish view may be invalidated.

GBPCADGBPCAD is in reversal mode
Bearish divergence also shown in RSI.
Market sentiment is also bearish.
We sell at CMP

GBPCAD Wave Analysis 11 December 2024
- GBPCAD reversed from strong resistance zone
- Likely to fall to support level 1.8000
GBPCAD currency pair recently reversed down from the strong resistance zone located at the intersection of the upper daily Bollinger Band and the key resistance level 1.8100, which has been reversing the pair from September.
The downward reversal from this resistance zone stopped the C-wave of the previous ABC correction (B) from the end of November.
Given the strength of the resistance level 1.8100, GBPCAD currency pair can be expected to correct down to the next round support level 1.8000.

GBPCAD-SELL strategy 12-hourly chart The pair is way overbought, and the real correction will likely be tonight after BOC decision. we could have a rate cut, as expected, or maybe not, and statements by them, may create CAD correction.
Strategy SELL @ 1.8070-1.8110 range and take profit near 1.7878 (or first stop at 1.7965).

Bearish drop?GBP/CAD is reacting off the pivot and could drop to the 23.6% Fibonacci support.
Pivot: 1.8113
1st Support: 1.7997
1st Resistance: 1.8243
Risk Warning:
Trading Forex and CFDs carries a high level of risk to your capital and you should only trade with money you can afford to lose. Trading Forex and CFDs may not be suitable for all investors, so please ensure that you fully understand the risks involved and seek independent advice if necessary.
Disclaimer:
The above opinions given constitute general market commentary, and do not constitute the opinion or advice of IC Markets or any form of personal or investment advice.
Any opinions, news, research, analyses, prices, other information, or links to third-party sites contained on this website are provided on an "as-is" basis, are intended only to be informative, is not an advice nor a recommendation, nor research, or a record of our trading prices, or an offer of, or solicitation for a transaction in any financial instrument and thus should not be treated as such. The information provided does not involve any specific investment objectives, financial situation and needs of any specific person who may receive it. Please be aware, that past performance is not a reliable indicator of future performance and/or results. Past Performance or Forward-looking scenarios based upon the reasonable beliefs of the third-party provider are not a guarantee of future performance. Actual results may differ materially from those anticipated in forward-looking or past performance statements. IC Markets makes no representation or warranty and assumes no liability as to the accuracy or completeness of the information provided, nor any loss arising from any investment based on a recommendation, forecast or any information supplied by any third-party.


+180/+360 pips GBPCAD Swing trade setup🔸Hello traders, let's review the H4 chart for GBPCAD today. Trading
near premium prices of the multiweek range, closing in on heavy S/R
Currently risk/reward is shifting in bears favor, so it's recommended
to look for sell side setups in this market.
🔸Bearish OB / fresh liquidity set at 8095/8125. Price structure
indicates potential incoming reversal once we trigger the OB.
🔸Recommended strategy for GBPCAD traders: focus on short selling any rips/rallies near OB 8095/8125 price is currently trading near premium levels and is maxed out already, limited upside. TP1 bears +180 TP2 bears +360 pips final exit 7750 keep in mind this is a swing trade setup so naturally will take more time to complete / hit both targets. good luck traders!
🎁Please hit the like button and
🎁Leave a comment to support our team!
RISK DISCLAIMER:
Trading Futures , Forex, CFDs and Stocks involves a risk of loss.
Please consider carefully if such trading is appropriate for you.
Past performance is not indicative of future results.
Always limit your leverage and use tight stop loss.

GBPCAD - 4hrs ( Sell Trade Target Range 180 PIP ) Pair Name :GBP/CAD
Time Frame : 4hrs Chart / Close
Scale Type : Large Scale
------
Key Technical / Direction ( Short )
———————————
Bearish Reversal
1.80700 Area
Reasons
- Major Turn level
- Visible range Hvn
- Choch Zone
- Fibo Golden
- P / Q H
Bullish Reversal
1.79000 Area
Reasons
- Major Turn level
- Visible range Lvn
- Pattern Target
- Fibo Golden
- choch Zone

GBPCAD Will Move Lower! Short!
Take a look at our analysis for GBPCAD.
Time Frame: 9h
Current Trend: Bearish
Sentiment: Overbought (based on 7-period RSI)
Forecast: Bearish
The market is approaching a significant resistance area 1.807.
Due to the fact that we see a positive bearish reaction from the underlined area, I strongly believe that sellers will manage to push the price all the way down to 1.791 level.
P.S
We determine oversold/overbought condition with RSI indicator.
When it drops below 30 - the market is considered to be oversold.
When it bounces above 70 - the market is considered to be overbought.
Like and subscribe and comment my ideas if you enjoy them!
