85% of Traders Are Wrong on GBPCAD - I'm Going Short!📊 COT Analysis
GBP:
Non-Commercials remain net long with 106,282 longs vs 63,425 shorts. However, long positions are decreasing (-4,794) while shorts are slightly increasing (+3,983), suggesting profit-taking or a potential shift in sentiment.
Commercials are strongly net short (35,707 longs vs 87,770 shorts), with a significant reduction in both longs (-24,958) and shorts (-33,457) — a clear reduction in overall exposure.
→ Non-Commercial positioning is still bullish, but momentum is fading.
CAD:
Non-Commercials remain heavily net short (28,154 longs vs 94,487 shorts), but notable changes are taking place: sharp increase in longs (+8,503) and a significant cut in shorts (-18,307), pointing to a possible reversal in sentiment.
Commercials are net long with a rise in both longs (+1,834) and shorts (+31,186), indicating potential hedging as expectations shift.
→ CAD strength is emerging in the COT data, supporting a potential bearish move on GBPCAD.
📈 Seasonality – June/July
GBP tends to perform poorly in June across all historical averages (-0.004 / -0.006). July shows slight positivity but is statistically insignificant.
CAD has a mildly negative June, but July is historically its strongest month (+0.006 / +0.007 on 20Y and 15Y averages).
→ Seasonal bias favors CAD strength in the June–July transition.
🧠 Retail Sentiment
Retail traders are 85% long on GBPCAD, a strong contrarian signal.
→ Such imbalance increases the odds of a correction or reversal to the downside.
→ Confirms short bias.
📉 Price Action & RSI
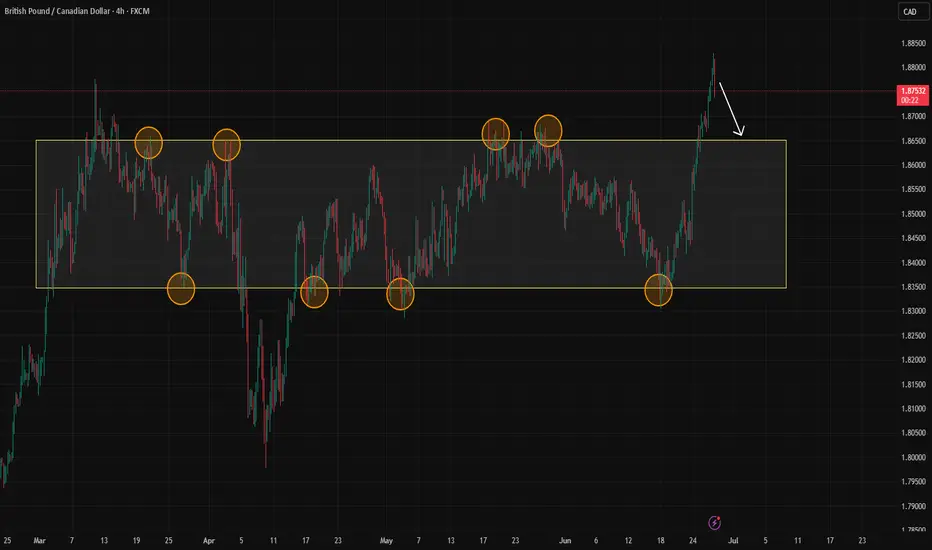
Price surged into strong resistance at 1.8779 (triple top area).
Current daily rejection + RSI in overbought territory suggest a potential swing high forming.
Natural downside target: 1.8400–1.8450 (prior structure and base of the move).
→ Ideal short setup from resistance with confirmation via bearish price action.
GBPCAD trade ideas


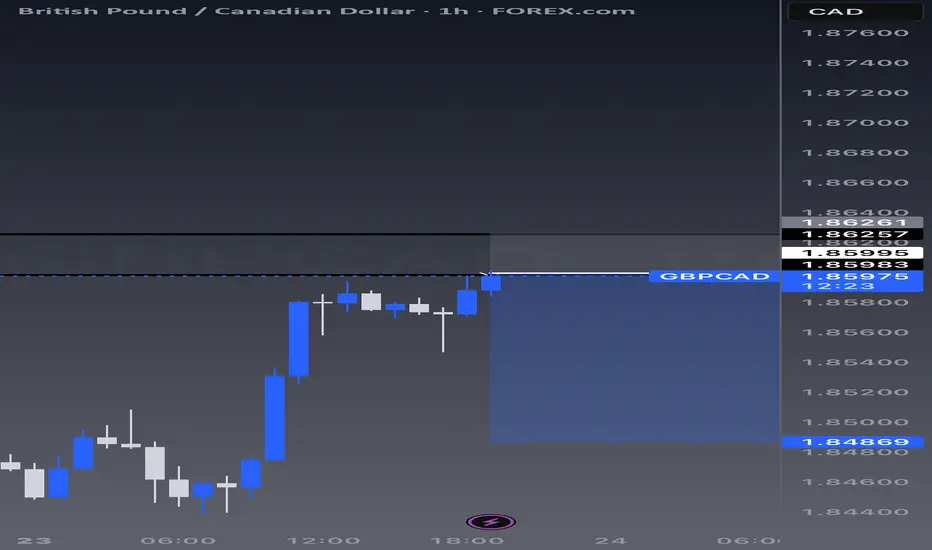
GBPCAD INTRADAY support at 1.8500The GBPCAD currency pair price action sentiment appears Bullish, supported by the current rising trend. The recent intraday price action seems to be a sideways consolidation breakout.
The key trading level is at the 1.8500 level, the previous consolidation price range. A corrective pullback from the current levels and a bullish bounce back from the 1.8500 level could target the upside resistance at 1.8890, followed by the 1.9000 and 1.9090 levels over the longer timeframe.
Alternatively, a confirmed loss of the 1.8500 support and a daily close below that level would negate the bullish outlook, opening the way for a further retracement and a retest of 1.8430 support level, followed by 1.83450 levels.
Conclusion:
As long as 1.8500 holds, the bias remains bullish, favouring continuation toward the 1.8900 zone. A confirmed break below this support would shift momentum, opening the door for a broader corrective decline.
This communication is for informational purposes only and should not be viewed as any form of recommendation as to a particular course of action or as investment advice. It is not intended as an offer or solicitation for the purchase or sale of any financial instrument or as an official confirmation of any transaction. Opinions, estimates and assumptions expressed herein are made as of the date of this communication and are subject to change without notice. This communication has been prepared based upon information, including market prices, data and other information, believed to be reliable; however, Trade Nation does not warrant its completeness or accuracy. All market prices and market data contained in or attached to this communication are indicative and subject to change without notice.

GC back to the value area high? GC has perform excess price above the value high area and currently perform sort of engulfing movement. Possible to go down and touch the value area high?
GBPCAD | Comp. Trade 05GBP is facing a selling pressure against Canadian dollar.The chart has formed an ABCD harmonic pattern as well as a bearish divergence on RSI.Both these indications are quite strong and point towards the upcoming bearish trend.

GBPCAD: Bearish Continuation & Short Signal
Our strategy, polished by years of trial and error has helped us identify what seems to be a great trading opportunity and we are here to share it with you as the time is ripe for us to sell GBPCAD.
Disclosure: I am part of Trade Nation's Influencer program and receive a monthly fee for using their TradingView charts in my analysis.
❤️ Please, support our work with like & comment! ❤️
GBPCAD | 25.06.2025SELL 1.86950 | STOP 1.87400 | TAKE 1.86350 | Itraday corrective downward price movement.

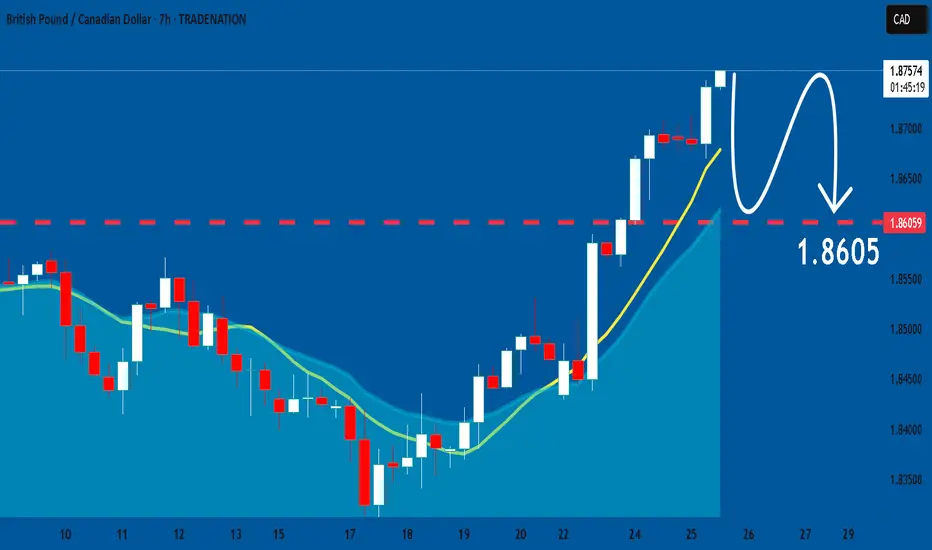
GBPCAD Will Go Down From Resistance! Short!
Please, check our technical outlook for GBPCAD.
Time Frame: 5h
Current Trend: Bearish
Sentiment: Overbought (based on 7-period RSI)
Forecast: Bearish
The price is testing a key resistance 1.868.
Taking into consideration the current market trend & overbought RSI, chances will be high to see a bearish movement to the downside at least to 1.855 level.
P.S
The term oversold refers to a condition where an asset has traded lower in price and has the potential for a price bounce.
Overbought refers to market scenarios where the instrument is traded considerably higher than its fair value. Overvaluation is caused by market sentiments when there is positive news.
Disclosure: I am part of Trade Nation's Influencer program and receive a monthly fee for using their TradingView charts in my analysis.
Like and subscribe and comment my ideas if you enjoy them!

SHOT ON GBP/CADGBP/CAD has given nice rejection from a major supply area.
There is lots of imbalance to the downside.
I will be selling GBP/CAD looking to catch 100-200 pips to the next demand zone.

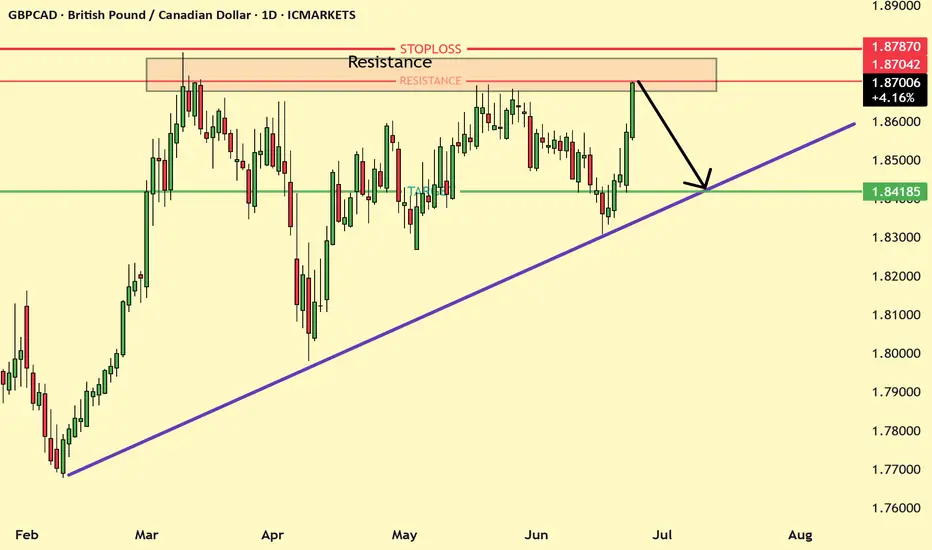
GBPCAD at Resistance areaResistance Area: Price has reached a well-tested resistance zone around 1.8700–1.8787, marked with a red shaded box. Stoploss: Positioned just above resistance at 1.87870, suggesting a short setup with defined risk.
Ready for the Long?This is a **GBP/CAD 4H chart** with a clear **bullish bias** across multiple timeframes (W, D, 12H, 6H, 4H).
### Key Points:
* **Market Structure**: Strong bullish breakout above previous resistance zones, confirming a shift in momentum.
* **Current Price**: 1.8641, just below a key resistance level at **1.8664**.
* **Projection**: Expecting a **pullback** towards the **1.8571–1.8549 Daily AOI** zone, followed by a **bullish continuation** to the upside.
* **EMAs**:
* Price is above both the **50 EMA (blue)** and **200 EMA (red)**, confirming upward momentum.
* **Volume & Liquidity Zones**:
* The breakout cleared previous liquidity, indicating strength.
* The next major resistance is untested, suggesting more room for upside after a healthy retracement.
### Summary:
GBP/CAD is in a **strong uptrend**. After a short-term correction into the Daily AOI (support), a **continuation toward new highs** is anticipated if bullish order flow continues.

GBP/CADPrice action trading is a methodology in financial markets where traders make decisions based on the actual price movements of an asset over time, rather than relying heavily on technical indicators or fundamental analysis. It involves observing and interpreting patterns and trends in price charts to predict future price movements.

GBPCAD Sell IdeaWe see price downtrending on 4hr time frame — price is coming into our 4hr bearish engulfing getting ready to test to the downside. All we need is a counter trend line to break to confirm the idea!

Technical Zones & StructureTechnical Zones & Structure
🔹 Bearish Rejection Zone (Supply Area)
Price tapped into a strong supply zone at the top blue box, aligning with trendline resistance.
Immediate reaction followed by sharp bearish candle shows potential liquidity grab and smart money sell-off.
🔹 Demand Zone
Mid-chart gray/blue zone is a key reaction area that price may retest before confirming further downside.
Market Structure
I’ve drawn a rising wedge, which price has already broken down from = bearish reversal signal.
Pullback anticipated into the broken structure zone (gray) → potential entry zone for short.
Trade Idea (as visualized)
Sell Setup Plan:
✅ Ideal Entry: Retest of broken wedge / demand-turned-supply (~1.84750–1.84900)
🎯 Target 1: 1.84300 zone
🎯 Target 2: 1.83500 (bottom demand zone)
🛑 SL: Above previous high / upper blue supply (~1.85300+)
SET and FORGET

GBPCAD : SELL SETUP FORMED IN 4RSell @ 1.8460 or below
Target : 1.8225, 1.8000
Stoploss : 1.8560
Sell breakout and pullback done. Short entered at 1.8460

GBPCAD CONTINUING DOWNTREND STRUCTUREGBPCAD CONTINUING DOWNTREND STRUCTURE IN 4H TIME FRAME.
Price forming Lower Lows & Lower Highs.
After secondary trend market started forming bearish candles.
Showing signal of seller's entry in the market.
Market may remain bearish in upcoming trading sessions.
On lower side market may hit the target of 1.83300.
On higher side 1.85750 may act as a important resistance level for the market.

Trade Idea: Sell GBPCAD (Short-Term Exhaustion Setup)### **📉 Trade Idea: Sell GBPCAD (Short-Term Exhaustion Setup)**
**Bias:** 🔻 Short-Term Bearish | 🧭 Medium-Term Neutral
**Goal:** Catch the dip before trend resumes or price flattens
---
### **💡 Why Sell?**
**🇬🇧 GBP:**
* Sluggish data 😴
* BoE expected to cut 🔻
* Traders losing interest in the pound
**🇨🇦 CAD:**
* Oil holding strong = CAD backed 🛢️
* Inflation still sticky = no rush to ease 🧨
* CAD showing quiet strength vs peers
---
### **📊 Technical Feel (Not Exact):**
* **Momentum looks tired:** Price has pushed up a few times but keeps slowing down 🐌
* **Structure stretched:** Feels like it's gone too far too fast — a breather makes sense 🧘
* **Buyers losing steam:** Recent pushes feel weaker — candles getting smaller, follow-through fading 🔍
* **Volume thinning:** Less excitement at these highs — fewer traders chasing 🚶♂️
* **Indicators turning soft:** Momentum tools like RSI/MACD feel heavy — not reversing, just sagging 🧯
* **Drift from moving averages:** Price looks disconnected from its base — likely to snap back 👣
---
### **⚠️ Invalidation:**
> If the move gathers fresh energy and breaks recent highs with speed — bulls still in charge ⚡
---
### **🎯 Summary:**
GBP feels overextended, CAD quietly strong.
Charts aren’t screaming sell — but whispering “this move’s tired.”
Short-term dip likely before the next decision point.
---
Let me know if you'd like a one-liner caption or want this fitted into a trading journal style!

GBPCAD: Expecting Bearish Movement! Here is Why:
Balance of buyers and sellers on the GBPCAD pair, that is best felt when all the timeframes are analyzed properly is shifting in favor of the sellers, therefore is it only natural that we go short on the pair.
Disclosure: I am part of Trade Nation's Influencer program and receive a monthly fee for using their TradingView charts in my analysis.
❤️ Please, support our work with like & comment! ❤️

GBPCAD PREDICTIONprice has returned to key weekly/daily area and has shifterd in the 4HTF indicating a potential move to the upside once the market has returned to the NF then and shift in 30min then bullish rally continues to the weekly/daily level

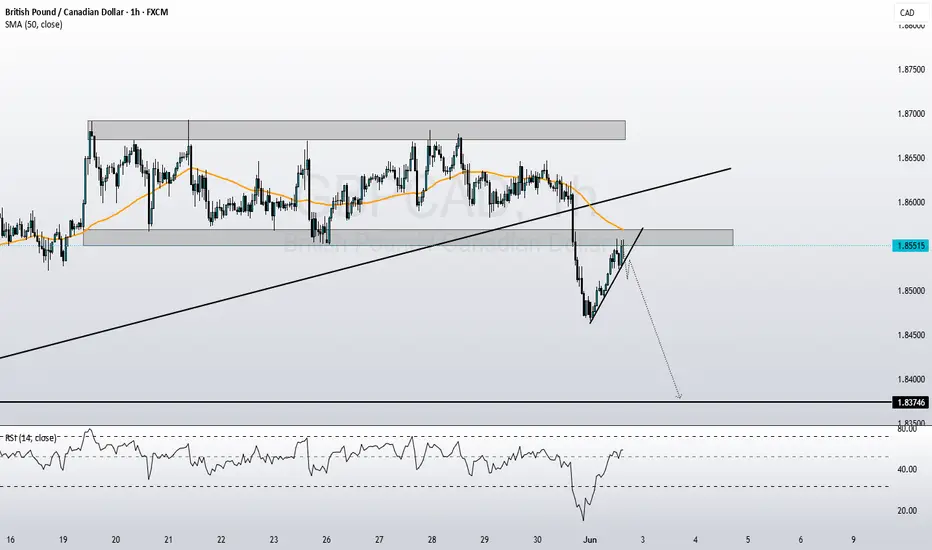
Lingrid | GBPCAD Bearish Opportunity at Confluence ZoneFX:GBPCAD is rebounding from the bottom of its support zone, forming a rounded recovery toward a confluence of resistance levels near 1.8507. Price is nearing the intersection of a downtrend line and a horizontal key level, creating a high-risk rejection zone. A failure to break above this confluence could initiate a bearish swing toward 1.8430 or lower.
📈 Key Levels
Buy zone: 1.8430–1.8460
Sell trigger: bearish rejection at 1.8507
Target: 1.8305
Buy trigger: strong close above 1.8576
💡 Risks
Breaking 1.8507 could lead to extended upside
Economic news or CAD volatility may disrupt pattern
Price may stall in the resistance cluster before choosing direction
Traders, if you liked this idea or if you have your own opinion about it, write in the comments. I will be glad 👩💻

GBPCAD SHORTMarket structure bearish on HTFS DH
entry at Daily AOi
Weekly Rejection at AOi
Daily Rejection at AOi
Daily EMA retest
Previous Structure point Daily
Around Psychological Level 1.85000
H4 EMA retest
H4 Candlestick rejection
Rejection from Previous structure
Levels 3.77
Entry 95%
REMEMBER : Trading is a Game Of Probability
: Manage Your Risk
: Be Patient
: Every Moment Is Unique
: Rinse, Wash, Repeat!
: Christ is King.

GBPCAD SHORTPrice broke the structure with impulse movement, IF the price breaks the correction then i expect to moving further to the downside.