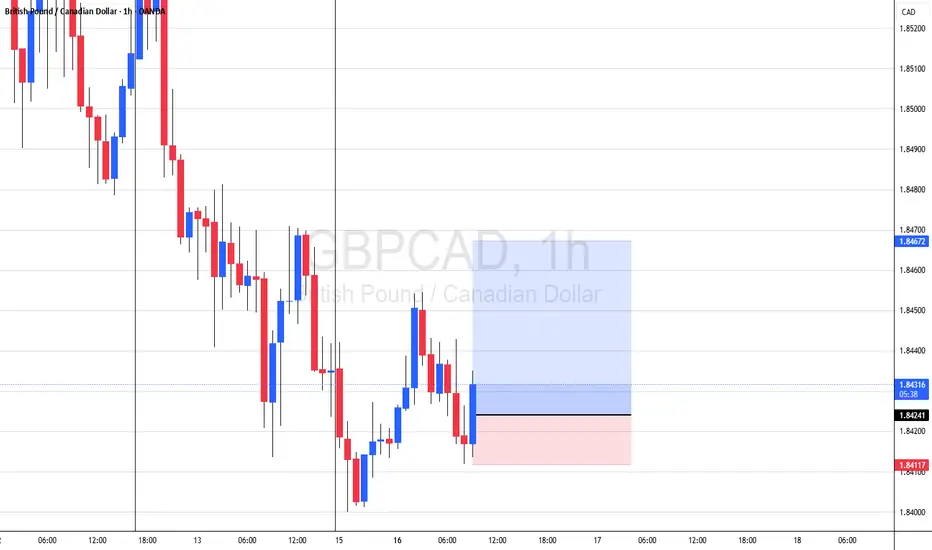
GBP_CAD RISKY LONG|
✅GBP_CAD is set to retest a
Strong support level below at 1.8380
After trading in a local downtrend for some time
Which makes a bullish rebound a likely scenario
With the target being a local resistance above at 1.8426
LONG🚀
✅Like and subscribe to never miss a new idea!✅
Disclosure: I am part of Trade Nation's Influencer program and receive a monthly fee for using their TradingView charts in my analysis.
GBPCAD trade ideas

GBPCAD shortGBPCAD is now net short on the regression break.
I am considering my EA options on this pair.

GBPCAD Technical Analysis! BUY!
My dear friends,
GBPCAD looks like it will make a good move, and here are the details:
The market is trading on 1.8449 pivot level.
Bias - Bullish
Technical Indicators: Supper Trend generates a clear long signal while Pivot Point HL is currently determining the overall Bullish trend of the market.
Goal - 1.8496
About Used Indicators:
Pivot points are a great way to identify areas of support and resistance, but they work best when combined with other kinds of technical analysis
Disclosure: I am part of Trade Nation's Influencer program and receive a monthly fee for using their TradingView charts in my analysis.
———————————
WISH YOU ALL LUCK


GBP/CAD Made A New Wave , Golden Place To Sell Very Clear !Here is my opinion on GBP/CAD 2H Chart . we have finally a good wave and the price made a new down trendline and moving very good , now i put my fibo indicator and i`m waiting the price to retest a broken support and also 71% fib level and give me any bearish price action and then we can enter a sell trade to create new lower low .

GBPCAD sellopened under previous consolidation and value area
lower prices are accepted
swiped out asia session on H1

GBPCAD: Pullback After a Trap 🇬🇧🇨🇦
There is a high chance that GBPCAD will pull back
from the underlined support.
The price started to grow after a false violation of that and a confirmed bearish trap.
Goal - 1.8458
❤️Please, support my work with like, thank you!❤️
I am part of Trade Nation's Influencer program and receive a monthly fee for using their TradingView charts in my analysis.

GBPCAD SELL TRADE PLAN🔥 GBP/CAD CONDITIONAL SELL PLAN 🔥
📅 Date: June 16, 2025
📋 TRADE PLAN OVERVIEW
Item Value
Type Swing
Direction 📉 Sell
Confidence ⭐⭐⭐⭐ 88%
R:R 3.8:1
Status ⚠️ Conditional – Awaiting Entry Tap & Confirmation
🧠 Guidance: Primary swing setup. Risk 1.00% max. If tapped, only enter with confirmation (engulfing / iBOS / volume spike).
📈 MARKET BIAS & TRADE TYPE
Section Details
Bias Bearish 📉
Type Breaker Block Reversal / CHoCH Swing Sell
🔰 CONFIDENCE LEVEL
Total: 88% (⭐⭐⭐⭐)
Confluence Element Weight
D1 CHoCH + Liquidity Below 25%
H4 Supply + FVG Zone 20%
H1 Weakness + Internal BOS 18%
Session Trap Potential 10%
No Macro Conflict (CAD strength) 15%
📍 ENTRY ZONES
Type Range Description
🟥 Primary Sell 1.8500–1.8530 H4 OB + FVG + Session Trap
🟧 Secondary Sell 1.8560–1.8585 Liquidity Inducement Zone (High RR)
❗ STOP LOSS
SL: 1.8588 (Above OB wick + 1H ATR)
Dynamic ATR Logic Applied (Normal VIX → 1x H1 ATR)
🎯 TAKE PROFITS
TP Level Target Details
TP1 1.8420 Internal liquidity zone
TP2 1.8320 Breaker flip + H4 OB break
TP3 1.8210 Full liquidity cleanout
📏 RISK:REWARD
TP1: 2.3:1
TP2: 3.8:1 ✅
TP3: 5.6:1 🚀
🧠 MANAGEMENT STRATEGY
🔹 Risk: 1% of account (swing)
🔹 TP1: 50% off + BE (+10pips)
🔹 TP2: 30% off
🔹 TP3: Trail final 20%
🔹 Adjust SL if macro shift only (BOC, CPI)
⚠️ CONFIRMATION CRITERIA
✅ Only Enter If:
H1/H4 Bearish Engulfing or OB Flip
Volume Spike or Sweep @ 1.8500
iBOS or SMT Divergence
🛑 No confirmation = no entry.
⏳ VALIDITY WINDOW
Valid until: June 18, 2025 – 22:00 UTC
Auto-expire if zone untapped or invalidation
❌ INVALIDATION
❌ H4 BOS above 1.8600
❌ CAD macro sentiment flips
❌ No rejection / liquidity sweep at OB
🌐 FUNDAMENTAL SNAPSHOT
Element Value
Retail Sentiment GBP Longs → High %
DXY Neutral
CAD Strength Rising oil → CAD support
COT (GBP) Bearish bias continuing
Sentiment Score ✅ +7/10
📋 FINAL TRADE SUMMARY
We are targeting a retest of bearish supply at 1.8500–1.8530
If price rejects w/ confirmation, sell toward liquidity below 1.8300
Avoid early entry — structure + timing + volume needed
Blueprint-compliant swing play, clean OB, and FVG overlap
🧠 Tactical Summary:
"Wait for price to enter 1.8500–1.8530 and trigger confirmation. Do not preempt. This is a sniper reversal off OB + liquidity sweep."
Patience = Power.

Potential Sell Opportunity on GBPCADReasons I think this pair will fall:
-Price printed a lower high on a confirmed trend line on the H4 which is a sign of momentum loss.
- RSI Daily reading below 50 line
- Bearish RSI Divergence on H4
What do you think?

GBPCAD What Next? BUY!
My dear subscribers,
GBPCAD looks like it will make a good move, and here are the details:
The market is trading on 1.8440 pivot level.
Bias - Bullish
Technical Indicators: Both Super Trend & Pivot HL indicate a highly probable Bullish continuation.
Target - 1.8496
About Used Indicators:
The average true range (ATR) plays an important role in 'Supertrend' as the indicator uses ATR to calculate its value. The ATR indicator signals the degree of price volatility.
Disclosure: I am part of Trade Nation's Influencer program and receive a monthly fee for using their TradingView charts in my analysis.
———————————
WISH YOU ALL LUCK

GBPCAD Daily – Full Technical & FundamentalANALYST´S NOTE: THIS TRADE REVIEW TEXT IS GENERATED BY SCREENSHOT READING FROM CHATGPT - Tommi Za
🧠 Fundamental Overview – GBP vs CAD (Mid-May 2025)
🇬🇧 GBP – Bullish Bias
The Bank of England remains cautious on inflation, with strong wage growth and service sector resilience.
The UK economy is avoiding recession; GDP data is stabilizing.
Risk sentiment supports GBP as a relatively strong currency in a weak global macro environment.
🇨🇦 CAD – Bearish to Neutral Bias
The Bank of Canada is likely done with rate hikes; some policymakers hint at possible easing.
Oil prices, a major CAD driver, have pulled back due to slower global demand and lower Chinese growth.
CAD is losing strength, particularly against currencies with stronger monetary policy expectations.
→ Conclusion: Fundamental Tailwind Favors GBP Long
📊 Technical Breakdown
⚙️ Market Structure & Trend
The market is in a strong uptrend within a wide ascending channel.
Recent breakout from a descending wedge pattern indicates potential for continued bullish momentum.
Higher lows and higher highs structure is intact.
🧩 Key Technical Confluences
Price recently broke above wedge resistance and is now consolidating just above it.
Strong multi-level support confluence forms at the breakout retest:
38.2% Fib retracement
Lower wedge trendline
Ascending channel support
EMA 50 (1.8389)
Dynamic support from the EMA 200 (1.8038) remains intact, reinforcing bullish strength.
The area marked for potential entry also overlaps with Fair Value Gap (FVG) zone and bullish order block.
📈 Indicator Readings
RSI at ~56: neutral-bullish territory. No signs of exhaustion or divergence.
Momentum is building, but still early — suggesting opportunity before acceleration.
🔍 Execution Plan
Wait for price to revisit the confluence zone.
Look for Sign of Strength (SOS) on lower timeframes (bullish BOS, engulfing, or trendline breakout).
Do not buy blindly — confirm market intent at the zone.
ANALYST´S NOTE 2: CHATGPT RATINGS FOR THE TRADE SETUP:
✅ Summary Rating
Category Evaluation
Trend Bullish across all timeframes (D, H4, W)
Structure Clean breakout + retest within rising channel
Confluence Fib + trendline + EMA + structure flip
Indicators RSI neutral-bullish, EMA alignment positive
Fundamentals Favors GBP strength vs weakening CAD
Entry Plan Requires SOS confirmation, no impulsive entries
Target Weekly liquidity highs / prior swing highs
Risk Control Defined via 61.8% invalidation / EMA break
→ My Rating: ★★★★★ 9.3 / 10
A mature, high-confluence setup aligning technicals and macro fundamentals. Ideal for trend-following traders who wait for confirmation.

GBPCAD- Sell Position setup on 15 minute ChartGBPCAD- Sell Position setup on 15 minute Chart based on Strong Potential reversal zone. it is expected that market will pump from support level untill then we are good to hit tp 1 and Tp2 atleast. :)

GBPCAD SHORT FORECAST Q2 W24 D13 Y25GBPCAD SHORT FORECAST Q2 W24 D13 Y25
Professional Risk Managers👋
Welcome back to another FRGNT chart update📈
Diving into some Forex setups using predominantly higher time frame order blocks alongside intraday confirmation breaks of structure.
💡Here are some trade confluences📝
✅Weekly highs POI
✅1H order block rejection
✅4H order block rejection
✅15’ order block identification
🔑 Remember, to participate in trading comes always with a degree of risk, therefore as professional risk managers it remains vital that we stick to our risk management plan as well as our trading strategies.
📈The rest, we leave to the balance of probabilities.
💡Fail to plan. Plan to fail.
🏆It has always been that simple.
❤️Good luck with your trading journey, I shall see you at the very top.
🎯Trade consistent, FRGNT X

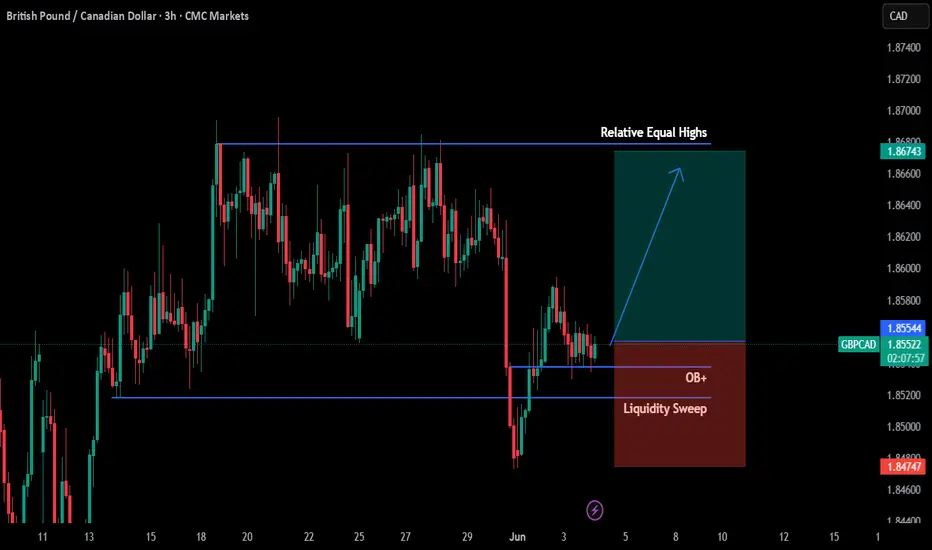
GBP/CAD Potential Upward Movement💡 Buy Market Order @ 1.85544
🎯 Target Profit 1.86743
🛑 Stop Loss 1.84747
❌ Do not risk more than 1% of your account on each trade
Description:
The price has swept liquidity under the swing lows and bounced back quickly. GBP/CAD is in a consolidation mode before a new move upward all the way up toward 1.86 mark.
-------------------------------------------------------------------------------------
Please press “Like” if you appreciate the trading idea 👍
“Follow” for more trading ideas in the future 👀
“Comment” below to share your thoughts with us and other traders 👥
-------------------------------------------------------------------------------------
Risk Disclaimer: All trading ideas published by “PriceActionDesk” are for educational purposes only. These posts can help you to enhance your trading skills, but please do your own research before opening any trading position. ⚠️
-------------------------------------------------------------------------------------
🙂 Good Luck!
GBPCAD Bullish Flag continuation pattern developing GBP/CAD maintains a bullish bias, supported by a well-established rising trend. Recent intraday movement suggests sideways consolidation, which may serve as a base for the next upward leg if key support holds.
Key Level: 1.8530
This zone marks the previous consolidation range and serves as a critical support level.
Bullish Scenario (bounce from 1.8530):
A successful retest and rebound from 1.8530 would reinforce the bullish outlook.
Upside targets include:
1.8720 – Near-term resistance
1.8760 – Previous swing high
1.8830 – Long-term resistance zone
Bearish Scenario (break below 1.8530):
A confirmed daily close below 1.8530 would weaken the bullish structure.
Potential downside support levels:
1.8490 – Initial support
1.8460 – Deeper retracement level
Conclusion
The outlook for GBP/CAD remains constructive as long as 1.8530 holds. A bullish bounce from this level could pave the way for continuation toward 1.8720 and higher. However, a daily close below 1.8530 would shift the bias to neutral-to-bearish, exposing the pair to further downside toward the 1.8460 region. Traders should closely monitor price action at 1.8530 for directional confirmation.
This communication is for informational purposes only and should not be viewed as any form of recommendation as to a particular course of action or as investment advice. It is not intended as an offer or solicitation for the purchase or sale of any financial instrument or as an official confirmation of any transaction. Opinions, estimates and assumptions expressed herein are made as of the date of this communication and are subject to change without notice. This communication has been prepared based upon information, including market prices, data and other information, believed to be reliable; however, Trade Nation does not warrant its completeness or accuracy. All market prices and market data contained in or attached to this communication are indicative and subject to change without notice.


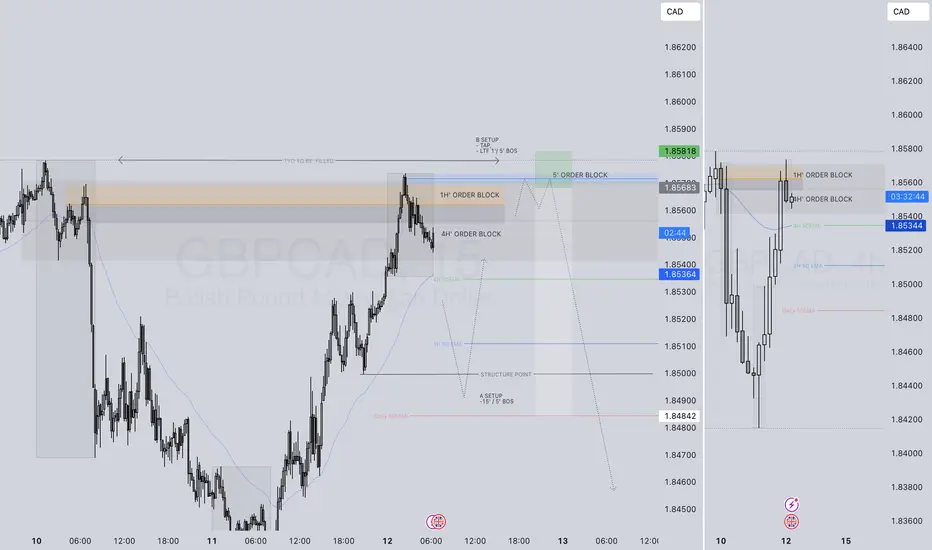
GBPCAD BUY TRADE PLAN
## 📘 ForexGPT Elite Trade Plan – GBP/CAD
🔹 *Last Updated: June 12, 2025 –
🔹 *Market Type: Swing-to-Intraday Breakout with Optional Pullback Re-entry*
---
### 🧠 Multi-Timeframe Technical Summary:
🔍 **1H Chart**
* Price broke above key structure resistance (1.8525) with momentum.
* Minor rejection wicks at 1.8550 zone → could lead to shallow pullback (buy-the-dip opportunity).
* Short-term support now forms at 1.8520–1.8500.
🔍 **4H Chart**
* Clean breakout above recent double-bottom neckline (1.8525).
* Bullish structure, likely to attempt 1.8590–1.8650 range retest.
* Ideal to buy near support with confirmation OR on fresh breakout continuation.
🔍 **Daily Chart**
* Bullish bounce off 1.8420–1.8440 demand zone confirmed.
* Room to move toward 1.8650–1.8730 range highs.
* Trend bias is recovering from corrective phase.
🔍 **Weekly Chart**
* Holding mid-range compression, bullish structure intact.
* Higher lows since March support upside continuation bias.
---
🎯 Primary Trade Plan – Breakout Continuation Buy
Parameter Value
Trade Type Swing-to-Intraday
Order Type ✅ Buy Limit at 1.8525/05 (pullback entry)
SL Below 1.8440 (safe zone under structure)
TP1 1.8590
TP2 1.8650
TP3 (extended) 1.8730 (only if strong daily momentum)---
### 🔁 Alternate Entry Plan – *Manual Buy on Confirmation*
* Wait for price to **retest 1.8525-05** and show **bullish rejection candle** on H1 or M30.
* Entry: **Market Buy** on bullish engulfing / pin bar confirmation
* Same SL and TP as above.
---
### ⚠️ Bearish Scenario (Low Probability)
* If price shows strong **bearish engulfing from 1.8550–1.8560**, invalidating the breakout:
* **Sell Entry**: 1.8500
* **SL**: Above 1.8565
* **TP1**: 1.8445
* **TP2**: 1.8390 (if downside accelerates)
---
### 🧠 ForexGPT Forecast Summary:
> “If 1.8525/05 holds as new support, GBP/CAD is primed for a rally toward 1.8650. If it breaks back below 1.8510 and forms bearish engulfing, then bears may regain control. At this moment, I favor the upside with 70% probability.”
---
### ✅ What I’d Personally Do:
> Place a **Buy Limit at 1.8505**, **SL below 1.8440**, target **1.8650**.
> If price revisits 1.8505 but shows indecision, I’d wait for a bullish confirmation candle before manually buying.
---
⚠️ **Risk Note:**
Trading forex involves substantial risk. Never risk more than you can afford to lose. Use proper lot sizing, especially during key news (BOE/CAD data nearby).
---
🧠 **Pro Tip:**
"Watch for clean retests and candle confirmation. Always let the market come to you. Patience = Profits."
---

GBPCAD SHORT FORECAST Q2 W24 D12 Y25GBPCAD SHORT FORECAST Q2 W24 D12 Y25
Professional Risk Managers👋
Welcome back to another FRGNT chart update📈
Diving into some Forex setups using predominantly higher time frame order blocks alongside intraday confirmation breaks of structure.
💡Here are some trade confluences📝
✅Weekly highs POI
✅1H order block rejection
✅4H order block rejection
✅15’ order block identification
🔑 Remember, to participate in trading comes always with a degree of risk, therefore as professional risk managers it remains vital that we stick to our risk management plan as well as our trading strategies.
📈The rest, we leave to the balance of probabilities.
💡Fail to plan. Plan to fail.
🏆It has always been that simple.
❤️Good luck with your trading journey, I shall see you at the very top.
🎯Trade consistent, FRGNT X
GBPCAD SELLBy utilizing levels, historical patterns, , we can formulate a hypothesis that the market might follow a similar trajectory if bearish sentiment prevails.

GBPCAD-SELL strategy 9 Hourly KAGIThe pair is under pressure and moved below support levels. the chance for testing 1.8250 seems possible short term.
Strategy SELL @ 1.8410-1.8460 and take profit near 1.8278 for now.

GBPCAD Counter-Trend SELL(Weekly) - Price hit previous extreme high at (1.85932 - 1.87820) and was rejected forming double top neckline at (1.81470 - 1.80561) .
(Weekly) - Previous Week Candle Close is Shooting Star showing sellers taking action at Key Resistance level.
(Daily) - Price formed double top inside our resistance level at (1.85932 - 1.87820).
(Daily) - Price broke double neckline at (1.85533 - 1.85774).
(H4) - Price was in distribution at (1.86602 - 1.85774).
(H4) - Rising Trendline that price broke connecting (1.80561 - 1.86011).
Trade Entry.
(H4) - Wait for price to retest our daily double top neckline & low of the distribution at (1.85533 - 1.85774) to join the reversal.
(H4) - Take profit at Weekly Double Top Neckline at (1.81470 - 1.80561).

GBPCAD - BEARISH MOVE !Hello Traders !
On Monday 19 May, The GBPCAD reached the resistance level (1.86946 - 1.87188).
The price broke the support line.
So, I expect a bearish move📉
_______________
TARGET: 1.84150🎯
