Head and Shoulders forming Head and Shoulkder startiung to form ,wait for break of support and retest to confirm
GBPCHF trade ideas

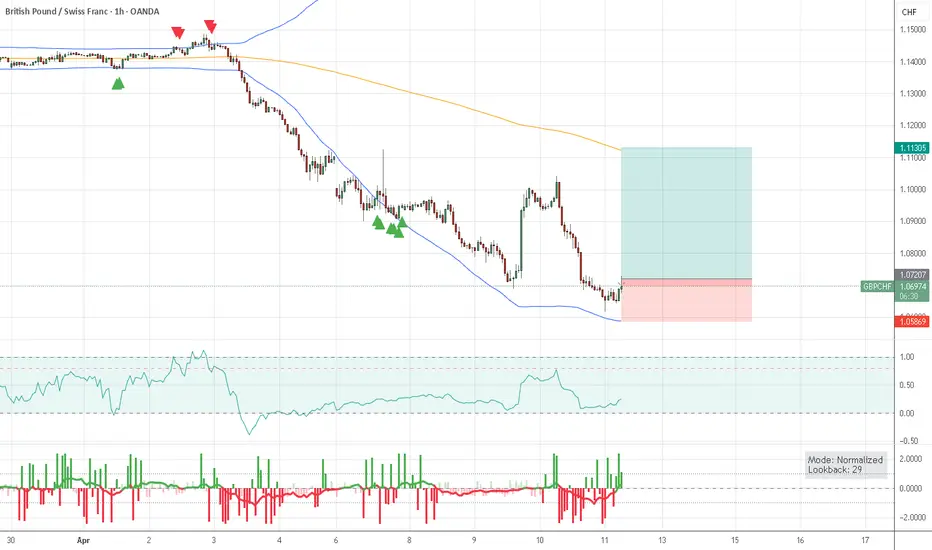
GBP/CHF SENDS CLEAR BEARISH SIGNALS|SHORT
GBP/CHF SIGNAL
Trade Direction: short
Entry Level: 1.102
Target Level: 1.061
Stop Loss: 1.130
RISK PROFILE
Risk level: medium
Suggested risk: 1%
Timeframe: 12h
Disclosure: I am part of Trade Nation's Influencer program and receive a monthly fee for using their TradingView charts in my analysis.
✅LIKE AND COMMENT MY IDEAS✅

GBP/CHFThis pair is on the Bearish reversal move.
On Daily, it shows that it failed to break through 1.10900 Psychological Support / Resistant.
On 1H time frame, you can notice that there are two Head & Shoulders that are forming.

[GBPCHF] Trade ideaAnother short entry on this asset after the previous SL but I still have a strong conviction. Last try for the short otherwise I will let it run by itself.
Great Trade !

GBPCHF: Bearish Continuation & Short Signal
GBPCHF
- Classic bearish setup
- Our team expects bearish continuation
SUGGESTED TRADE:
Swing Trade
Short GBPCHF
Entry Point - 1.1052
Stop Loss - 1.1120
Take Profit - 1.0921
Our Risk - 1%
Start protection of your profits from lower levels
Disclosure: I am part of Trade Nation's Influencer program and receive a monthly fee for using their TradingView charts in my analysis.
❤️ Please, support our work with like & comment! ❤️

GBPCHF ... Potential Bullish Move April 28th 2025GBPCHF ... Potential Bullish Move April 28th 2025
.
By: Noble.Mike.Jamison

GBP/CHF For Bullishwait for pull-back near by entry point and then go long
general trend is up trend
have fun :)

[GBPCHF] Trade ideaPosition right on the open of the market so warning but seams to be a great entry for a short. The risk is large on this trade but can be managed more strictly.
Great Trade !

GBP_CHF CORRECTION AHEAD|SHORT|
✅GBP_CHF has retested a nice key resistance level of 1.1100
And as the pair is already making a bearish pullback
A move down to retest the demand level below at 1.0950 is likely
SHORT🔥
✅Like and subscribe to never miss a new idea!✅
Disclosure: I am part of Trade Nation's Influencer program and receive a monthly fee for using their TradingView charts in my analysis.

GBPCHF The Target Is DOWN! SELL!
My dear followers,
This is my opinion on the GBPCHF next move:
The asset is approaching an important pivot point 1.1017
Bias - Bearish
Safe Stop Loss - 1.1089
Technical Indicators: Supper Trend generates a clear short signal while Pivot Point HL is currently determining the overall Bearish trend of the market.
Goal - 1.0879
About Used Indicators:
For more efficient signals, super-trend is used in combination with other indicators like Pivot Points.
Disclosure: I am part of Trade Nation's Influencer program and receive a monthly fee for using their TradingView charts in my analysis.
———————————
WISH YOU ALL LUCK

GBPCHF - Bull No More!Hello TradingView Family / Fellow Traders. This is Richard, also known as theSignalyst.
📈From a medium-term perspective, GBPCHF has been bullish trading within the rising channel marked in blue.
This week, GBPCHF has been approaching the upper bound of its channel.
Moreover, the red zone around $1.115 is a strong support turned resistance.
🏹 Thus, the highlighted red circle is a strong area to look for sell setups as it is the intersection of the upper blue trendline and resistance.
📚 As per my trading style:
As #GBPCHF approaches the red circle zone, I will be looking for bearish reversal setups (like a double top pattern, trendline break , and so on...)
📚 Always follow your trading plan regarding entry, risk management, and trade management.
Good luck!
All Strategies Are Good; If Managed Properly!
~Rich
Disclosure: I am part of Trade Nation's Influencer program and receive a monthly fee for using their TradingView charts in my analysis.

GBP-CHF Will Go Down! Sell!
Hello,Traders!
GBP-CHF is moving upwards
Towards the horizontal resistance
Above around 1.1125 and as the
Pair is overbought we will be
Expecting a local pullback and
A bearish correction
Sell!
Comment and subscribe to help us grow!
Check out other forecasts below too!
Disclosure: I am part of Trade Nation's Influencer program and receive a monthly fee for using their TradingView charts in my analysis.


GBPCHF INTRADAY bearish oversold rallyThe GBP/CHF currency pair remains under bearish pressure, in line with the broader downtrend. Recent price movement reflects an oversold rally that stalled near a key resistance level at 1.1120, which previously acted as an intraday consolidation zone.
This level now serves as a crucial pivot. If price fails to break above 1.1120 and faces rejection, it could trigger a continuation of the bearish trend with downside targets at:
1.0690 – Initial support
1.0600 – Medium-term target
1.0460 – Long-term support level
On the flip side, a confirmed breakout and daily close above 1.1120 would invalidate the bearish bias. This would open the door for a recovery toward:
1.1200 – First resistance above the breakout
1.1250 – Key upside target
Conclusion
The bearish bias remains intact below 1.1120, with oversold rallies likely to attract selling interest. A daily close above 1.1120 would be a bullish signal, potentially shifting momentum toward higher resistance levels.
This communication is for informational purposes only and should not be viewed as any form of recommendation as to a particular course of action or as investment advice. It is not intended as an offer or solicitation for the purchase or sale of any financial instrument or as an official confirmation of any transaction. Opinions, estimates and assumptions expressed herein are made as of the date of this communication and are subject to change without notice. This communication has been prepared based upon information, including market prices, data and other information, believed to be reliable; however, Trade Nation does not warrant its completeness or accuracy. All market prices and market data contained in or attached to this communication are indicative and subject to change without notice.

GBP/CHF Finally Above The Res , Long Setup Valid To Get 200 PipsHere is my Analysis on GBP/CHF , We have a clear breakout with daily closure above my previous Res so now i`m looking to buy this pair but i`m waiting the price to go back and retest it and give me a clear bullish price action and then we can buy it and targeting 200 pips .

Daily Price Action: GBPCHF Wednesday 4/23/2025In this video, we will be looking into the potential price action of GBPCHF.

GBPCHF...SHORT
OANDA:GBPCHF
Analysis complete — scenarios outlined. The zone could be a decision point for . Price reaction here may define the next move.
If price breaks and pulls back to retest, a reversal setup might emerge.

GBPCHF Set To Fall! SELL!
My dear friends,
Please, find my technical outlook for GBPCHF below:
The price is coiling around a solid key level - 1.0950
Bias - Bearish
Technical Indicators: Pivot Points Low anticipates a potential price reversal.
Super trend shows a clear sell, giving a perfect indicators' convergence.
Goal - 1.0844
Safe Stop Loss - 1.1013
About Used Indicators:
The pivot point itself is simply the average of the high, low and closing prices from the previous trading day.
Disclosure: I am part of Trade Nation's Influencer program and receive a monthly fee for using their TradingView charts in my analysis.
———————————
WISH YOU ALL LUCK

Lingrid | GBPCHF approaching PSYCHOLOGICAL Resistance at 1.10000FX:GBPCHF market is approaching the significant psychological level at 1.10000. While the daily timeframe maintains a bearish bias, the 1H timeframe shows a corrective move against the major trend. The price has moved above the previous week's high, potentially creating an area from which it may begin to drop. Looking at historical price action to the left, we can observe that price has previously fallen from this resistance zone. I anticipate the market will likely reject the psychological level above and then move lower toward the channel boundary and beyond. I expect the market to break through the upward channel, resuming its larger bearish trend. My goal is support zone around 1.08150
Traders, if you liked this idea or if you have your own opinion about it, write in the comments. I will be glad 👩💻

Potential bullish rise?GBP/CHF has reacted off the pivot which is a pullback resistance and could rise tot he 1st resistance which is a pullback resistance.
Pivot: 1.0889
1st Support: 1.0784
1st Resistance: 1.1094
Risk Warning:
Trading Forex and CFDs carries a high level of risk to your capital and you should only trade with money you can afford to lose. Trading Forex and CFDs may not be suitable for all investors, so please ensure that you fully understand the risks involved and seek independent advice if necessary.
Disclaimer:
The above opinions given constitute general market commentary, and do not constitute the opinion or advice of IC Markets or any form of personal or investment advice.
Any opinions, news, research, analyses, prices, other information, or links to third-party sites contained on this website are provided on an "as-is" basis, are intended only to be informative, is not an advice nor a recommendation, nor research, or a record of our trading prices, or an offer of, or solicitation for a transaction in any financial instrument and thus should not be treated as such. The information provided does not involve any specific investment objectives, financial situation and needs of any specific person who may receive it. Please be aware, that past performance is not a reliable indicator of future performance and/or results. Past Performance or Forward-looking scenarios based upon the reasonable beliefs of the third-party provider are not a guarantee of future performance. Actual results may differ materially from those anticipated in forward-looking or past performance statements. IC Markets makes no representation or warranty and assumes no liability as to the accuracy or completeness of the information provided, nor any loss arising from any investment based on a recommendation, forecast or any information supplied by any third-party.


Daily Price Action GBPCHF Tuesday 4/22/2025In this video, we will be looking into the potential price action of GBPCHF.
