GBPCHF might bounce from this level.As seen in the chart GBPCHF has respected this level throughout the history. As we reach this level and seems like a reversal confirmation, I believe overreaction to the tariffs soon will be correct itself. My first take profit level is around 1.13, looking further to 1.14 levels.
GBPCHF trade ideas


USD/CHF (Long)USD/CHF
Daily:
Price > 200EMA
Swing Period 10
Swing Low: 1.10884
Swing Low: 1.15030
Volume Imbalance: 3 Candles
Daily Order Block: 1.12253 / 1.11294
H4:
Price > 200EMA
Swing Period: 7
Swing High: 1.15030
Swing Low: 1.12860
Volume Imbalance: 2 Candles
H4 Order Block: 1.13452 / 1.13089
H1:
Swing Period: 5
Swing High: 1.15030
Swing Low: 1.12860
Volume Imbalance: 25 Candles
H1 Order Block: 1.13452 / 1.13089
Model 1:
Entry Price: 1.13241
Stop Loss: 1.12860
TP1: 1.14003 @ 1:2 / 50%
TP2: 1.14383 @ 1:3 / 25%
SL: Breakeven
TP3: 1.14764 @ 1:4 / 25%
Model 2:
Entry Price: 1.13690 - 1.13318
Entry Trigger: 9EMA X 21EMA
SL: Above recent swing low
TP1: 1:2
SL: Trailing 9EMA

GBP/CHF - Long Analysis (multiple entry models)Summary of my analysis o GBP/CHF - I trust you will provide me with some feedback this will encourage me to share my thought process to the wider community. I am not a signal provider just sharing knowledge and ideas using theories I have learnt over the years.
Daily: Bullish
Daily
Price above 200EMA and 50EMA > Bullish Bias
The last valid swing low was 1.12860, and the last valid swing high was 1.15030.
The last bullish breakout occurred on March 3, 2025, confirming the trend.
Confirmed liquidity sweeps were executed at key levels.
An anchored VWAP was set to the last swing low that triggered a breakout price above the bullish bias threshold.
Daily OB High: 1.13977
Daily OB Low: 1.13977
A high volume node is located within the daily OB range at 1.13721.
H4
Utilised Fibonacci Retracement to Identify the Optimal Trading Entry Zone
Draw Fibonacci retracement lines from the most recent swing high or low to a recent structural break. Marked the identified Optimal Trading Entry Zone (OTE) as a potential entry point.
High of the Trend (H4 OB): 1.13524
Low of the Trend (H4 OB): 1.13048
Confirmed High Volume Node (HVN) within the H4 OB Price Objective (POC): 1.13479
H1
**Identified Swing Point:** The swing point that caused the broken structure on the H4 chart.
**Confirmed H1 Order Block:** The H1 order block within the OTE area is valid. This is confirmed by aligning the POC (Price of Control) and High Volume Nodes (HVN) at 1.13479.
**H1 Order Block:**
* High: 1.13612
* Low: 1.13435
**Entry Model:**
**Option 1 (Limit Order):**
* Entry Price: 1.13497
* Stop Loss (SL): 1.13294 (20 pips)
* Risk-Reward Ratio: 1:2, 1:3, or 1:4
**Option 2 (Limit Order):**
* Entry Price: 1.13497
* Stop Loss (SL): 1.12839 (67 pips)
* Risk-Reward Ratio: 1:2
* Breakeven Point: 1:1
**Option 3 (EMA Confirmation Entry):**
* Enter when the 9EMA crosses the 21EMA near the OTE price level.
* Volume confirmation should be bullish volume above the 21MA on each tick.
* Stop Loss (SL): ATR (Average True Range) X 2
* Risk-Reward Ratio: 1:2

GBPCHF INTRADAY corrective pullback capped at 1.1430Trend Overview
The GBP/CHF currency pair remains in a bearish trend, with current price action reflecting a potential oversold bounce within a broader downtrend.
Key Levels & Scenarios
Resistance: 1.1440 (previous consolidation zone)
A bearish rejection from this level could reinforce downside momentum.
Downside targets: 1.1340, followed by 1.1300 and 1.1200 over a longer timeframe.
Bullish Breakout Scenario:
A daily close above 1.1440 would invalidate the bearish outlook.
Upside targets: 1.1480, followed by 1.1500.
Volume analysis indicates limited buying pressure, keeping the bearish bias intact unless 1.1440 is breached.
Conclusion
As long as 1.1440 holds as resistance, GBP/CHF remains in a bearish structure, targeting 1.1340 and lower levels. A break above 1.1440 would signal a potential shift toward 1.1480 and 1.1500.
This communication is for informational purposes only and should not be viewed as any form of recommendation as to a particular course of action or as investment advice. It is not intended as an offer or solicitation for the purchase or sale of any financial instrument or as an official confirmation of any transaction. Opinions, estimates and assumptions expressed herein are made as of the date of this communication and are subject to change without notice. This communication has been prepared based upon information, including market prices, data and other information, believed to be reliable; however, Trade Nation does not warrant its completeness or accuracy. All market prices and market data contained in or attached to this communication are indicative and subject to change without notice.

GBPCHF Trade IdeaGBPCHF Trade Idea
Analysis & Justification:
• Price is currently above the 200 EMA, indicating an overall bullish trend.
• A Break of Structure (BOS) has occurred, serving as a second confirmation that the price is in an uptrend and likely to continue its upward movement.
• Price has also rejected the Demand Zone at the BOS level, further reinforcing the bullish momentum after testing this key support area.
Trade Parameters:
• Entry Price: 1.14407
• Target Price: 1.14929
• Stop Loss: 1.14146
• Risk-Reward Ratio (RRR): 2
This setup aligns with the trend-following strategy, leveraging trend continuation signals and demand zone rejections.

GBPCHF: Short Signal Explained
GBPCHF
- Classic bearish pattern
- Our team expects retracement
SUGGESTED TRADE:
Swing Trade
Sell GBPCHF
Entry - 1.1424
Stop - 1.1436
Take - 1.1402
Our Risk - 1%
Start protection of your profits from lower levels
Disclosure: I am part of Trade Nation's Influencer program and receive a monthly fee for using their TradingView charts in my analysis.
❤️ Please, support our work with like & comment! ❤️

GBPCHF SWING SELLWyckoff accumulation on 4H after tapping into our institutional supply order lock...time to sell?

GBPCHF ShortGBPCHF is now net short on the regression break.
I am entering a EA on this pair with limited risk

GBP_CHF LONG FROM RISING SUPPORT|
✅GBP_CHF is trading along the rising support
And as the pair will soon retest it
I am expecting the price to go up
To retest the supply levels above at 1.1413
LONG🚀
✅Like and subscribe to never miss a new idea!✅
Disclosure: I am part of Trade Nation's Influencer program and receive a monthly fee for using their TradingView charts in my analysis.

GBPCHFStill down trend at 4h, need another pullback at AOI, then comfirmation of rejection pattern, SL at provious High, target to Previous LOW

GBPCHF Massive Short! SELL!
My dear subscribers,
GBPCHF looks like it will make a good move, and here are the details:
The market is trading on 1.1428 pivot level.
Bias - Bearish
Technical Indicators: Both Super Trend & Pivot HL indicate a highly probable Bearish continuation.
Target - 1.1410
About Used Indicators:
The average true range (ATR) plays an important role in 'Supertrend' as the indicator uses ATR to calculate its value. The ATR indicator signals the degree of price volatility.
Disclosure: I am part of Trade Nation's Influencer program and receive a monthly fee for using their TradingView charts in my analysis.
———————————
WISH YOU ALL LUCK

GBP-CHF Bullish Bias! Buy!
Hello,Traders!
GBP-CHF is trading in an
Uptrend along the long-term
Rising support line and the pair
Is going down now to retest
The support from where
We will be expecting a
Bullish rebound and
A strong move up
Buy!
Comment and subscribe to help us grow!
Check out other forecasts below too!
Disclosure: I am part of Trade Nation's Influencer program and receive a monthly fee for using their TradingView charts in my analysis.

GBPCHF Ready to Surge? Bullish Momentum Unfolding After Retail The latest retail sales data for GBP has exceeded forecasts, signaling strong consumer demand and economic resilience.
After four consecutive bullish candles, we observed a pullback that formed a hammer—a key reversal signal—potentially completing a morning star pattern. This price action suggests that buyers are regaining control, and momentum is shifting to the upside. If confirmed by further bullish movement, we could see GBPCHF pushing higher in the coming sessions.

It’s close to the London !!!!You must have a keen eye for market structure
Price action
Trends
Supply demand
Support and resistance
Indicators
You need them all as confluence for higher probable setups
Stay connected 🤞

GBPCHF: Bears Will Push
Our strategy, polished by years of trial and error has helped us identify what seems to be a great trading opportunity and we are here to share it with you as the time is ripe for us to sell GBPCHF.
Disclosure: I am part of Trade Nation's Influencer program and receive a monthly fee for using their TradingView charts in my analysis.
❤️ Please, support our work with like & comment! ❤️

GBPCHF INTRADAY coiling energy build up supported at 1.1366The GBP/CHF currency pair shows a bullish sentiment, supported by the prevailing uptrend. Recent intraday price action indicates a bounce back from the rising trendline support zone.
Bullish Scenario:
The key trading level to watch is 1.1366, representing the previous consolidation range. A corrective pullback to this level, followed by a bullish bounce, would likely target upside resistance at 1.1470. Further bullish momentum could see prices reaching 1.1510 and 1.1570 over the longer timeframe.
Bearish Scenario:
On the other hand, a confirmed loss of the 1.1366 support level, accompanied by a daily close below this point, would invalidate the bullish outlook. This would pave the way for a deeper retracement toward 1.1300, with the next support level at 1.1240.
Conclusion:
The prevailing sentiment remains bullish as long as 1.1366 holds as support. Traders should monitor this level for potential bounce signals to confirm continued upside momentum. A decisive break below 1.1366 would signal a shift to a bearish outlook, targeting lower support zones.
This communication is for informational purposes only and should not be viewed as any form of recommendation as to a particular course of action or as investment advice. It is not intended as an offer or solicitation for the purchase or sale of any financial instrument or as an official confirmation of any transaction. Opinions, estimates and assumptions expressed herein are made as of the date of this communication and are subject to change without notice. This communication has been prepared based upon information, including market prices, data and other information, believed to be reliable; however, Trade Nation does not warrant its completeness or accuracy. All market prices and market data contained in or attached to this communication are indicative and subject to change without notice.

GBP_CHF LONG SIGNAL|
✅GBP_CHF is trading in an uptrend
Along the rising support line
Which makes me bullish biased
And the pair is about to retest the rising support
Thus, a rebound and a move up is expected
So we can enter a long trade with
The TP of 1.1410 and SL of 1.1350
LONG🚀
✅Like and subscribe to never miss a new idea!✅
Disclosure: I am part of Trade Nation's Influencer program and receive a monthly fee for using their TradingView charts in my analysis.

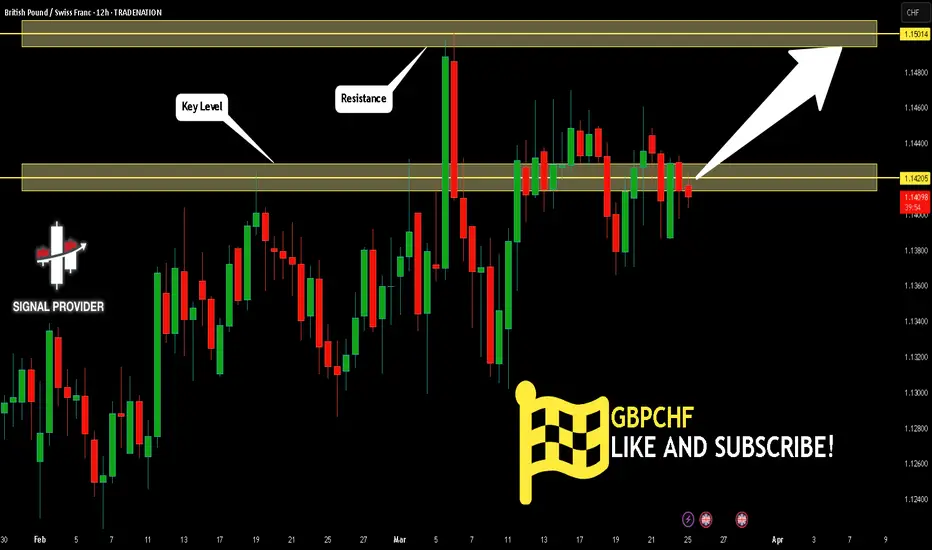
GBPCHF Will Grow! Long!
Here is our detailed technical review for GBPCHF.
Time Frame: 12h
Current Trend: Bullish
Sentiment: Oversold (based on 7-period RSI)
Forecast: Bullish
The market is trading around a solid horizontal structure 1.142.
The above observations make me that the market will inevitably achieve 1.150 level.
P.S
We determine oversold/overbought condition with RSI indicator.
When it drops below 30 - the market is considered to be oversold.
When it bounces above 70 - the market is considered to be overbought.
Disclosure: I am part of Trade Nation's Influencer program and receive a monthly fee for using their TradingView charts in my analysis.
Like and subscribe and comment my ideas if you enjoy them!
GBPCHF: Waiting for Breakout to Show Price DirectionGBPCHF: Waiting for Breakout to Show Price Direction
GBPCHF takes a complex shape that is not often observed in pairs like GBPCHF.
The price shows both trading opportunities from this triangle pattern.
Another problem is related with the market volume that we had soft events yesterday and today and many charts are in correction.
Only the breakout above or below the triangle pattern where GBPCHF is accumulation will show how we can trade GBPCHF.
You may find more details in the chart!
Thank you and Good Luck!
❤️PS: Please support with a like or comment if you find this analysis useful for your trading day❤️
Disclosure: I am part of Trade Nation's Influencer program and receive a monthly fee for using their TradingView charts in my analysis.

GBPCHF still bullish to see?
OANDA:GBPCHF what's next, in first analysis (attached) highly accurate, we are have nice strong bullish push.
Long strong zone is breaked, technicals are still strong bullish, CHF still what can see is to expect bearish and with some other pairs.
Currently price is in ASCENDING CHANNEL, having good sup zones, personally here expecting one more bullish push.
SUP zone: 1.13800
RES zone: 1.15100, 1.15550

GBPCHF Is Going Up! Buy!
Please, check our technical outlook for GBPCHF.
Time Frame: 1D
Current Trend: Bullish
Sentiment: Oversold (based on 7-period RSI)
Forecast: Bullish
The market is approaching a key horizontal level 1.140.
Considering the today's price action, probabilities will be high to see a movement to 1.151.
P.S
We determine oversold/overbought condition with RSI indicator.
When it drops below 30 - the market is considered to be oversold.
When it bounces above 70 - the market is considered to be overbought.
Disclosure: I am part of Trade Nation's Influencer program and receive a monthly fee for using their TradingView charts in my analysis.
Like and subscribe and comment my ideas if you enjoy them!

GBP/CHF BEARS ARE GAINING STRENGTH|SHORT
Hello, Friends!
Previous week’s green candle means that for us the GBP/CHF pair is in the uptrend. And the current movement leg was also up but the resistance line will be hit soon and upper BB band proximity will signal an overbought condition so we will go for a counter-trend short trade with the target being at 1.126.
Disclosure: I am part of Trade Nation's Influencer program and receive a monthly fee for using their TradingView charts in my analysis.
✅LIKE AND COMMENT MY IDEAS✅
