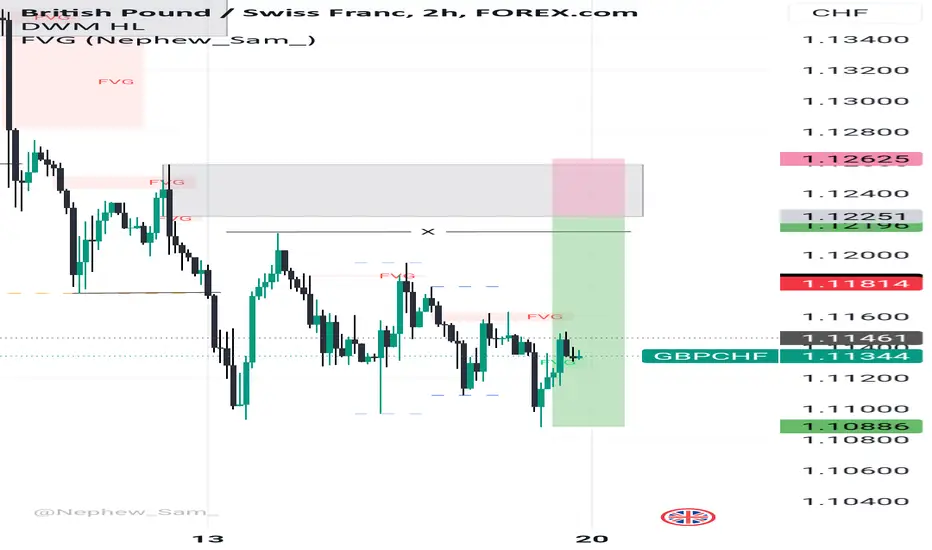
GBP/CHF Breakout Riding the Bullish Wave of the Cup and HandleThe chart for GBP/CHF on the 2-hour timeframe highlights a classic cup-and-handle pattern, a well-recognized bullish continuation setup. The rounded bottom of the cup indicates a period of accumulation, while the subsequent handle reflects a minor retracement and consolidation phase. This pattern suggests a strong potential for upward momentum as buyers regain control and push prices higher.
Key support and resistance levels are clearly defined. The rounded bottom has established firm support at 1.1130, while the handle retracement respected the 1.1198 level, reinforcing it as a critical short-term support zone. The neckline of the cup pattern, now serving as a breakout point, is around 1.1204. If bullish momentum continues, the price is likely to test resistance levels at 1.1270 and further extend towards 1.1350.
The chart also shows dynamic support and resistance through moving averages or bands, with the recent transition to green indicating strengthening bullish momentum. These indicators are acting as a trailing support zone, adding further confidence to the long position.
The long position was initiated at the breakout above the handle consolidation, confirming bullish intent as the price reclaimed the neckline at 1.1204. The stop loss is strategically placed below the handle retracement at approximately 1.1190 to protect against a false breakout or reversal. The initial target is set at 1.1270, aligned with Fibonacci extensions and resistance zones, while an extended target lies near 1.1350, suggesting significant upside potential.
Cup-and-handle breakouts typically align with increasing volume during the breakout phase, confirming the strength of the move. Traders are advised to monitor price action closely near key resistance levels to gauge the sustainability of this bullish trend.
The setup presents a disciplined and well-calculated bullish breakout strategy. The technical indicators, pattern formation, and risk management align to support a strong upward move, provided market conditions remain favorable. This chart reflects a clear opportunity for traders aiming to capitalize on the continuation of bullish momentum.
GBPCHF trade ideas

GBPCHF - 24 Jan 2025 SetupGBPCHF Market structure are making N pattern on the market structure with strong bullish rally. Spotted demand area (Green Rectangle). its the first demand area after the price breaking bearish structure.
Entry Position : Long
Profit Target : 1:3 Shown on the chart image (Green Line)
Stop Loss : Slightly below demand area (Red Line)
Follow me if u guys making any gains from this idea.
Thanks
Coffee Trade Team

GBP/CHF BEARS ARE STRONG HERE|SHORT
Hello, Friends!
GBP/CHF is making a bullish rebound on the 12H TF and is nearing the resistance line above while we are generally bearish biased on the pair due to our previous 1W candle analysis, thus making a trend-following short a good option for us with the target being the 1.104 level.
✅LIKE AND COMMENT MY IDEAS✅

Heading into overlap resistance?GBP/CHF is rising towards the pivot which has been identified as an overlap resistance and could drop to the 1st support which acts as a pullback support.
Pivot: 1.1248
1st Support: 1.1190
1st Resistance: 1.1297
Risk Warning:
Trading Forex and CFDs carries a high level of risk to your capital and you should only trade with money you can afford to lose. Trading Forex and CFDs may not be suitable for all investors, so please ensure that you fully understand the risks involved and seek independent advice if necessary.
Disclaimer:
The above opinions given constitute general market commentary, and do not constitute the opinion or advice of IC Markets or any form of personal or investment advice.
Any opinions, news, research, analyses, prices, other information, or links to third-party sites contained on this website are provided on an "as-is" basis, are intended only to be informative, is not an advice nor a recommendation, nor research, or a record of our trading prices, or an offer of, or solicitation for a transaction in any financial instrument and thus should not be treated as such. The information provided does not involve any specific investment objectives, financial situation and needs of any specific person who may receive it. Please be aware, that past performance is not a reliable indicator of future performance and/or results. Past Performance or Forward-looking scenarios based upon the reasonable beliefs of the third-party provider are not a guarantee of future performance. Actual results may differ materially from those anticipated in forward-looking or past performance statements. IC Markets makes no representation or warranty and assumes no liability as to the accuracy or completeness of the information provided, nor any loss arising from any investment based on a recommendation, forecast or any information supplied by any third-party.

GBPCHF FORECASTGuys I think we need to be patient in this pair. However it is at the key area, still the price has so many probabilities to go. The best way is to be patient waiting for the price to give us clear picture of what it wants to do!

Fri 24th Jan 2025 GBP/CHF Daily Forex Chart Buy SetupGood morning fellow traders. On my Daily Forex charts using the High Probability & Divergence trading methods from my books, I have identified a new trade setup this morning. As usual, you can read my notes on the chart for my thoughts on this setup. The trade being a GBP/CHF Buy. Enjoy the day all. Cheers. Jim

gbpchf buy tradeThe Relative Strength Index (RSI) is showing an upward trend, indicating increasing momentum. Additionally, the Moving Average Convergence Divergence (MACD) is showing a bullish crossover, further supporting the potential for an upward move

GBPCHF: Will Start Falling! Here is Why:
The recent price action on the GBPCHF pair was keeping me on the fence, however, my bias is slowly but surely changing into the bearish one and I think we will see the price go down.
❤️ Please, support our work with like & comment! ❤️

GBP/CHF 1H Analyis made from higher timeframes, overall downtrend of this pair.
triggers and signals of moves can analysed on the 15min or lower than the 1H to know exactly what is going on.
The pair is currently trading near a key resistance zone (highlighted in purple), where sellers have previously dominated. I’m waiting for a potential rejection from this area, which could be confirmed by a candlestick pattern or a clear formation, such as a double top or a strong bearish engulfing candle.
If the price reacts as expected, I anticipate a break below the ascending trendline (in white), opening the path for a deeper move toward the support levels around 1.1100. This setup aligns with the idea of selling from a strong resistance zone while looking for confirmation before entering the trade.
However if not, we could see a reversall of the trend
Patience is key

GBPCHF pullback buy signal GBPCHF is still in a downtrend, but price seems to be stalling at a triple bottom near 1.1119. I’m looking to buy around 1.112 for a potential correction up to 1.116 and possibly 1.122. Although bears remain in control overall, the slowing negative momentum hints at a short-term turnaround. This creates a decent opportunity to go long on dips. Keep in mind this move is only a pullback, but it could offer a solid bounce in the near term.

GBPCHF SHORTSWeekly: Bearish structure
Daily: Yesterday's candle did close above previous candle which technically has created a higher high. However price is reaching an important AOI around 1.11950
4h: Price has recently created a higher candle closure but same thing as daily timeframe. Also, price is retesting previously broken dynamic trendline
I will be waiting for confirmation on lower tf 30 min and 1 hr close to consider entering shorts.

GBPCHF BEARISH gbp economy is affecting minor pairs
we expecting bbears this weekend and a powerfull retracement

GBPCHF - Accumulation phase !!Hello traders!
‼️ This is my perspective on GBPCHF.
Technical analysis: Here we are in accumulation for the last couple of months, so before a distribution in one of the direction I expect to see a manipulation of buy/sell side liquidity.
Like, comment and subscribe to be in touch with my content!

Long GBP/CHF - Wait for Wedge Breakout-GBP/CHF could be on the verse of reversing based on a 1H wedge, if we get a breakout above the trendline, we could go long for a scalp for a test of a 1.1200, reaction there would determine our next step. Wedge is valid with three waves. Wait for breakout to enter.
B setup
Peace

ICT/SMC Analysis Daily TimeFrame - Daily CISDICT/SMC Analysis Daily TimeFrame - Daily CISD , Potential Upside POI Held and Got Daily CISD and Failed to close Below so far...entries on lower timeframes

LONG GBPCHFLike my earlier post on GBP/CHF, I mentioned that this pair has been ranging for several months/weeks, and it still is. Previously, we saw the price come to the key support level. Last week, the weekly candle closed as a spinning top on this key support, indicating that sellers lost momentum in pushing the price lower.
Yesterday’s close formed a bullish engulfing pattern on the key level, confirming a trend reversal. One more confirmation is the Risk Reward Ratio (RRR) of 4.2, meaning that the trigger can be pulled.
Jeffrey Gomes Lopes

GBPCHF H1break the falling wedge
wait for to print HH& HL
Then go to buy
because in H4 there is bullish divergence
in DAILY its on support but not break the support


GBP/CHF H4 AnalysisPrice has recently printed multiple tests of 1.1100 to 1.11200, with sellers failing to hold price below the level.
A similar situation occurred in November 2024 with buyers eventually winning the battle and taking price all the way to 1.13600.
Look for the possibility of the same thing happening if we see an impulse of buying.

GBPJPY My Opinion! SELL!
My dear friends,
My technical analysis for GBPJPY is below:
The market is trading on 1.1373 pivot level.
Bias - Bearish
Technical Indicators: Both Super Trend & Pivot HL indicate a highly probable GBPJPY continuation.
Target - 1.1313
About Used Indicators:
A pivot point is a technical analysis indicator, or calculations, used to determine the overall trend of the market over different time frames.
———————————
WISH YOU ALL LUCK

GBPCADWait for Price to take out the inducement then tap into the POI. then you can look for ltf entry
GBPCHF Potential DownsidesHey Traders, in tomorrow's trading session we are monitoring GBPCHF for a selling opportunity around 1.11500 zone, GBPCHF is trading in a downtrend and currently is in a correction phase in which it is approaching the trend at 1.11500 support and resistance area.
Trade safe, Joe.

GBPCHF - Long SetupMy main trading principle is that the price always moves from swept liquidity levels to untouched liquidity levels.
In particular case we clearly can see the following context: price swept 1D key liquidity level and left untouched level higher, this indicates on probable accumulation Wyckoff range.
But to take more statistically probable trades we should wait for some type of lower timeframe confirmation, and in this case we can notice sign of strength (reaching the middle of the range), so potentially there is a higher probability to see price lower.
Your success is determined solely by your ability to consistently follow the same principles.
