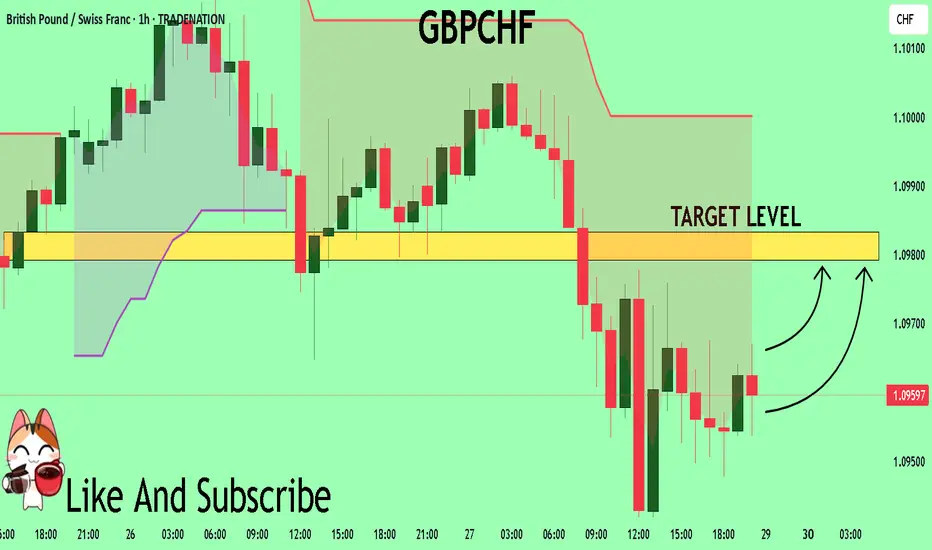
GBP/CHF – Breakout Buy Setup Based on Bullish Divergence (1H TF)The GBP/CHF pair has been moving in a bearish trend, but momentum appears to be shifting. A strong bullish divergence has developed on the 1-hour chart, suggesting potential for a reversal.
Despite no clear reversal pattern at this stage, we’re eyeing a breakout above the last lower high (LH) as confirmation of a shift toward bullish structure. If the breakout occurs, we expect a new higher high (HH) to form, aligning with the divergence.
Retail sentiment is currently 90% long, which adds further interest to this setup. Our buy stop order is positioned to catch the move early, with a 1:1 risk-reward profile.
🔹 Pair: GBP/CHF
🔹 Timeframe: 1H
🔹 Trend: Bearish
🔹 Divergence: Bullish
🔹 Pattern: None
🔹 Sentiment: 90% Long (Myfxbook)
🔹 Bias: Neutral (awaiting structure shift)
🔹 Entry (Buy Stop): 1.08982
🔹 Stop Loss: 1.08207
🔹 Take Profit: 1.09757
🔹 Lot Size: 0.20
🔹 Risk/Reward: 1:1
🔹 Risk: $200
🔹 Potential Reward: $200
🎯 Strategy: Entry will only be triggered if price breaks above the previous LH. That would signal a shift in structure and validate the divergence setup.
📌 #GBPCHF #ForexSignals #BullishBreakout #PriceActionSetup #TrendReversal #SmartMoneyMoves #RetailSentiment #BullishDivergence #1HChart #ForexAnalysis #BuySetup #RiskReward
GBPCHF trade ideas

GBP/CHF - Channel Breakout (02.07.2025)The GBP/CHF pair on the M30 timeframe presents a Potential Buying Opportunity due to a recent Formation of a Breakout Pattern. This suggests a shift in momentum towards the upside and a higher likelihood of further advances in the coming hours.
Possible Long Trade:
Entry: Consider Entering A Long Position around Trendline Of The Pattern.
Target Levels:
1st Resistance – 1.0956
2nd Resistance – 1.0996
🎁 Please hit the like button and
🎁 Leave a comment to support for My Post !
Your likes and comments are incredibly motivating and will encourage me to share more analysis with you.
Best Regards, KABHI_TA_TRADING
Thank you.
Disclosure: I am part of Trade Nation's Influencer program and receive a monthly fee for using their TradingView charts in my analysis.

GBPCHF | Bearish | ShortGBPCHF is in a bearish trend.It is not honoring the bullish divergence and continues to stay in bearish trend by printing new LHs and LLs.

GBPCHF currency trend!I believe that the GBPCHF currency will successfully continue its upward path until it reaches the first price target in the price range of 1.1760, and it will probably take more time to reach the second price target in the price range of 1.2225.
Thanks
MJ.REZAEI

GBPCHF shortGBPCHF has formed a HNS pattern at H4. Followed by rejected price recent from a drawn trendline, I foresee price will continue dropping, broken down the lower trendline until reach the size of the HNS 1:1.

GBPCHF is BullishPrice was in a downtrend, however bullish divergence coupled with double bottom reversal pattern hints a bullish reversal. If previous lower high is broken with good volume then we can expect a reversal as per Dow theory. Targets are mentioned on the chart.

GBP-CHF Bearish Breakout! Sell!
Hello,Traders!
GBP-CHF formed a H&S
Pattern and now we are
Seeing a strong bearish
Breakout of the neckline
Key level around 1.0933
Area and as the breakout
Is confirmed we will be
Expecting a further bearish
Move down towards the
Target below around 1.0867
Sell!
Comment and subscribe to help us grow!
Check out other forecasts below too!
Disclosure: I am part of Trade Nation's Influencer program and receive a monthly fee for using their TradingView charts in my analysis.

GBPCHF My Opinion! BUY!
My dear followers,
I analysed this chart on GBPCHF and concluded the following:
The market is trading on 1.0911 pivot level.
Bias - Bullish
Technical Indicators: Both Super Trend & Pivot HL indicate a highly probable Bullish continuation.
Target - 1.0951
About Used Indicators:
A super-trend indicator is plotted on either above or below the closing price to signal a buy or sell. The indicator changes color, based on whether or not you should be buying. If the super-trend indicator moves below the closing price, the indicator turns green, and it signals an entry point or points to buy.
Disclosure: I am part of Trade Nation's Influencer program and receive a monthly fee for using their TradingView charts in my analysis.
———————————
WISH YOU ALL LUCK

GBPCHF: Strong Bearish SignalGBPCHF has been in a prolonged consolidation since mid-June, remaining within a significant horizontal range on the 4-hour chart.
Following the weekend market opening, the pair appears to be strongly bearish.
The violation of a support level within this range suggests the end of a bearish accumulation phase, creating potential for further upward movement, with the next resistance level to watch at 1.0889.

GBPCHF Is Bearish! Sell!
Here is our detailed technical review for GBPCHF.
Time Frame: 4h
Current Trend: Bearish
Sentiment: Overbought (based on 7-period RSI)
Forecast: Bearish
The market is trading around a solid horizontal structure 1.100.
The above observations make me that the market will inevitably achieve 1.091 level.
P.S
We determine oversold/overbought condition with RSI indicator.
When it drops below 30 - the market is considered to be oversold.
When it bounces above 70 - the market is considered to be overbought.
Disclosure: I am part of Trade Nation's Influencer program and receive a monthly fee for using their TradingView charts in my analysis.
Like and subscribe and comment my ideas if you enjoy them!

GBPCHF Will Go Higher From Support! Buy!
The market is on a crucial zone of demand 1.097.
The oversold market condition in a combination with key structure gives us a relatively strong bullish signal with goal 1.100 level.
P.S
Please, note that an oversold/overbought condition can last for a long time, and therefore being oversold/overbought doesn't mean a price rally will come soon, or at all.
Disclosure: I am part of Trade Nation's Influencer program and receive a monthly fee for using their TradingView charts in my analysis.
Like and subscribe and comment my ideas if you enjoy them!

GBP/CHF BULLS WILL DOMINATE THE MARKET|LONG
Hello, Friends!
GBP-CHF downtrend evident from the last 1W red candle makes longs trades more risky, but the current set-up targeting 1.096 area still presents a good opportunity for us to buy the pair because the support line is nearby and the BB lower band is close which indicates the oversold state of the GBP/CHF pair.
Disclosure: I am part of Trade Nation's Influencer program and receive a monthly fee for using their TradingView charts in my analysis.
✅LIKE AND COMMENT MY IDEAS✅

GBPCHFAnalysis complete — scenarios outlined. The zone could be a decision point for . Price reaction here may define the next move.
If price breaks and pulls back to retest, a reversal setup might emerge.

GBPCHF has reached fib 0.5, bullish movement continues ? GBPCHF has reached the 0.5 fib level in uptrend will it continue the bullish movement, look for reversal trend on 4 hr chart and enter the trade.

GBPCHF Buy Trade IdeaHello Traders
In This Chart GBPCHF HOURLY Forex Forecast By FOREX PLANET
today GBPCHF analysis 👆
🟢This Chart includes_ (GBPCHF market update)
🟢What is The Next Opportunity on GBPCHF Market
🟢how to Enter to the Valid Entry With Assurance Profit
This CHART is For Trader's that Want to Improve Their Technical Analysis Skills and Their Trading By Understanding How To Analyze The Market Using Multiple Timeframes and Understanding The Bigger Picture on the Charts

GBPCHF: Will Start Growing! Here is Why
The charts are full of distraction, disturbance and are a graveyard of fear and greed which shall not cloud our judgement on the current state of affairs in the GBPCHF pair price action which suggests a high likelihood of a coming move up.
Disclosure: I am part of Trade Nation's Influencer program and receive a monthly fee for using their TradingView charts in my analysis.
❤️ Please, support our work with like & comment! ❤️

GBP_CHF RISKY LONG|
✅GBP_CHF fell down sharply
But a strong support level was hit at 1.0932
Thus as a rebound is already happening
A move up towards the target of 1.0970 shall follow
LONG🚀
✅Like and subscribe to never miss a new idea!✅
Disclosure: I am part of Trade Nation's Influencer program and receive a monthly fee for using their TradingView charts in my analysis.

GBPCHF bearish for the week of 30 JuneI am planning to short GBPCHF next week. A Head and shoulder pattern in an existing bearish move signifies a continuation. My trade will be executed on H1 time frame with confluence factors that support a bearish continuation.
A break below the neck line and pull back followed by a strong bearish candle would be ideal.
This is not a trade recommendation; it’s merely my own analysis. Trading carries a high level of risk so carefully managing your capital and risk is important. If you like my idea, please give a “boost” and follow me to get even more.
It’s not whether you are right or wrong, but how much money you make when you are right and how much you lose when you are wrong – George Soros

GBPCHF Technical Analysis! BUY!
My dear subscribers,
GBPCHF looks like it will make a good move, and here are the details:
The market is trading on 1.0959 pivot level.
Bias - Bullish
Technical Indicators: Both Super Trend & Pivot HL indicate a highly probable Bullish continuation.
Target - 1.0979
About Used Indicators:
The average true range (ATR) plays an important role in 'Supertrend' as the indicator uses ATR to calculate its value. The ATR indicator signals the degree of price volatility.
Disclosure: I am part of Trade Nation's Influencer program and receive a monthly fee for using their TradingView charts in my analysis.
———————————
WISH YOU ALL LUCK
GBPCHF Is Going Up! Buy!
Please, check our technical outlook for GBPCHF.
Time Frame: 2h
Current Trend: Bullish
Sentiment: Oversold (based on 7-period RSI)
Forecast: Bullish
The price is testing a key support 1.095.
Current market trend & oversold RSI makes me think that buyers will push the price. I will anticipate a bullish movement at least to 1.098 level.
P.S
The term oversold refers to a condition where an asset has traded lower in price and has the potential for a price bounce.
Overbought refers to market scenarios where the instrument is traded considerably higher than its fair value. Overvaluation is caused by market sentiments when there is positive news.
Disclosure: I am part of Trade Nation's Influencer program and receive a monthly fee for using their TradingView charts in my analysis.
Like and subscribe and comment my ideas if you enjoy them!

GBP-CHF Rebound Ahead! Buy!
Hello,Traders!
GBP-CHF is hovering above
The wide horizontal demand
Level around 1.0926 from
Where we are already
Seeing a bullish rebound
So a further local bullish
Move up is to be expected
Buy!
Comment and subscribe to help us grow!
Check out other forecasts below too!
Disclosure: I am part of Trade Nation's Influencer program and receive a monthly fee for using their TradingView charts in my analysis.

GBPCHF BuyStrong Sell-Off Previously:
The chart shows a sharp downtrend, confirmed by a Change of Character (CHoCH) marking a shift from bullish to bearish structure.
Multiple Lower Highs (LH) and Lower Lows (LL) further validate the downtrend.
Support Zone Identified:
The area marked in blue (buy zone) is a strong demand zone.
It's located at the range low where price has repeatedly tested and rejected (highlighted by Equal Lows (EQL)), suggesting strong liquidity and accumulation.
Shift in Market Structure:
Near the buy zone, a Break of Structure (BOS) and another CHoCH hint at a shift from bearish to bullish sentiment.
The price forms a Higher Low (HL), indicating buyers are gaining strength.
Risk/Reward Favorable:
The long position is placed within the demand zone.
The reward area (green box) is positioned towards the next resistance zone, aligning with a favorable risk/reward ratio.
GBPCHF INTRADAY bearish below 1.1070Key Support and Resistance Levels
Resistance Level 1: 1.1070
Resistance Level 2: 1.1120
Resistance Level 3: 1.1170
Support Level 1: 1.0915
Support Level 2: 1.0865
Support Level 3: 1.0815
This communication is for informational purposes only and should not be viewed as any form of recommendation as to a particular course of action or as investment advice. It is not intended as an offer or solicitation for the purchase or sale of any financial instrument or as an official confirmation of any transaction. Opinions, estimates and assumptions expressed herein are made as of the date of this communication and are subject to change without notice. This communication has been prepared based upon information, including market prices, data and other information, believed to be reliable; however, Trade Nation does not warrant its completeness or accuracy. All market prices and market data contained in or attached to this communication are indicative and subject to change without notice.
