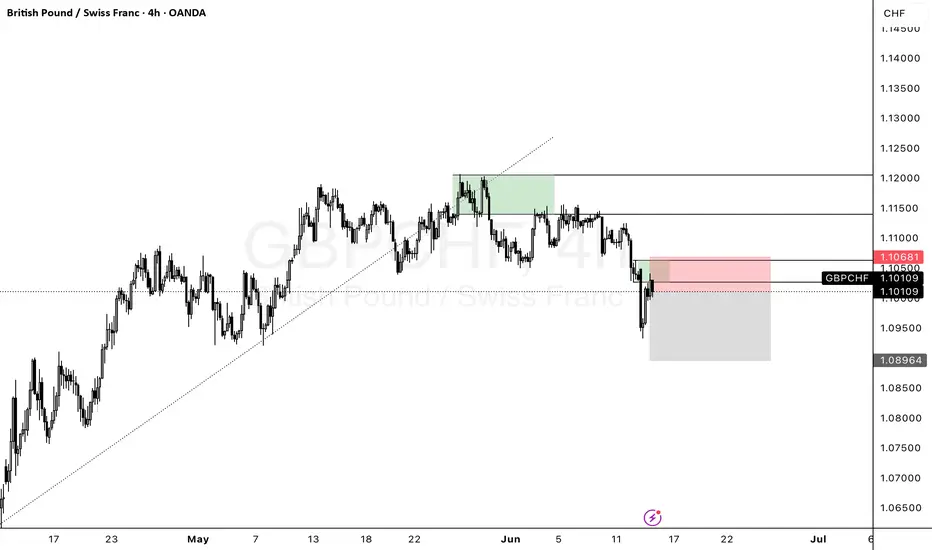
POSSIBLE SELL OPPORTUNITY ON GBPCHF We had a previous sell point of interest that was not engaged as price started to fall. So now we identify a new possible level from which to sell.
GBPCHF trade ideas

GBPCHF Massive Sell??once the head and shoulder on H1 breaks, all we gotta worry about is this weeks fundamentals.


GBPCHF: Bearish Movement After Breakout📉GBPCHF appears to be bearish following a breakout of a significant daily support level.
After retesting this broken structure, the pair formed an inverted cup and handle pattern, and we are now seeing the test of the broken neckline.
A downward movement towards 1.1006 is anticipated.

POSSIBLE SELL OPPORTUNITY ON GBPCHFPrice has broken to the downside and is finally returning for a possible re-test. We identify a supply level where it is most likely to take place in order to enter the trade.


GBPCHF trade ideea potential for next week.The trend is strongly bearish, so I am going to be waiting for a retest of the previous AOI then to sell. Preatty simple I would say😃

GBPCHF Breaks Rising Wedge – Reversal Targets 1.0940 and 1.0815GBPCHF has broken down from a rising wedge formation on the 4H chart, signaling a shift from bullish momentum to bearish control. The pattern break comes near the 50% retracement level, with price now trading below ascending trendline support. With fundamental headwinds weighing on the British pound and safe-haven demand supporting the Swiss franc, the setup favors a short bias targeting the 1.0940 and 1.0815 zones.
🔍 Technical Analysis
Pattern: Rising wedge → broken to the downside
Breakout Confirmation: Price has closed below the wedge support (trendline)
Key Support Levels:
1.0940 → 38.2% fib + previous structure support
1.0815 → 23.6% fib retracement + horizontal support zone
1.0608 → Full wedge base (longer-term target)
Resistance / Invalidation:
1.1150 – a close back above this level invalidates the breakdown
Candle Behavior:
Bearish structure forming with lower highs
Clean engulfing candle closed below wedge
📉 Bias: Bearish (confirmed technical reversal)
🌍 Fundamental Context
🇬🇧 British Pound (GBP)
UK CPI expected to rise (3.3% forecast), which may limit BoE cuts, but not bullish enough to support GBP
Political uncertainty resurfaces (Labour slipping in polls)
BoE speakers are split; no clear support from policy
🇨🇭 Swiss Franc (CHF)
Safe-haven flows rising on:
Global growth slowdown
Tensions between U.S.–Iran
Downgrade of U.S. debt → risk aversion favors CHF
SNB remains cautious, but CHF gains defensive strength in risk-off conditions
🎯 Trade Setup
Bias: Sell
Entry Zone: 1.1080–1.1100 (breakout confirmation)
Targets:
TP1: 1.0940
TP2: 1.0815
TP3: 1.0608 (extension target)
Stop Loss: Above 1.1150
⚠️ Risk Factors
CPI surprise tomorrow could cause GBP spikes — be cautious around the release
If equities rally hard or CHF weakens globally, price could retest the wedge structure before falling
BoE hawkish surprise could challenge short-term bearish bias
🧭 Conclusion
GBP/CHF has broken out of a rising wedge — a classic bearish reversal signal. The technical break aligns with macro weakness in GBP and CHF strength in a risk-off environment. Short trades remain valid below 1.1150, targeting a drop to 1.0940 and 1.0815 in the coming sessions.

gbpchf 4h cp Pair: GBPCHF
Direction: Short
Chart: View Setup
Status: Pending
Notes:
Daily Trend: Bearish structure in play
4H CP (Continuation Pattern): Formed after daily supply reaction
Clean bearish sequence – expecting continuation lower
Ideal scenario: price respects 4H CP zone and breaks to new lows
GPCHF ANALYSISOn gbpchf, we're in on a bearish market. we're looking at for a pullback to fibonacci levels, from anywhere between 71% to 100% for a continuation to the downside

GBP_CHF RESISTANCE AHEAD|SHORT|
✅GBP_CHF is going up now
But a strong resistance level is ahead at 1.1070
Thus I am expecting a pullback
And a move down towards the target of 1.1013
SHORT🔥
✅Like and subscribe to never miss a new idea!✅
Disclosure: I am part of Trade Nation's Influencer program and receive a monthly fee for using their TradingView charts in my analysis.

GBPCHF: Long Trade Explained
GBPCHF
- Classic bullish formation
- Our team expects pullback
SUGGESTED TRADE:
Swing Trade
Long GBPCHF
Entry - 1.1005
Sl - 1.0971
Tp - 1.1064
Our Risk - 1%
Start protection of your profits from lower levels
Disclosure: I am part of Trade Nation's Influencer program and receive a monthly fee for using their TradingView charts in my analysis.
❤️ Please, support our work with like & comment! ❤️


NNFX GBPCHF Short Full SignalSignal: GBPCHF Short — Full Signal
Context:Full Signal, price broke and closed below the zone signalling breakout
Probability: Normal - Buyer bias still exists.
Risk: 1% -> buyer bias flow in volume, strong signal breakout, other CHF long sentiment so reduce risk to potential split with AUDCHF breakout down the line. GBP short is potentially 3 days late from the original move in EURGBP
R:R Plan: Potentially 5R if range allows, 75% scale-out at TP for low probability & drawdown management.
Notes:
Took this trade due to its breakout nature and full signal from the judge fortress algo. Other GBP Short setups coming from EURGBP Long (late ranged) and AUDCHF short (pending order for continuation if breaks out) so I only put 1% risk on CHF Long to make room for AUDCHF 0.5% later if it breaks the pending order.

GBPCHF Sellers In Panic! BUY!
My dear subscribers,
This is my opinion on the GBPCHF next move:
The instrument tests an important psychological level 1.1095
Bias - Bullish
Technical Indicators: Supper Trend gives a precise Bullish signal, while Pivot Point HL predicts price changes and potential reversals in the market.
Target - 1.1111
About Used Indicators:
On the subsequent day, trading above the pivot point is thought to indicate ongoing bullish sentiment, while trading below the pivot point indicates bearish sentiment.
Disclosure: I am part of Trade Nation's Influencer program and receive a monthly fee for using their TradingView charts in my analysis.
———————————
WISH YOU ALL LUCK


GBPCHF Rising Wedge bearish breakout The GBP/CHF currency pair is currently exhibiting a bearish sentiment, aligned with the broader downtrend. Recent price action shows the market is in a sideways consolidation phase, indicating a potential pause before the next directional move.
Key Trading Level: 1.1230
This level marks a prior intraday consolidation zone and serves as a critical resistance area within the current trend context.
Bearish Scenario (on rejection from 1.1230):
A failed test of 1.1230 resistance would likely reinforce bearish momentum.
Downside support targets include:
1.1100 – Initial support
1.1050 – Next structural support
1.0980 – Long-term bearish target
Bullish Scenario (on breakout above 1.1230):
A confirmed breakout and daily close above 1.1230 would invalidate the bearish structure.
In that case, potential upside targets include:
1.1300 – Key resistance level
1.1370 – Higher resistance from previous reversal zones
Conclusion
The medium-term outlook for GBP/CHF remains bearish, with 1.1230 acting as a decisive pivot level. As long as price stays below this threshold, downside continuation toward 1.1100 and beyond remains favored. However, a clear breakout above 1.1230 on a daily closing basis would shift the sentiment and open the door for a bullish correction toward 1.1300–1.1370. Traders should monitor the 1.1230 level closely for directional confirmation.
This communication is for informational purposes only and should not be viewed as any form of recommendation as to a particular course of action or as investment advice. It is not intended as an offer or solicitation for the purchase or sale of any financial instrument or as an official confirmation of any transaction. Opinions, estimates and assumptions expressed herein are made as of the date of this communication and are subject to change without notice. This communication has been prepared based upon information, including market prices, data and other information, believed to be reliable; however, Trade Nation does not warrant its completeness or accuracy. All market prices and market data contained in or attached to this communication are indicative and subject to change without notice.

GBPCHF 11/06/2025Weekly:
-Bullish M pattern.
-Weekly support.
Daily:
-Inverse H&S pattern.
-Liquidity Sweep.
4H:
-Bullish M pattern.

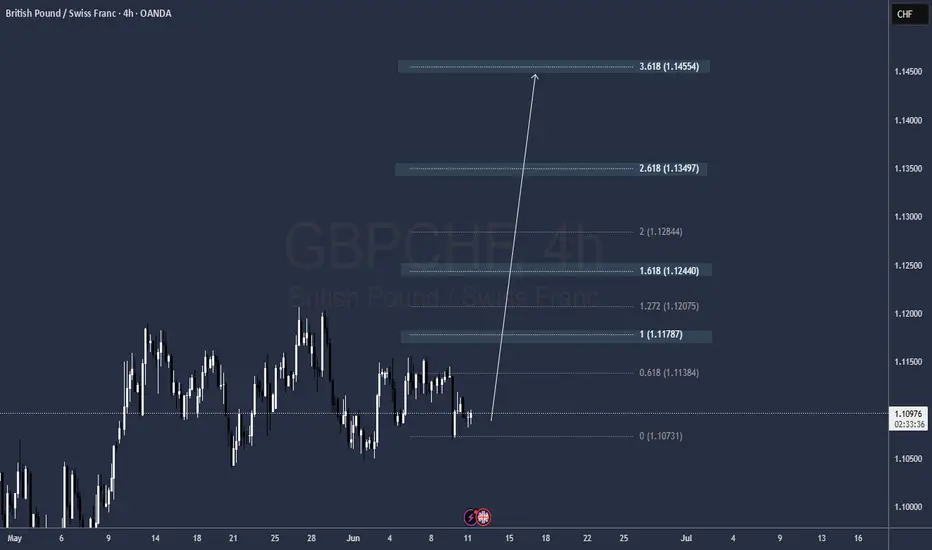
GBPCHF BULLISH OR BEARISH DETAILED ANALYSISGBPCHF is currently forming a clean bullish flag pattern on the daily timeframe, signaling a potential continuation of the recent impulsive move. After a strong rally from the April lows, price has entered a controlled consolidation just below the 1.12 resistance zone. This structure is typical of a market that’s building momentum before the next leg higher. With key support around 1.10 holding firm, this area becomes a crucial demand zone, and we are now looking for a breakout from this flag formation toward the 1.15 target.
From a fundamental perspective, the British Pound is gaining traction ahead of the UK general elections, with markets pricing in more political stability and fiscal clarity. On the other side, the Swiss Franc has weakened slightly due to the Swiss National Bank's relatively dovish tone and recent interventions aimed at softening CHF strength to support exports. This divergence in policy outlook adds momentum to the bullish GBPCHF narrative. Additionally, with UK wage growth remaining sticky and inflation still above target, the Bank of England is expected to delay aggressive rate cuts, further underpinning GBP strength.
Technical conditions align perfectly with the macro backdrop. The price is respecting the bullish structure, with higher lows forming consistently. The flag resistance around 1.1150 is being tested multiple times, indicating pressure is building for a breakout. Once that resistance is breached with volume confirmation, the bullish wave could accelerate rapidly toward the previous high near 1.15. RSI and MACD also support the continuation bias, both showing signs of renewed upside momentum.
As we head into the second half of June, GBPCHF is setting up beautifully for a trend continuation move. The flag pattern provides a high-probability technical setup with a favorable risk-to-reward ratio. As long as the 1.10 support holds, bulls remain firmly in control. Watch for a confirmed breakout over the 1.1150–1.12 range, which would likely trigger a sharp rally toward the 1.15 target and possibly beyond in the coming weeks.

GBPCHF may rise supported by FundamentalsGBPCHF may rise supported by Fundamentals
Today, the Swiss 10-year bond yield is near a 3-week high.
The Swiss 10-year government bond yield was near 0.40%, its highest level since May 20.
The latest Swiss CPI and GDP data increased the chances that the Swiss National Bank (SNB) will cut interest rates by 25 basis points at its next meeting.
Technical Analysis:
GBPCHF is gathering and is forming an ascending triangle pattern. Once the price breaks the top of the pattern at 1.1155, it should rise further and could reach 🎯 1.1190; 🎯 1.1230.
If it moves up from the current zone the first short term target will be at 1.1155
The first zone is very strong and could also act as a reversal zone and could push the price lower again, so be careful near that zone.
Targets:
🎯 1.1155
🎯 1.1190
🎯 1.1230
You may find more details in the chart!
Thank you and Good Luck!
❤️PS: Please support with a like or comment if you find this analysis useful for your trading day❤️
Disclosure: I am part of Trade Nation's Influencer program and receive a monthly fee for using their TradingView charts in my analysis.

GBP-CHF Wait For Breakout! Buy!
Hello,Traders!
GBP-CHF formed a bullish
Triangle pattern so we are
Locally bullish biased and
IF we see a bullish breakout
Our bullish bias will be
Confirmed and we will be
Expecting a further
Bullish continuation
Buy!
Comment and subscribe to help us grow!
Check out other forecasts below too!
Disclosure: I am part of Trade Nation's Influencer program and receive a monthly fee for using their TradingView charts in my analysis.

Potential Sell Continuation on GBPCHFReasons I think this pair will fall:
- Confirmed trend line broken on H4
- Price retested breakout candle
- Bearish RSI divergence on H4
- RSI was overbought on H4
- Price made a double top on H4
What do you think?
