British Pound/Chinese Renminbi Quote | Chart & Forecast SummaryKey Indicators On Trade Set Up In General
1. Push Set Up
2. Range Set up
3. Break & Retest Set Up
Notes On Session
# British Pound/Chinese Renminbi Currency Quote
- Double Formation
* (EMA Settings)) | Completed Survey
* 1 & 0.618 Area + Inverted Structure | Subdivision 1
- Triple Formation
* (Triangle Structure) & Long Set Up | Subdivision 2
* (TP1) | Subdivision 3
* Daily Time Frame | Trend Settings Condition
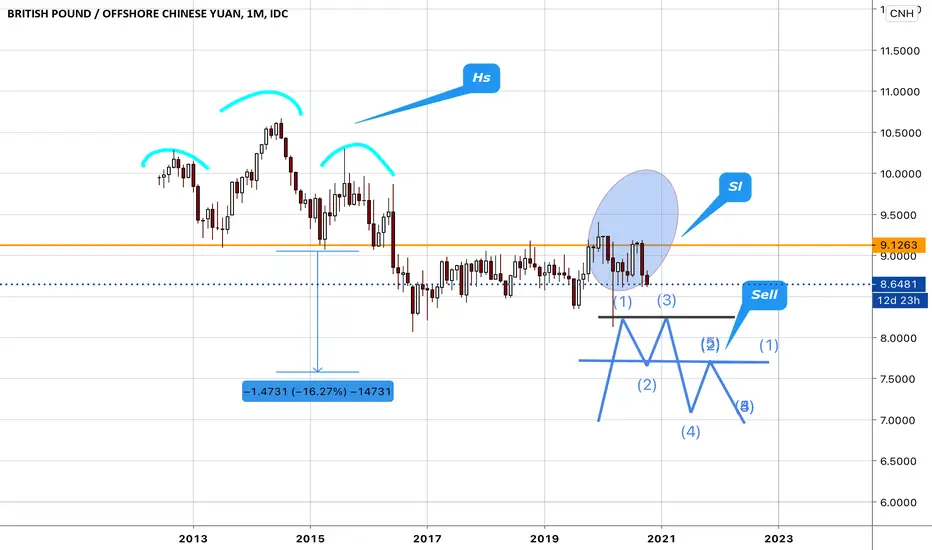
- (Hypothesis On Entry Bias)) | Indexed To 100
- Position On A 1.5RR
* Stop Loss At 9.16 CNH
* Entry At 9.40 CNH
* Take Profit At 9.80 CNH
* (Uptrend Argument)) & Pattern Confirmation
* Ongoing Entry & (Neutral Area))
Active Sessions On Relevant Range & Elemented Probabilities;
European-Session(Upwards) - East Coast-Session(Downwards) - Asian-Session(Ranging)
Conclusion | Trade Plan Execution & Risk Management On Demand;
Overall Consensus | Buy
GBPCNH trade ideas

Why "The 13 EMA System" Could Be The Best For 2024I started looking back on my trading ideas
to find clues on which trading strategy
-
could be the best to use during this market.
And the 13 EMA System has performed well so far
-
This strategy is one I recently developed about a month
ago, and even though I doubted its ability
I gave it a chance and decided to share it
-
as an idea right here on tradingview.
Now that I am from doing my personal research on
it.I think it's my favourite
-
Trading Strategy of 2024
so far..
-
Don't get me wrong I do like the Rocket booster
strategy as well but the 13 EMA System
is my backup strategy..mostly favourable in forex trading.
-
Look at the Bollinger bands
which has been adjusted to a 13 EMA
line in order to catch the undervalue of the price
-
Rocket boost this content to learn more.
-
Disclaimer: Trading is risky you will lose
money whether you like it or not
please learn risk management and profit-taking strategies.

GBP/CNH - New PositionI have added this pair in my portfolio as I spotted an entry based from my strategy.
What lies ahead with this pair merely depends on what the market will give me.
Ofcourse, I am hoping that the bias will be with me with this pair.
Stay tune for the outcome.

GBPCNH Rising wedgeOn the chart we can see a rising wedge formed after a downtrend.
We expect that downtrend resumes.
So we look for a break below the support line for short entry.
Target is shown on the chart.

HOW TO TRADE LIKE THEM GBPCNH (TRADE OF THE QUARTER) CONT daily Rejection on higher time frame left a daily triple top into a ranging rectangle pattern with a fake breakout at the high
That is rejected by the daily applied moving averages 50 100 and 200.
And a rejection of a pivot point (red line) back into the range.
Rectangle pattern with measured moves as price goes in and out the range in same direction
Bearish trendline formed out the range
How to trade to max size wait to price to retest range area with failure
Tips no matter the set only actually enter the market when price fails in the opposite direction in which you intend to enter in
HOW TO TRADE LIKE THEM-

HOW TO TRADE LIKE THEM GBPCNH(TRADE OF THE QUARTER CONT) weeklyAs we continue
The necktie rejection = head n shoulder on the weekly
The monthly double top second top mad a double top on the weekly which is also the monthly evening star
We have price trading under the 50ma and 100ma
With rejection of the 200ma as this ma is use for market direction on the higher frames so price just became bearish.
HOW TO TRADE LIKW THEM-

HOW TO TRADE LIKE THEM GBPCNH (TRADE OF THE QUARTER) MONTHLYAlright the trade of the ending year 🤷🏾♂️ Maybe not in pip target but in presentation and potential to continue yes.
First let understand this is a newly added pair to forex which means the freshness of the market is ideally a great invest opportunity if we trade like them as the initial market direction is what will be the direction for some time. So after watch this pair this is what we have
Now on saxo charts we can see how the initial candle started and we see the pair started in an straight uptrend so we have a valid hs formed as the top of this chart
From the necktie we has established resistance
1. Priced formed an upwards ranging channel that was rejected at the necktie
2. This rejection is the .5 retrace of point 3 and .6 of 4. Thus confirming higher rejection with Fibonacci
3. This rejection formed a double top
4. The second high of the top failed to reach upper channel
5. This failure is an evening star
6. Price is trading at low of channel
7. Rejection of 50ma at this low
Thus we take the measured move from the high into the channel project it out the channel with a mental target at pivot support level 4.
As the nature of the pair we are expecting price to continue bearish after this target .
Will continue on down the time frames
HOW TO TRADE LIKE THEM-

HOW TO TRADE LIKE THEM - TRADE WITH THE BANKS FOREVER So a hiding gem is the bank saxo, where with them you can get the oldest documented digital graph of a pair. This allow us to see where the initial Money was placed..
So we see where the money was added. we see trillions of dollars added and stopped at these two levels so you better believe these are the extremes of the pair
Note he have a peak as a high. This high is the boundary of the pair thus the highest they will allow price to go currently . But what’s important here is that traditionally we can expect price to test this high or attempt before it decline . Also this give us the direction of the pair as cnh will be dominated so
So with this in mind we can place a pinned sale order at the low of the high with a sl above the high or even if we don’t snag the top we know now we can just wait for a bullish failure on the monthly and enter a short position. and really trade with the banks .. just make sure you start to cut me in on all the trades i send u or I’ll karma find you!! Cuz this one his is a Gold mine
HOW TO TRADE LIKE THEM-

HOW TO TRADE LIKE THEM -TRADE WITH THE BANKS PART2Yes from the pervious post I’d explained what is going on here for free cus I want all to win as it’s enough money to change everyone’s life
Now let’s talk about those entries as entries are the hardest.
So ideally we want to see price go back and touch the high please see the first post but we have to be ready for that move to not take place as well. So the more feasible entry is the second method yet tbh that method is playing out currently so I’ll be entering this market for sure ceasing other trades for this home run.
Now I said what to look for on that other post
What we have is that high being a hs pattern as it was made from the high of the market so this validates the pattern. So with these we want to see a retest at the necktie to confirm the downtrend and we have that
Also from that resistance line we have a double top formed years later thus this confirmed the motive to continue it selling so we may not get the sell at the highest but we can get in at this next high and sell here as price will only go lower and by being so high up in the graph we have great confidence that our entry will hold over the years
So as we seen the failure at the hs necktie we wait for the same at the double top necktie n sell this joint
HOW TO TRADE LIKE THEM -
HOW TO TRADE LIKE THEM GBPCNHMonthly we see a double diamond with respect to a bearish trendline with a rejection.
Price is currently below the necktie thus pass the necktie fake out also fakeout are harder to take place on the higher timeframes..
Note overall the rsi doesn’t show higher highs on the test of the trendline so a bearish cont is in question .But trading the pattern more so is the forecast as we can expect price to measures the right leg of the pattern as a target and we are looking for a test of the low wick as target 2 WITH OVER 2K PIP FROM ENTRY
HOW TO TRADE LIKE THEM

GBPCNH: time to go upAs can be seen, the price has been falling for a while. Now, the price entered a platform where the Bollinger Bands also shrunk. So, where would the price go after that?
The Bollinger Bands shows a signal that the price would break out in the near future.
So, what could this big change be?
Let’s take a look at other signals.
First, the MACD is in an upward trend, so does the RSI, which means that they are showing bullish signals.
Next, let’s see the Fib I made. The platform is just at the level below 0.236, which means there could be a potential to go up.
Let’s expect the price to go up

GBPCNHpreviously went short on this and still am. have 2 positions in this trade at the moment. I was expecting an ABCD patters on the overall picture but realised the inner head and shoulder is also about to play out. looking at charts we see the inner right shoulder forming and also lining up with the left shoulder on supply zones confluent with 61.8% levels where the left shoulder meets. targets for this is -127% lining up with the over all neck line of the weekly left shoulder.... also on the over all weekly price has had a break out and fib sequence to fall well on 61.8% retracement levels.


What has education got to do with Property ? www.scmp.com
Apparently, a lot more than what I thought! The news about Chinese families sending their children to study overseas is old news but to the point of driving the property prices in UK, Canada, Australia have both its proponents and opponents view.
As parents, who would not want their children to receive better education and have exposure to a better English speaking environment ? Even better, if the tuition fees paid for the children's education can be offset by the property prices when they graduate. It seems like a win-win situation to me.
Out of interest, I take a look at the monthly chart and this is what I see.
Option 1 : Price is likely to go upwards to hit the upper blue channel line and then retrace downwards (follow the white line). The overall trend is still bearish. And if it falls, could it reach the lowest point of 2017 at 8.08?
Option 2 : Price moves towards the upper blue channel line and breakout. It retraces a little and continue its upward surge towards 9.6665 which is the 618 FIB level. Point to note : This breakout from channel is not 100% true as I had seen many times in Gold and other charts that it is nothing but a mere fake breakout, a move to lure the retail buyers to go long and the big boys take advantage to sell down hard.
Currently, the day chart is showing bullish momentum with price closing above 21EMA and if one look closely at the candles on the monthly chart, there are many bullish engulfing candles in it - 01/11/16, 01/03/17 and 01/09/17 (so happens it all coincides with the 1st day of the month). The possibility of the current price, 8.78 moving towards the 9.00 zone is high. Thereafter, one needs to monitor the price action to determine the next course of action. Watch out for the ascending wedge pattern - if there are signs of price breaking down, that means Option 1 is in place.
As usual, check the spread of this pair, trading hours, etc if this is not already in your portfolio. Start small to test your idea and work your way up to a bigger position size if the price action is moving in accordance to your plan. I have learnt from past mistakes not to "show hand" too fast like in a casino and be in a position of low cash/chips to play the next game. Remember, the last person standing may not necessarily be the one who bet the heaviest at the start. The need to prove ourselves right can be a fatal mistakes as I had in the past. So Mr Market is like the casino, they are always there, like the 7-11 slogan - always close but never closed. So, unless you have the "luck factor" all the time, it is prudent to go small, win a little or lose a little and learn from it than to go big and lose it all. We are trading with our money , not our ego, so be humble and have a willing heart to learn and Mr Market will reward you in due course.

GBPCNH BUY LONG GARTLEYLOOK FOR REVERSAL SIGN IN PRZ-POTENTIAL REVERSAL ZONE
RSI DIVERGENCE + HAMMER CANDLE ARE ONE OF THEM
RSI OVERSOLD LOOKING FOR NORMALIZATION
GARTLEY WITH BETTER ENTRY AT 0,886 AFTER CROSSING 1,27 AB EXT


GBPCNH watch for a buy setup.Hi friends, hope you are all having a good week of trading.
I have seen a good setup here at the lows of the range after a corrective structure, where I expecting a breakout of the corrective structure before the move up. It could retest structure top as resistance turned support before the move up.
Best,
Tom_Killick.

GBPCNH structure longHi guys,
The GBPCNH looks good for a buy. Wait patiently for price to pull back to the structure and watch for buy setup.
Thank you for your support.

GBPCNH sell set upHi guys,
The pair GBPCNH looks like it will have one more move down.
Thank you for your support.

GBPCNH-Update: Take Profits, Weakness Seen! #ForexTraders,
Update on trade: Moving extremely well to the upside since I last posted the pair (See related ideas). It's time to take profits here for the time being since the trend is weak.
Previous analysis: The trade is in a nice 3 wave cyclic move since buying at the bottom. There was a nice bullish leg, followed by a corrective bear leg, offering a morning star signal for a continuation move to the highs of the range. The morning star was offered on Fib retracement, giving a nice reliable launch pad for an upside move. Expecting the extended target for this pair to be the 3 wave minor move. Before taking profits on this position.
I hope you have a tested trading strategy to trade this move when it starts
Thanks for your support

GBPCNH-Update: Strong Upside, Hold To 3 Wave Target! #ForexTraders,
Update on trade: Moving extremely well to the upside since I last posted the pair (See related ideas).
The trade is in a nice 3 wave cyclic move since buying at the bottom. There was a nice bullish leg, followed by a corrective bear leg, offering a morning star signal for a continuation move to the highs of the range. The morning star was offered on Fib retracement, giving a nice reliable launch pad for an upside move. Expecting the extended target for this pair to be the 3 wave minor move. Before taking profits on this position.

GBPCNH-Update: Strong Upside, Hold Position #ForexTraders,
Update on trade: Moving extremely well to the upside since I last posted the pair (See related ideas). Lots of pips have been made.
Strong bullish candlesticks showing a clear rounded bottom/accumulation at the lows of the range. Price hit long term Fibonacci extension expiry level before accumulation formed. Price has shown a nice shift from bear to bull demand, and a breakout of the rounded bottom range is about to occur. Nice upside to be seen.

GBPCNH: Bulls Around, Bears Swiped, Upside #ForexTraders,
Strong bullish candlesticks showing a clear rounded bottom/accumulation at the lows of the range. Price hit long term Fibonacci extension expiry level before accumulation formed. Price has shown a nice shift from bear to bull demand, and a breakout of the rounded bottom range is about to occur. Nice upside to be seen. I hope you have a tested trading strategy to trade this move when it starts
