DAILY CLOSE ABOVE D50 EMA - EURGBP LONG FORECAST Q2 W23 D3 Y25
EURGBP LONG FORECAST Q2 W23 D3 Y25
Professional Risk Managers👋
Welcome back to another FRGNT chart update📈
Diving into some Forex setups using predominantly higher time frame order blocks alongside confirmation breaks of structure.
Let’s see what price action is telling us today!
💡Here are some trade confluences📝
✅Daily close above Daily 50EMA
✅15' order block
✅Intraday breaks of structure
✅Tokyo ranges to be filled
🔑 Remember, to participate in trading comes always with a degree of risk, therefore as professional risk managers it remains vital that we stick to our risk management plan as well as our trading strategies.
📈The rest, we leave to the balance of probabilities.
💡Fail to plan. Plan to fail.
🏆It has always been that simple.
❤️Good luck with your trading journey, I shall see you at the very top.
🎯Trade consistent, FRGNT X
GBPEUR trade ideas

EURGBPEURGBP price is near the support zone 0.83605-0.83262. If the price cannot break through the 0.83262 level, it is expected that in the short term there is a chance that the price will rebound. Consider buying the red zone.
🔥Trading futures, forex, CFDs and stocks carries a risk of loss.
Please consider carefully whether such trading is suitable for you.
>>GooD Luck 😊
❤️ Like and subscribe to never miss a new idea!

EUR_GBP SHORT FROM RESISTANCE|
✅EUR_GBP is going up now
But a strong resistance level is ahead around 0.8465
Thus I am expecting a pullback
And a move down towards the target at 0.8425
SHORT🔥
✅Like and subscribe to never miss a new idea!✅
Disclosure: I am part of Trade Nation's Influencer program and receive a monthly fee for using their TradingView charts in my analysis.

EURGBP Wave Analysis – 2 June 2025
- EURGBP broke daily Falling Wedge
- Likely to rise to resistance level 0.8525
EURGBP currency pair recently broke the resistance trendline of the daily Falling Wedge chart pattern from April, which encloses the earlier ABC correction (2).
The breakout of this Falling Wedge continues the active impulse wave (3), which started earlier from the key support level 0.8350.
EURGBP currency pair can be expected to rise to the next resistance level 0.8525 (which reversed the price twice at the start of May).

EUR/GBP at a Tipping Point: Key Demand Zone or Breakdown Ahead?The EUR/GBP cross is currently trading in a key technical area, hovering around 0.8427, showing signs of mild recovery after a bullish reaction from a previously tested demand zone.
📊 Technical Analysis
Price action reveals a compression phase within a descending channel (corrective flag), followed by a breakout to the upside last week. Price reached the supply zone between 0.8480 and 0.8535, which triggered a strong bearish candle rejection.
Currently, the pair is testing support around 0.8400–0.8380, a level previously defended by buyers.
The RSI bounced from oversold territory, suggesting the potential for a consolidation phase or sideways movement, rather than a clear divergence.
📌 Key Levels
Dynamic Resistance: 0.8480 – 0.8535
Structural Support: 0.8380 – 0.8285
Upside breakout target (if momentum builds): 0.8660
📅 Seasonality
Historically, June tends to be slightly bullish for EUR/GBP, especially on the 5-year and 10-year seasonal patterns. Curves indicate upward pressure between the second and third weeks of the month, suggesting that any retracement could present a seasonal long opportunity.
💼 COT Report
Euro FX
Non-Commercials reduced both longs (-1.7K) and shorts (-6.7K) → signaling indecision or rebalancing.
Net positioning remains positive, but momentum is fading.
British Pound
Non-Commercials added significantly to longs (+14.2K) and slightly to shorts (+2.8K) → GBP is attracting bullish interest.
This could reduce upside pressure on EUR/GBP in the short term.
Overall, COT data currently favors the British Pound in the near term.
📈 Retail Sentiment
Retail traders are heavily skewed to the long side (74% long), which may create contrarian downside pressure if the market moves against the crowd. The average entry price is around 0.8481, meaning many traders are currently underwater.
🎯 Conclusion & Bias Outlook
Short-term bias: Neutral to bearish down to 0.8380
Mid-term bias: Moderately bullish if price holds above 0.8380 with higher lows confirmation
Ideal long entry could emerge from a retest of 0.8380 with bullish confirmation (candlestick or RSI support)
Alternatively, a clear H4 close below 0.8380 could open space down to 0.8280

possibility of uptrendThe price is expected to pass the resistance area according to the specified path and continue the upward trend to the resistance levels.
If the red support area is broken, the continuation of the downward trend is likely.

DAILY HOT PICK HTF 50 EMA'S -EURGBP SHORT FORECAST Q2 W23 D2 Y25🔥👀TECHNICAL HOT PICK OF THE DAY
EURGBP SHORT FORECAST Q2 W23 D2 Y25
Professional Risk Managers👋
Welcome back to another FRGNT chart update📈
Diving into some Forex setups using predominantly higher time frame order blocks alongside confirmation breaks of structure.
Let’s see what price action is telling us today!
💡Here are some trade confluences📝
✅Weekly order block
✅15' order block
✅HTF 50 EMA'S
✅Tokyo ranges to be filled
🔑 Remember, to participate in trading comes always with a degree of risk, therefore as professional risk managers it remains vital that we stick to our risk management plan as well as our trading strategies.
📈The rest, we leave to the balance of probabilities.
💡Fail to plan. Plan to fail.
🏆It has always been that simple.
❤️Good luck with your trading journey, I shall see you at the very top.
🎯Trade consistent, FRGNT X

EUR/GBP LONG POSITION TERMEUR/GBP – In case of a breakout above the descending trendline, the potential targets are illustrated on the chart. A confirmation of the breakout should be supported by bullish price action and strong bullish candlestick formations on the 4-hour timeframe.

Double top Have split my entry on this as it was an over the weekend signal. Sometimes low liquidity on the Asian session requires of the market markers to generate liquidity, so they can get in size.

EURGBP Weekly Analysis (MMC) – Structure Mapping & Target🧠 Market Structure Overview:
The current EURGBP structure is a textbook example of Market Mapping Cycle (MMC) behavior—where price progresses through accumulation, breakout, manipulation, and eventual rebalancing. The pair has completed a liquidity sweep and is on its final leg toward a defined reversal target zone.
🔹 Phase 1: Accumulation Within Channel
From August to late December 2024, EURGBP traded inside a descending channel.
This move created an illusion of bearish control, but careful observation reveals it was a liquidity engineering setup.
Institutions were accumulating beneath key swing lows, marked by equal lows and multiple false breaks.
The “Previous Channel Structure” identified on the chart is crucial—it acted as a bear trap and formed the base of the MMC curve.
🔹 Phase 2: Break of Structure (BOS) and Smart Money Entry
In early January 2025, the market broke structure with strong bullish candles.
This Major BOS was the first signal of institutional engagement, shifting the structure from distribution to accumulation phase.
After the BOS, price tested the breakout level, forming a curve support (MMC's bullish arc structure).
This is where smart money typically adds positions on retracement.
🔹 Phase 3: Liquidity Sweep & Acceleration
In March 2025, EURGBP dipped sharply, triggering a liquidity sweep below prior lows.
This fakeout move was a classic manipulation phase—clearing late buyers before a fast reversal.
Price rejected strongly from the curve support, confirming the MMC continuation.
🔹 Phase 4: Expansion Toward MMC Target
The market moved vertically, respecting the MMC curve structure and 50% retracement zone of the last impulse (noted on the chart).
This movement shows momentum expansion, typical of MMC Phase 3.
Price is now rapidly approaching the Target + Next Reversal zone at 0.86800–0.87200.
🔻 What to Expect Next:
The Target Zone aligns with multiple confluences: supply imbalance, psychological round number, and prior liquidity void.
Expect strong reaction or reversal from this zone.
Confirmation is needed before shorting, ideally via:
Lower Timeframe Break of Structure (LTF BOS)
Bearish divergence or volume exhaustion
Candlestick rejections (e.g., bearish engulfing, pin bars)
📈 Summary of Key Technical Elements:
Concept Observation
MMC Phase Expansion (Phase 3)
Liquidity Sweep March 2025 – below prior support
BOS (Break of Structure) Early 2025 bullish breakout
Current Bias Bullish until 0.8700 zone
Reversal Potential High at MMC Target + Supply Zone
📚 Educational Note:
This analysis follows the Market Mapping Cycle (MMC) method—a higher-level view of Smart Money Concepts. By studying price curves, liquidity zones, and psychological areas, traders can anticipate market behavior before traditional indicators catch up.

EURGBP - Swing trade IdeaHi everyone !!
The EURGBP shows a bullish momentum after tapped and rejected at 88.6% Fib level and MACD bullish sign on daily timeframe.
And also breaks the 4Hr downtrend price action such as Inducement, BOS and created CHOCH on 4HR, I would like to buy when the price retest the 4hr OB and Key level 0.83800
Below is my trade setup, please do your own analysis before taking any trades.
Buy limit order
Buy @ 0.83800
SL - 0.83540, 26Pips
TP1 - 0.84060 (Set to breakeven once TP1 is hit or Trail SL below to new LL)
TP3 - 0.84580
Final TP5 - 0.85100
RR 1:5
Cheers !

EUR-GBP Resistance Ahead! Sell!
Hello,Traders!
EUR-GBP made a nice
Rebound from the support
Level below just as we predicted
In our previous analysis and is
Growing nicely but the pair
Will soon hit a horizontal resistance
Level of 0.8460 from where
A local bearish correction
Is to be expected on Monday!
Sell!
Comment and subscribe to help us grow!
Check out other forecasts below too!
Disclosure: I am part of Trade Nation's Influencer program and receive a monthly fee for using their TradingView charts in my analysis.

EURGBP Potential Buy Setup: Mixed Signals Require Caution📉 Overview from Weekly Timeframe
The weekly chart presents a mixed scenario. While recent price action shows bullish intent, the presence of strong resistance and the 50EMA overhead suggests limited upside potential unless a clear breakout occurs. ⚠️ Patience is needed as bias is not fully aligned.
📅 Daily Chart Explanation
The daily timeframe shows some bullish price action, but structure and EMA alignment remain bearish. This suggests that any bullish move could be short-lived unless there's a structural shift or EMA crossover to confirm momentum.
⏳ 4H Chart Explanation
The 4-hour chart shows early signs of a trend reversal — higher highs and some bullish push. However, this move is still counter-trend when compared to the higher timeframes. Risk is high as there's no confluence yet from daily or weekly charts.
📌 Plan
Bias: Cautious Bullish
Entry: Only upon clear 4H structure break + retest (with confluence from price action)
Targets:
TP1: Near recent 4H swing high
TP2: Just below weekly resistance / 50EMA zone
Invalidation: If price breaks below the recent 4H higher low, or shows bearish engulfing at resistance zone

EURGBP H1, sell opportunityOn EURGBP H1, we have a nice bearish divergence. This is usually a signal of loss of bullish momentum and increased probability of correction. On H4 we have a clearly sell trend.
What do you think? :)

Expect a profitable EUR/GBP trade shortlyIf a candle closes above 0.84560, enter a buy position at the opening of the next candle, targeting a take profit at 0.84957. Otherwise, enter a sell position with a take profit target at 0.83798.
Good luck!

EURGBP – transitioning from bearish to bullish .. week of 02 JunIt appears that the bearish move that began in April may have ended now. Price that mostly stayed under the 50ema has crossed over to the other side. The downward trendline has also been broken with price moving above it. We already have a higher high and higher low in place. Aggressive traders can take a long now, but I want to be more conservative these days. I would like to see:
a break above the recent swing high (0.8459).
another sequence of HL and HH.
and a retest of the minor resistance/support at 0.8459.
Even with all these precautions, we can still get a +2.3R trade. If PA continues to develop as per my analysis, I will monitor on lower time frames to find more confluence and bullish evidence before committing to a trade. My initial target will be the region just before the swing high at 0.8623.
This is not a trade recommendation; it’s merely my own analysis. Trading carries a high level of risk so carefully managing your capital and risk is important. If you like my idea, please give a “boost” and follow me to get even more.

EURGBP Megaphone bottom. Strong buy opportunity.The EURGBP pair is trading within a Bullish Megaphone since the start of the year. For the past 2 weeks it has been ranging within the 1D MA50 (blue trend-line) and 1D MA200 (orange trend-line).
This is technically the bottom formation of the pattern on its new Higher Low, as the 1D RSI has been printing the same sequence as February's which priced the previous Higher Low.
We are expecting at least a Resistance 1 test at 0.87400.
-------------------------------------------------------------------------------
** Please LIKE 👍, FOLLOW ✅, SHARE 🙌 and COMMENT ✍ if you enjoy this idea! Also share your ideas and charts in the comments section below! This is best way to keep it relevant, support us, keep the content here free and allow the idea to reach as many people as possible. **
-------------------------------------------------------------------------------
Disclosure: I am part of Trade Nation's Influencer program and receive a monthly fee for using their TradingView charts in my analysis.
💸💸💸💸💸💸
👇 👇 👇 👇 👇 👇

EURGBP Bullish Structure Analysis – Channel Breakout + Target🧱 1. Market Structure Breakdown
EURGBP has been trading within a descending channel, forming consistent lower highs and lower lows, which indicates a short-term bearish trend. However, price action recently broke out above the upper boundary of this channel, suggesting a potential bullish reversal or trend correction.
This breakout marks a significant structural shift in market behavior.
🔵 Old Structure: Bearish, confined within the channel
🟢 New Structure: Bullish breakout above trendline + key resistance zone
🧩 Implication: Change in directional bias; potential for long opportunities
📍 2. Breakout Confirmation
The breakout was confirmed by:
A strong bullish impulse candle that closed above the descending trendline
Price sustaining above previous resistance (~0.8405)
Increase in bullish volume at the breakout point (if volume indicator is used)
This suggests that the breakout is genuine, not a false spike or liquidity grab.
🌀 3. Retest Phase – The Critical Zone
After breaking out, the market is now pulling back to retest the previous structure. This is a textbook price action move:
🔄 What’s Being Retested?
✅ Upper boundary of the descending channel
✅ Major horizontal support/resistance zone (~0.8405–0.8415)
✅ Broken trendline from previous lower highs
✅ QFL base (Quasimodo level that was swept)
✅ 50% Fibonacci retracement of the breakout move
This zone forms a multi-level confluence area, making it a strong support for potential long entries.
🔍 4. Key Technical Observations
Element Description
📐 Descending Channel Defined the prior bearish structure. Breakout invalidates this bias.
🧱 Trendline Retest Acts as dynamic support; price currently sitting on it.
🔃 SR Flip Zone Old resistance (~0.8405) turned into support—critical level.
📊 Fib 50% Retracement Provides technical alignment with potential buying interest.
📌 QFL/Order Block Zone Historical demand was swept and now being respected again.
🎯 5. Target Levels & Trade Plan
If the structure holds and the price responds bullishly from the current zone, the next levels of interest are:
✅ Primary Target – 0.8460
A clear supply/liquidity zone from previous structure highs
Also aligns with psychological round number and Fib extension
⚠️ Interim Target – 0.8430
Previous intra-channel resistance level
May serve as a short-term reaction point
❌ Invalidation Level
A clean break and close below 0.8390 would invalidate the breakout structure
This would reintroduce bearish pressure and signal a potential fakeout
🧠 6. Trade Idea (Not Financial Advice)
Entry: Around 0.8405–0.8415 on bullish confirmation (e.g., engulfing candle, pin bar, break of minor downtrend)
Stop-Loss: Below 0.8390 (beneath structure & invalidation point)
Take-Profit 1: 0.8430
Take-Profit 2: 0.8460
This offers a high R:R opportunity if managed with proper confirmation.
🧭 7. Risk Management & Considerations
Avoid entering prematurely without a bullish signal (e.g., pin bar, engulfing, RSI divergence).
Monitor macroeconomic news—especially from BoE or ECB—as they can disrupt technical setups.
Scaling into the position or using a split TP strategy can help protect profits.
✅ Conclusion
This EURGBP setup is a textbook case of market structure trading:
A well-defined channel breakout
Followed by a clean pullback to structure
With confluence across horizontal, diagonal, and Fibonacci levels
If price respects this zone, bulls could drive toward 0.8460, offering a solid opportunity for traders who understand structure-based setups.
📌 Always wait for confirmation—structure gives us context, but entries need price action signals to minimize risk.

EURGBP forex swing trade playing out off weekly demand levelThe EURGBP forex swing trade playing out off weekly demand level as expected. I hope you are taking advantage of this investment opportunity. There is a lot of profit for margin for this Forex cross pair.

Uptrend It is expected that a trend change will take place within the current support range and we will witness the start of an upward trend. Otherwise, the correction trend will continue to the specified support levels. Then there is a possibility of a trend change.

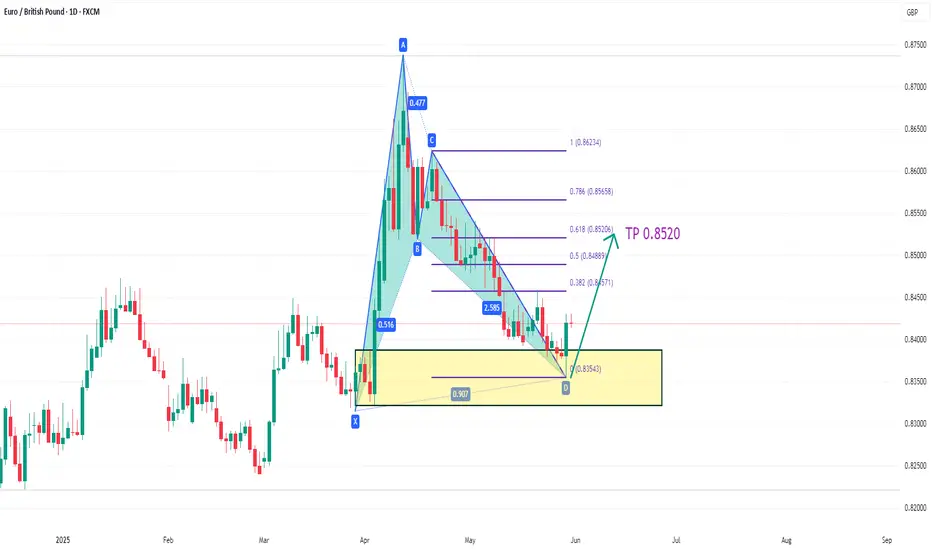
EURGBP Upside target 0.8520On the daily chart, EURGBP stabilized and moved upward after testing the previous demand zone, forming a bullish bat pattern in the short term. Currently, attention can be paid to the support near 0.8400. If it stabilizes after a pullback, you can consider going long, and the upward target is around 0.8520.
EURGBP LONGEURGBP LONG SETUP.
Looking at a EURGBP LONG over the next couple of days.
We have entered into a daily demand zone and had a lovely rejection into it and a push away. Check out the 60m chart for this one, leaves a lot of good price action imbalanced below.
Plan will be to wait for price to retrace back into the Demand zone at 0.83809 stops below the 60m demand zone created.
I will be paying close attention when it does come back down as it may react from daily demand high, because I'm half convinced that I'll end up missing the trade if it did retrace but just not quite far enough to the demand zone on the 60m but hey ho we'll see.
E : 0.83809
SL : 0.83699
TP : 0.87374
But I will be trailing stop at each of the steps created on the way up.

