EURGBP ShortEURGBP is now net short on the regression break.
I am considering all USD cross and EUR Cross. I have not made up my mine at this point.
GBPEUR trade ideas

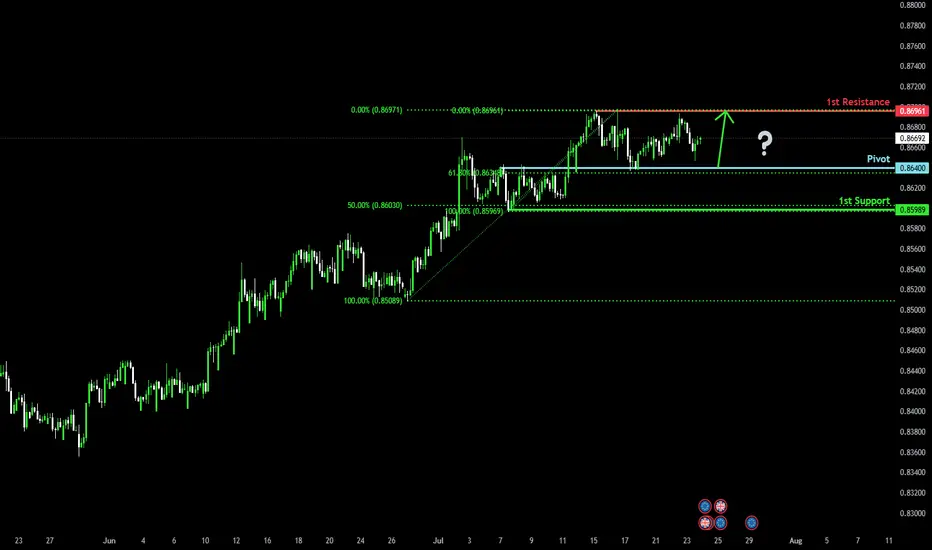
Bullish bounce off overlap support?EUR/GBP is falling towards the pivot, which has been identified as an overlap support and could bounce to the 1st resistance, which acts as a swing high resistance.
Pivot: 0.8640
1st Support: 0.8598
1st Resistance: 0.8696
Risk Warning:
Trading Forex and CFDs carries a high level of risk to your capital and you should only trade with money you can afford to lose. Trading Forex and CFDs may not be suitable for all investors, so please ensure that you fully understand the risks involved and seek independent advice if necessary.
Disclaimer:
The above opinions given constitute general market commentary, and do not constitute the opinion or advice of IC Markets or any form of personal or investment advice.
Any opinions, news, research, analyses, prices, other information, or links to third-party sites contained on this website are provided on an "as-is" basis, are intended only to be informative, is not an advice nor a recommendation, nor research, or a record of our trading prices, or an offer of, or solicitation for a transaction in any financial instrument and thus should not be treated as such. The information provided does not involve any specific investment objectives, financial situation and needs of any specific person who may receive it. Please be aware, that past performance is not a reliable indicator of future performance and/or results. Past Performance or Forward-looking scenarios based upon the reasonable beliefs of the third-party provider are not a guarantee of future performance. Actual results may differ materially from those anticipated in forward-looking or past performance statements. IC Markets makes no representation or warranty and assumes no liability as to the accuracy or completeness of the information provided, nor any loss arising from any investment based on a recommendation, forecast or any information supplied by any third-party.
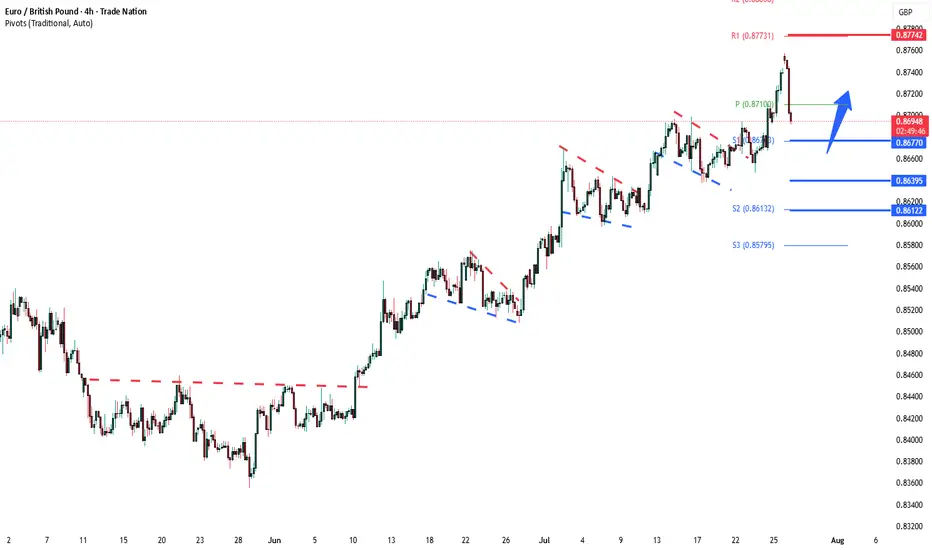
EURGBP CONTINUING BULLISH TREND STRUCTUREEURGBP CONTINUING BULLISH TREND STRUCTURE IN 4H TIME FRAME.
Price is currently in a secondary trend.
Price is expected to end the secondary trend and start primary trend again.
On higher side market may hit the targets of 0.87400
On lower side 0.85950 may act as a key support level.

Sell eurgbpStrong sell expected as euro ready to weak across all cross pairs
Weekly daily overbought pair
Ready for the bearish correction

EURGBP Is Rising Further After UK Retail Sales missed estimatesEURGBP Is Rising Further After UK Retail Sales missed estimates
EURGBP already broke out from an Ascending Triangle pattern after it spent some time in accumulation and without direction the price is rising today.
This is the third and clear bullish pattern that EURGBP broke out and the chances to rise one more time are high.
K retail sales is supporting this bullish movement because they failed to meet expectations.
Overall, the data was higher compared to the last month, but the fact that it missed expectations suggests that the UK economy is growing in small steps.
You may find more details in the chart!
Thank you and Good Luck!
PS: Please support with a like or comment if you find this analysis useful for your trading day
Disclosure: I am part of Trade Nation's Influencer program and receive a monthly fee for using their TradingView charts in my analysis.

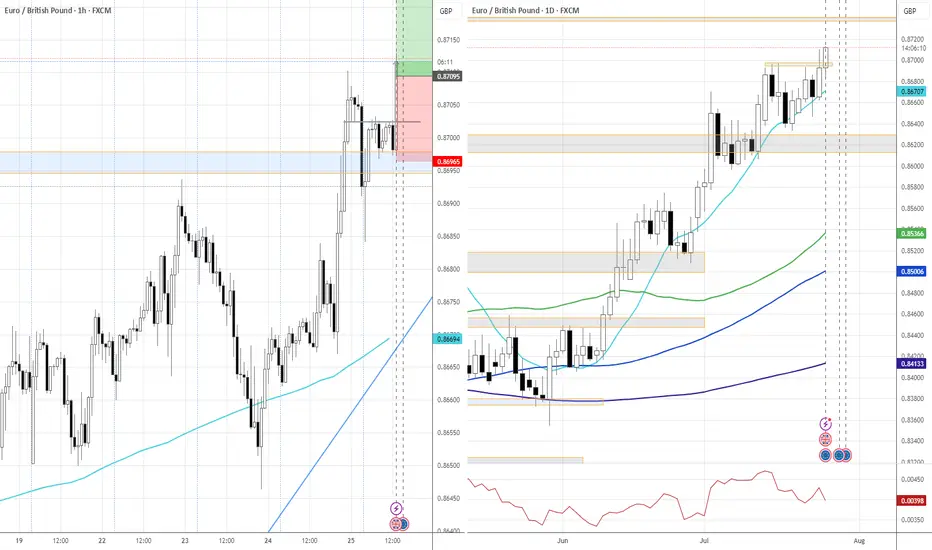
EUR/GBP OUTLOOK ON THE DAILYOn the daily timeframe, price retested a key resistance zone on Friday, which was previously tapped in April. This level originally acted as a demand area back in November 2023.
After the April rejection, price dropped approximately 381 pips before beginning its current bullish incline. As of now, price is retesting this resistance area, which is expected to flip into support to allow for continued upward momentum.
My bias remains bullish as long as this support holds, with a target toward the next demand area from March 2023.
However, a break below the daily swing low at 0.85963 would invalidate this scenario and shift the structure.
⚠️ As always, trade responsibly — risk only 1–2% of your capital per day and stay alert, especially around volatile sessions.
Stay sharp and trade safe!

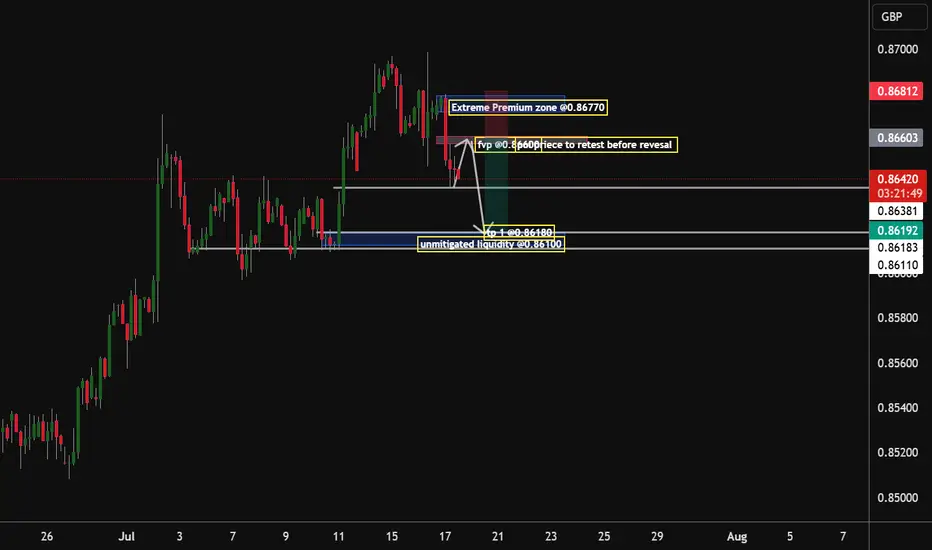
Eur/Gbp Bears to seek the 0.86180 Handle By early next week, my analysis according to the market structure being formed suggests that the institution that drives the market will have to be dovish on this pair, as there is unmitigated liquidity awaiting to be grabbed @ the 0.86100 zone by the end of next week will have to see that zone being mitigated
Tp 1.0.86180
EUR/GBP sell opportunity confirmed!EURGBP plummeted over 0.76% today from its high. It’s now confirmed that we could experience a correction on the weekly high. A sell opportunity is envisaged from the H4 timeframe.

DeGRAM | EURGBP exited the channel📊 Technical Analysis
● Breakout: price burst from the July descending wedge, reclaimed 0.8695 former cap, and is now riding a steep intraday channel of higher-highs; the channel mid-line aligns with the broken wedge roof, adding fresh support.
● A pennant is consolidating just above 0.8695; its measured pole and the outer channel top converge at the next horizontal barrier 0.8739.
💡 Fundamental Analysis
● Softer UK July composite-PMI (47.9 vs 50.2 prior) revived BoE cut bets, while ECB speakers flagged “premature to talk easing,” narrowing the rate gap in the euro’s favour.
✨ Summary
Long 0.8695-0.8705; pennant break targets 0.8739. Bias void on a 30 m close below 0.8648.
-------------------
Share your opinion in the comments and support the idea with like. Thanks for your support!

Do you agree with a big profit in EURGBP?Hi my dears
The pattern seems to be broken, so let's go up.
Join me with a guaranteed profit.
If you liked my analysis, please support my page.

$EURGBP rade Setup: EURGBP – Buy Opportunity Identified We haveOANDA:EURGBP rade Setup: EURGBP – Buy Opportunity Identified
We have spotted a favorable buying opportunity on the EURGBP currency pair, supported by technical patterns and recent market behavior.
EURGBP is showing signs of a bullish reversal after bouncing off a short-term support zone near the 0.86680–0.86700 range.
The entry at 0.86786 offers a strong technical position, just above the support, and aligned with the start of a potential upward swing.
The first target of 0.86850 is modest but strategically placed to lock in quick intraday profits while confirming the upward move.
The first target of 0.86850 is modest but strategically placed to lock in quick intraday profits while confirming the upward move.
The second target at 0.86980 sits at a prior resistance level, which has historically triggered pullbacks—an ideal mid-term objective.
The third and final target at 0.87100 aligns with a significant psychological resistance zone, offering a well-balanced reward.

EURGBP overbought pullback support at 0.8677The EURGBP remains in a bullish trend, with recent price action showing signs of a corrective pullback within the broader uptrend.
Support Zone: 0.8677 – a key level from previous consolidation. Price is currently testing or approaching this level.
A bullish rebound from 0.8677 would confirm ongoing upside momentum, with potential targets at:
0.8775 – initial resistance
0.8807 – psychological and structural level
0.8845 – extended resistance on the longer-term chart
Bearish Scenario:
A confirmed break and daily close below 0.8677 would weaken the bullish outlook and suggest deeper downside risk toward:
0.8640 – minor support
0.8612 – stronger support and potential demand zone
Outlook:
Bullish bias remains intact while the GBPUSD holds above 0.8677 A sustained break below this level could shift momentum to the downside in the short term.
This communication is for informational purposes only and should not be viewed as any form of recommendation as to a particular course of action or as investment advice. It is not intended as an offer or solicitation for the purchase or sale of any financial instrument or as an official confirmation of any transaction. Opinions, estimates and assumptions expressed herein are made as of the date of this communication and are subject to change without notice. This communication has been prepared based upon information, including market prices, data and other information, believed to be reliable; however, Trade Nation does not warrant its completeness or accuracy. All market prices and market data contained in or attached to this communication are indicative and subject to change without notice.
Swing Short for EURGBPPrice will likely turn bearish again soon. Expecting the Pound to regain ground.

EURGBP: Bearish Forecast & Outlook
The charts are full of distraction, disturbance and are a graveyard of fear and greed which shall not cloud our judgement on the current state of affairs in the EURGBP pair price action which suggests a high likelihood of a coming move down.
Disclosure: I am part of Trade Nation's Influencer program and receive a monthly fee for using their TradingView charts in my analysis.
❤️ Please, support our work with like & comment! ❤️

Flag ReversalWe might see this guy use this flag reversal to push down, we are currently at the sell side of the trend and we want to believe that the pair is going to push down even more

EURGBP 2nd Buy EntryEntry: 0.86533
Stop Loss (R): 0.86379
Take Profit (4R): 0.87149
*Disclaimer: I will not accept liability for any loss or damage, including without limitation to any loss of profit, which may arise directly or indirectly from use of or reliance on such information.

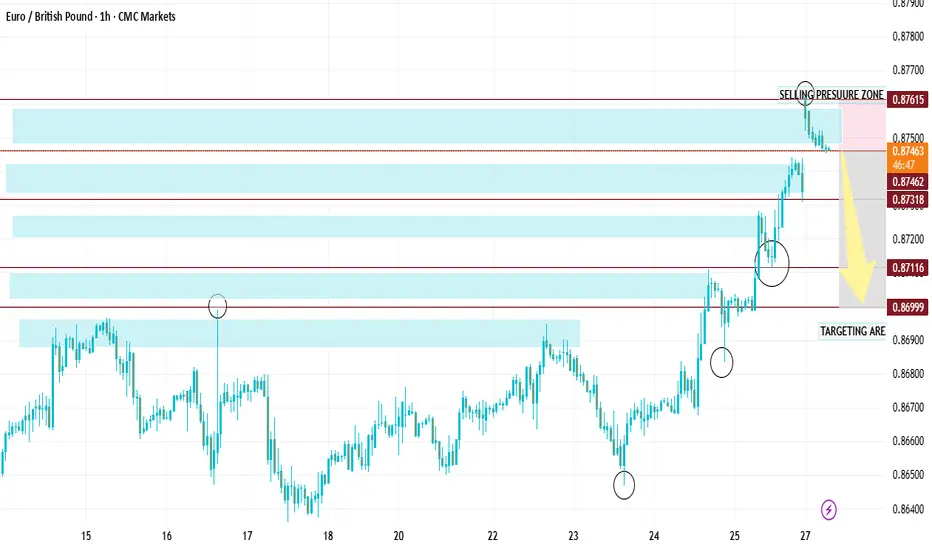
EURGBPOANDA:EURGBP 💼 Trade Idea: EUR/GBP – Short Position
A potential selling opportunity has emerged on the EUR/GBP currency pair, suggesting that the Euro may continue to weaken against the British Pound. Based on current technical patterns and market sentiment, a short position could be favorable at the identified levels.
📉 Entry Zone: 0.87467
🎯 1st Target: 0.87300
🎯 2nd Target: 0.87250
🎯 3rd Target: 0.87140
🛑 Stop Loss: 0.87950
---
EUR-GBP Swing Short! Sell!
Hello,Traders!
EUR-GBP keeps growing in
A strong uptrend but the pair
Is locally overbought so after
The price hits a horizontal
Resistance level of 0.8764
We will be expecting a
Local bearish correction
Sell!
Comment and subscribe to help us grow!
Check out other forecasts below too!
Disclosure: I am part of Trade Nation's Influencer program and receive a monthly fee for using their TradingView charts in my analysis.

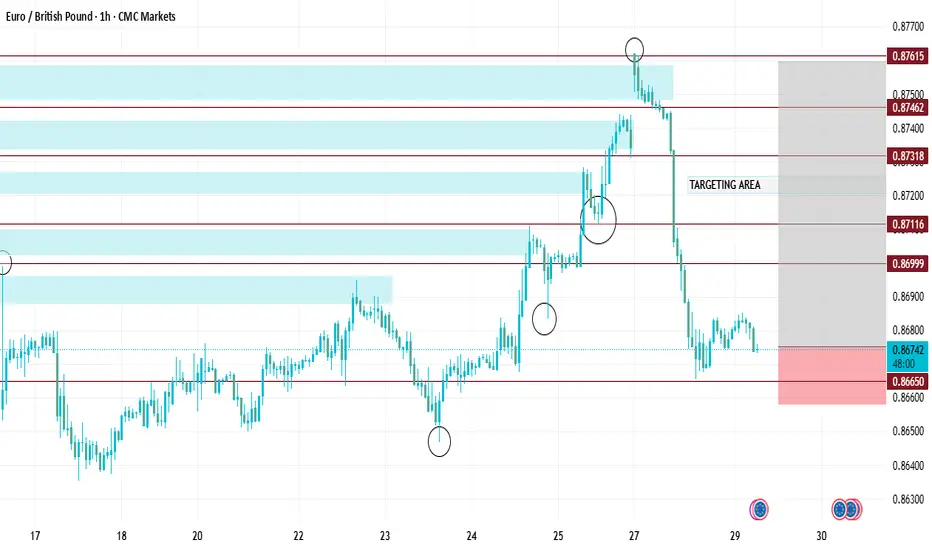
A GOOD SELL OPPORTUNITY FINALLY EMERGE ON EURGBPA good sell opportunity is what’s envisaged on EURGBP. Price has reached a high of 0.87387 therefore I expect some form of sell off as it’s already at the resistance level.

Sell EURGBPEURGBP is beginning to turn around after a great 3 month bull run. Price is indicative of bearish movement.

EUR/GBP: Bullish Stance Above 0.8640This signal outlines a tactical long entry on EUR/GBP, positioning for a bullish resolution from today's major fundamental events.
📰 Fundamental Thesis
This position is taken ahead of the two primary market movers: the ECB rate decision and the UK PMI data. The core thesis is that the ECB policy statement will be the dominant catalyst, providing strength to EUR that will outweigh the impact of the UK data release.
📊 Technical Thesis
The trade is defined by a sound technical structure. The stop loss is anchored beneath the critical support zone at 0.8640. The profit target is set to challenge the resistance area just above 0.8722. This setup offers a favorable and clearly defined risk-to-reward profile.
🧠 Risk Management
Execution is timed before extreme event-driven volatility. Adherence to the stop loss is critical to manage the inherent risk of this pre-news strategy.
Trade Parameters
⬆️ Direction: Long (Buy)
➡️ Entry: 0.86690
⛔️ Stop Loss: 0.86344
🎯 Target: 0.87382
✅ Risk/Reward: 1:2
