EURGBP: Will Keep Growing! Here is Why:
The recent price action on the EURGBP pair was keeping me on the fence, however, my bias is slowly but surely changing into the bullish one and I think we will see the price go up.
Disclosure: I am part of Trade Nation's Influencer program and receive a monthly fee for using their TradingView charts in my analysis.
❤️ Please, support our work with like & comment! ❤️
GBPEUR trade ideas

EURGBP | BearishEURGBP has printed double top with bearish RSI trend on RSI.Furthermore, Sellers has taken control and pushing the price lower with little or no support from the buyers.

EURGBP Analysis : Curve Breakdown + Directional Setup + Target🧠 Institutional Context & Smart Money Bias
This EURGBP chart offers a masterclass in engineered liquidity and market traps. Institutions have created an illusion of bullish strength through:
A manipulated rounded accumulation curve
A controlled channel phase
A false breakout above the reversal zone
These are textbook signals that the retail crowd is being misled, while smart money is preparing for a deeper move. Let’s dissect it step by step.
📊 Phase-by-Phase Technical Breakdown
🔻 1. Bearish Channel – Sentiment Shaping Phase
From July 11 to July 21, the pair traded within a descending parallel channel, forming a bearish market structure.
This phase was not a genuine trend, but a sentiment builder—to:
Create a belief in continued bearishness
Gather liquidity around the channel boundaries
The upper and lower bounds of the channel were respected precisely, revealing market maker intent.
📈 2. Parabolic Curve Support – Trap Engineered
Price transitioned out of the channel into a rounded bullish curve—a visual cue suggesting accumulation and strength.
This curved trendline often misleads retail traders into thinking a breakout rally is coming.
Price surged aggressively toward the Previous Reversal Zone, further fueling FOMO buys.
But this move was not sustainable. Why?
➡️ Because it lacked a clean base and was built off a manipulated liquidity sweep. The curve was a setup.
🟥 3. Previous Reversal Zone & Major BOS – Institutional Exit Point
Price entered the Previous Reversal Zone, a marked area of prior supply.
This is where institutional orders were likely resting.
After briefly exceeding the previous high, the market instantly reversed with force—evidence of:
Stop hunts
Distribution
Smart money selling into retail breakout buyers
The Major BOS (Break of Structure) confirms the shift: The trend is no longer bullish.
⚠️ 4. Curve Support Breakdown – Structure Shift Triggered
After peaking, the price violated the curve support, confirming the bullish trap.
This breakdown signals a phase transition:
From accumulation illusion → distribution reality
From retail optimism → smart money unloading
🟨 5. Central Zone – Decision Point
Price is now hovering at the Central Zone, a region of equilibrium between buyers and sellers.
This is where market makers may:
Redistribute for another leg down
Fake a pullback before continuing lower
Temporarily rally to trap more longs
This area will determine short-term directional bias. That’s why your setup smartly outlines two conditions from this point.
🔀 Trade Scenarios – MMC Conditions
🔻 Condition 1: Bearish Continuation Toward Next Reversal Zone
If the price rejects the Central Zone and begins forming lower highs and bearish structures:
Expect further downside
This confirms the market is in redistribution mode
Target: Next Reversal Zone at 0.8630–0.8640
💡 Rationale: Institutions are driving price back into demand zones to grab new liquidity or fill leftover buy orders.
🔁 Condition 2: Temporary Recovery & Trap Continuation
If price holds above the Central Zone and breaks short-term highs:
A short-term bullish rally may occur
Likely targets: 0.8675–0.8685
This may act as a fake-out rally, creating more buying interest before a deeper dump
💡 Rationale: Smart money may induce more buyers to create fresh liquidity pockets before dropping toward the next reversal zone.
🔐 Key MMC Zones & Structure Levels
Zone/Level Purpose
0.8695–0.8700 Previous Reversal Zone / Major BOS – Institutional distribution area
0.8660–0.8665 Central Zone – Mid-point equilibrium & battle zone
0.8630–0.8640 Next Reversal Zone – Potential bullish interest area for demand
🧠 Smart Money Summary
This chart showcases a multi-stage smart money plan:
Create channel to shape bias
Form curve to generate false hope
Push into supply and trap late buyers
Break curve support to shift structure
Retest Central Zone to decide next manipulation leg
Deliver price toward true unfilled demand zones
This is how institutions engineer movement while retail gets trapped chasing direction.

EURGBP – DAILY FORECAST Q3 | W32 | D5 | Y25📊 EURGBP – DAILY FORECAST
Q3 | W32 | D5 | Y25
Daily Forecast 🔍📅
Here’s a short diagnosis of the current chart setup 🧠📈
Higher time frame order blocks have been identified — these are our patient points of interest 🎯🧭.
It’s crucial to wait for a confirmed break of structure 🧱✅ before forming a directional bias.
This keeps us disciplined and aligned with what price action is truly telling us.
📈 Risk Management Protocols
🔑 Core principles:
Max 1% risk per trade
Only execute at pre-identified levels
Use alerts, not emotion
Stick to your RR plan — minimum 1:2
🧠 You’re not paid for how many trades you take, you’re paid for how well you manage risk.
🧠 Weekly FRGNT Insight
"Trade what the market gives, not what your ego wants."
Stay mechanical. Stay focused. Let the probabilities work.
FX:EURGBP

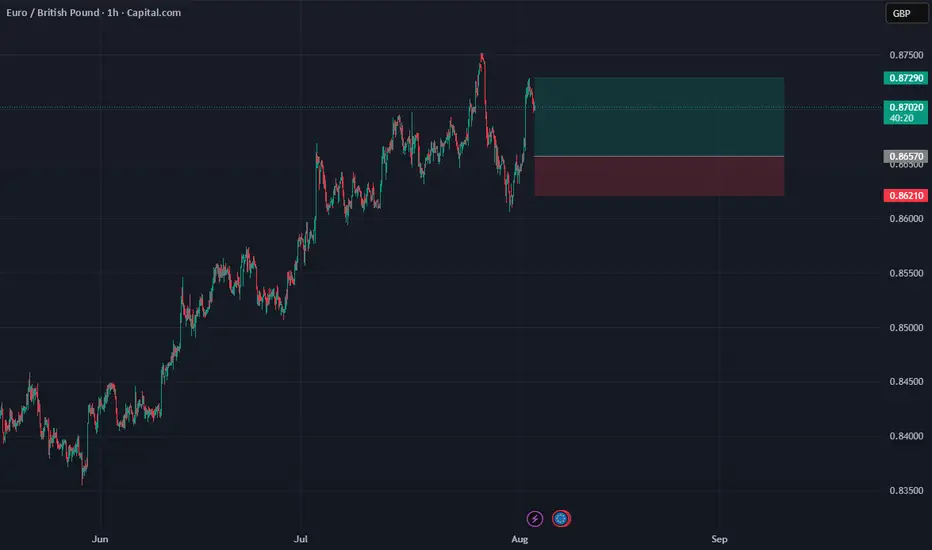
EURGBP | Ready to Ride Again – Just Say the WordI’ve got a lovely 1H bullish range from 0.8632 to 0.8730 — full of promise and potential.
Then came a little 40-pip pullback to 0.8687 — just a small mood swing, nothing serious. 😒
WHAT AM I GOING TO TO DO NOW?
If a bullish candle closes above my 50EMA,
I’m not overthinking — I’m riding the bull like we never broke up! 🐂💥
SL? Depends on the candle’s vibe:
If it’s a strong Marubozu, I’ll trust it like a loyal partner — SL goes just below it.
If stopped out ......!!!
TP? Straight to 0.8930 — no detours, no drama. 🎯
Wish me luck… and a bullish candle that finally knows what it wants.

ENTRY EURGBPDisclaimer:
This is merely a chart-based analytical trading idea and is not considered investment advice. Please manage your risks carefully and conduct your own research before making any trading decisions.
EURGBP important support at 0.8640The EURGBP remains in a bullish trend, with recent price action showing signs of a corrective pullback within the broader uptrend.
Support Zone: 0.8640 – a key level from previous consolidation. Price is currently testing or approaching this level.
A bullish rebound from 0.8640 would confirm ongoing upside momentum, with potential targets at:
0.8740 – initial resistance
0.8760 – psychological and structural level
0.8785 – extended resistance on the longer-term chart
Bearish Scenario:
A confirmed break and daily close below 0.8640 would weaken the bullish outlook and suggest deeper downside risk toward:
0.8613 – minor support
0.8576 – stronger support and potential demand zone
Outlook:
Bullish bias remains intact while the EURGBP holds above 0.8640 A sustained break below this level could shift momentum to the downside in the short term.
This communication is for informational purposes only and should not be viewed as any form of recommendation as to a particular course of action or as investment advice. It is not intended as an offer or solicitation for the purchase or sale of any financial instrument or as an official confirmation of any transaction. Opinions, estimates and assumptions expressed herein are made as of the date of this communication and are subject to change without notice. This communication has been prepared based upon information, including market prices, data and other information, believed to be reliable; however, Trade Nation does not warrant its completeness or accuracy. All market prices and market data contained in or attached to this communication are indicative and subject to change without notice.

ENTRY EURGBPDisclaimer:
This is merely a chart-based analytical trading idea and is not considered investment advice. Please manage your risks carefully and conduct your own research before making any trading decisions.


EUR/GBP Thief Trade: Swipe Profits Before Overbought Trap!🦹♂️ EUR/GBP "THE CHUNNEL HEIST" – BULLISH LOOT IN PROGRESS! 🚨💰
(Thief Trading Strategy – Escape Before the Cops Arrive!)
🎯 DEAR MARKET PIRATES & PROFIT SNATCHERS,
Based on our 🔥Thief Trading Style Analysis🔥, we’re executing a bullish heist on EUR/GBP ("The Chunnel"). The vault is wide open—time to swipe the loot before the high-risk resistance police barricade (aka overbought trap) shuts us down!
📜 THE MASTER PLAN:
✔ Entry (📈): "The Bullish Vault is Unlocked!"
Buy Limit Orders (15-30min TF) near recent swing lows/highs.
Thief’s DCA Trick: Layer entries like a pro robber—multiple limit orders for max loot.
✔ Stop Loss (🛑): "Hide Your Stash Wisely!"
SL at nearest 4H candle wick (0.86500)—adjust based on your risk appetite & lot size.
Remember: A good thief always has an escape route!
✔ Target (🎯): 0.88500 (or escape earlier if the cops get suspicious!)
🔎 SCALPERS & SWING BANDITS – LISTEN UP!
Scalpers: Stick to LONG-ONLY heists! Use trailing SL to protect profits.
Swing Thieves: If you’re low on cash, join the slow robbery—DCA & hold!
📡 WHY THIS HEIST IS HOT:
Bullish momentum in play (but BEWARE of overbought traps!).
Fundamental Drivers: Check COT Reports, Macro Data, & Sentiment.
🚨 TRADING ALERT: NEWS = POLICE RAID RISK!
Avoid new trades during high-impact news.
Trailing SL = Your Getaway Car! Lock profits before volatility strikes.
💥 BOOST THIS HEIST – STRENGTHEN THE GANG!
👉 Smash the LIKE & BOOST button to fuel our next market robbery!
👉 Follow for more heists—profit awaits! 🚀💰
🦹♂️ Stay Sharp, Stay Ruthless… See You on the Next Heist!

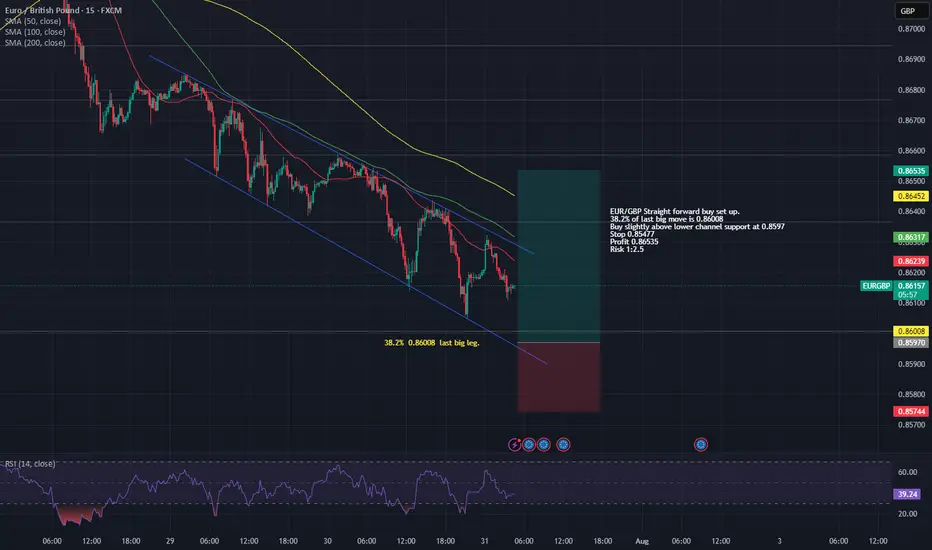
Straight forward EUR/GBP buy set up.EUR/GBP has been in a large decline against the recent trend and looks to be in some sort of leading diagonal pattern.
Major Fib 38.2% comes in at 0.86008 so buy slightly below but above lower trend line with profit risk of 1:2.5
Buy 0.8597
Stop 0.85744
Profit 0.86535 or more depending on strength.
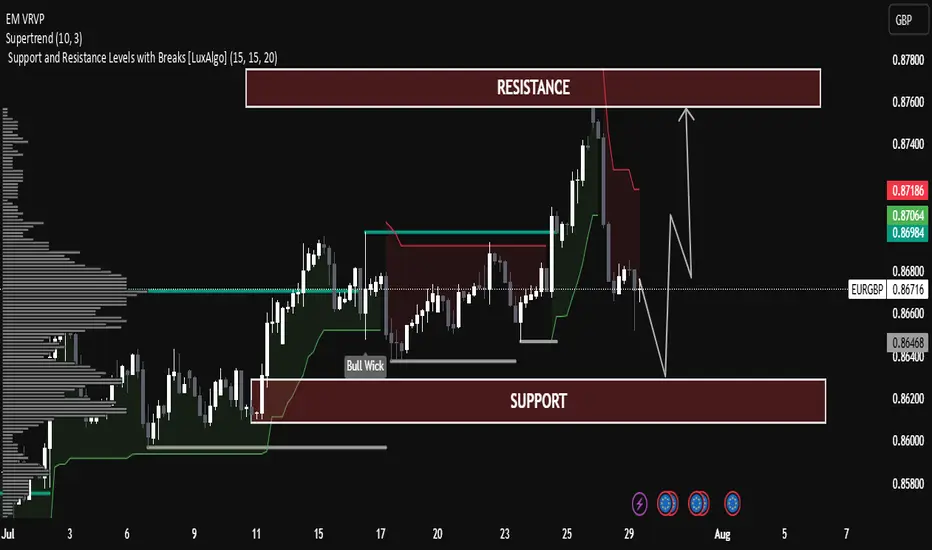
EUR/GBP Technical Analysis – Range-Bound Structure EUR/GBP Technical Analysis – Range-Bound Structure with Potential Rebound
The pair is currently trading within a well-defined horizontal channel between:
Support Zone: 0.86400 – 0.86200
Resistance Zone: 0.87800 – 0.87600
Price is currently near the mid-level (0.86756), showing consolidation after a rejection from resistance.
Supertrend Indicator:
The Supertrend (10,3) is currently bearish (red line above the price), indicating short-term downward pressure.
Price recently broke below the Supertrend line near the highs, suggesting a correction is underway.
Volume Profile (Left Side):
Significant volume has been transacted around the current market range (Point of Control).
This indicates strong interest and fair value, often leading to sideways movement before the next breakout.
Bull Wick Highlight (Mid-July):
Indicates buying pressure from lower levels, acting as historical demand near 0.86400.
🔄 Price Projection & Scenario Planning:
✅ Scenario A: Bullish Rejection from Support
If price retests the support zone (0.86400 – 0.86200) and forms a bullish rejection (e.g., pin bar or engulfing), a bounce is likely.
Target: Resistance zone 0.87600 – 0.87800
Confirmation: Bullish candle + break of 0.86900 resistance.
❌ Scenario B: Bearish Breakout Below Support
A break and close below 0.86200 may trigger a deeper correction.
Next possible downside target: 0.85800
Volume drop and strong red candles would support this.
🔧 Technical Summary:
Indicator Status
Structure Sideways / Range-bound
Supertrend Bearish (Short-term)
Support Zone 0.86200 – 0.86400
Resistance Zone 0.87600 – 0.87800
Bias Neutral-to-Bullish (above support)
🧠 Educational Note:
This chart is a great example of range trading—where traders look to buy near support and sell near resistance, especially when there is no strong trend. Patience and confirmation signals (like wick rejections or volume spikes) are key in such setups.
Check the trend Given the price behavior within the current resistance range, possible scenarios have been identified. It is expected that after some volatility and correction, we will see a continuation of the upward trend.

EURGBP Bullish Reversal Setup from Demand Zone (MMC Strategy)📊 Detailed Technical Analysis:
The EURGBP pair on the 2-hour chart is currently at a critical technical juncture, showing signs of a potential bullish reversal. This analysis follows Market Maker Concepts (MMC), which combines liquidity engineering, smart money movements, and structure shifts. Let’s break it down:
🔄 1. Consolidation Phase – Accumulation in Action (Smart Money Footprint)
Between July 15 to 24, the price moved within a tight range — classic consolidation behavior.
This phase suggests accumulation by institutional players, quietly building long positions while trapping retail shorts and longs.
This kind of sideways structure typically precedes a high-volume breakout, which happened right after.
📌 Lesson: Consolidation is often the calm before the storm — prepare for a breakout when this phase completes.
🚀 2. Breakout with QFL Pattern – Aggressive Bullish Shift
The price broke above the consolidation range and surged strongly.
This breakout followed a classic QFL (Quick Flip Level) structure — where price forms a base, drops temporarily, and then explodes upward.
The area of breakout aligns with a “2x Supply” zone — meaning this zone acted as a magnet for stop orders, and once breached, added more fuel to the rally.
📌 Why QFL Matters: It marks a shift in market sentiment — from balanced to strongly biased, in this case toward bulls.
📉 3. Pullback Phase – Structural Correction Begins
After reaching a high near 0.87500 (major resistance), price began to pull back sharply.
It formed a minor descending flag/channel, a classic corrective pattern, often a pause before resuming the larger trend.
A descending trendline has been drawn to capture this pullback structure.
📌 Important: Pullbacks are healthy — they allow for re-entries and provide better R:R setups.
📍 4. Reversal Zone – Key Demand Revisited
Price now sits within a Reversal Zone (Demand Area), marked in green on the chart.
This level previously served as the base for the breakout and aligns with institutional buying interest.
The area acts as a high-probability buy zone, supported by:
Trendline support
Price rejecting lower levels
Historical reaction at this zone
📌 Why It’s Crucial: If price respects this demand zone, it confirms bullish intent and creates a low-risk buying opportunity.
✅ 5. 2nd Confirmation – Price Action Support
The chart marks a "2nd Confirmation" label at a slightly lower level — this is a final support level, a safety net.
If price dips and bounces here again, it confirms buyer strength.
Strong price reaction at this level would validate a trend continuation setup back toward highs.
💹 6. Positive Pattern – Early Reversal Signs
Inside the demand zone, a bullish structure is forming.
This could be an inverted head & shoulders, or a double bottom pattern.
These patterns often act as launch pads for upward moves, especially when combined with institutional demand.
📌 MMC Insight: Market Makers engineer dips to induce panic, only to reverse aggressively once liquidity is absorbed.
🎯 Trade Plan Based on the Analysis:
Buy Zone: Between 0.86450 – 0.86700 (Reversal Zone)
Stop-Loss: Below 0.86250 (beneath 2nd confirmation)
Take Profits:
🎯 TP1: 0.86900 (Minor resistance)
🎯 TP2: 0.87500 (Major swing high)
Risk-to-Reward: 1:2 or higher depending on entry timing
🧠 MMC Strategy Summary for Minds:
This EURGBP 2H chart is a textbook example of MMC-based trading. We saw:
Institutional accumulation (consolidation phase)
QFL breakout (confirmation of bullish intent)
Return to demand (market maker’s discount area)
Early bullish signals (positive price action patterns)
Multiple confluences at the Reversal Zone (trendline, demand, confirmation zone)
Such a combination offers a high-probability swing trade setup. Patient traders can wait for the structure to break upward and join the trend with tight risk and clear targets.

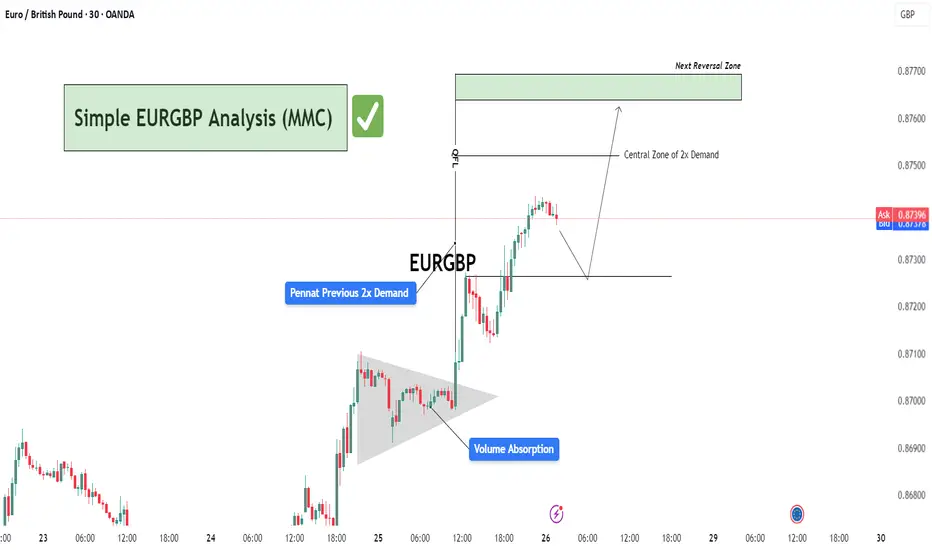
Simple EURGBP Analysis (MMC) – Bullish Continuation or Reversal?🕵️♂️ Chart Overview – 30-Min Timeframe (OANDA)
This EURGBP chart illustrates a classic bullish continuation structure following a volume absorption phase and pennant formation, leading into a vertical price expansion toward a potential reversal zone. The technical flow demonstrates smart money accumulation and re-accumulation before a sharp bullish leg.
🔷 Phase 1: Bullish Accumulation via Pennant Formation
The chart begins with a tight consolidation structure marked as a pennant, typically a continuation pattern.
This area coincides with “Previous 2x Demand”, hinting at a strong institutional buying interest.
The Volume Absorption label suggests that sell-side liquidity was efficiently absorbed—often a precursor to bullish breakouts.
📈 Phase 2: Breakout & Price Expansion
Price breaks out of the pennant aggressively, validating the absorption theory.
The post-breakout rally continues with minimal retracement, showcasing impulsive bullish momentum.
The QFL (Quasimodo Failure Level) is also marked—this serves as a structural footprint left by trapped sellers.
🟩 Next Levels to Watch: Reversal or Re-Entry Zones
As the price approaches the green "Next Reversal Zone" (0.87650–0.87700), watch for potential exhaustion or a reaction.
The Central Zone of 2x Demand (just below 0.87500) could act as a re-entry level for continuation long setups.
Anticipated short-term correction before continuation, as depicted by the projected path.
🧠 Strategic Insight & Trade Planning
Aggressive Bulls: May target breakout pullbacks near the Central Zone of Demand for intraday continuation.
Conservative Traders: Should wait for a clean reaction from the green Reversal Zone. If rejection is confirmed, short opportunities with tight stops become favorable.
Watch the price behavior around 0.87300–0.87500—this will likely dictate whether continuation or correction prevails.
EUR/GBP Potential Bullish SetupHi Traders.
We see a clear breakout from a falling wedge pattern and now we are forming a bigger inverse
HnS Pattern. Wait for the right shoulder to complete to confirm this setup.

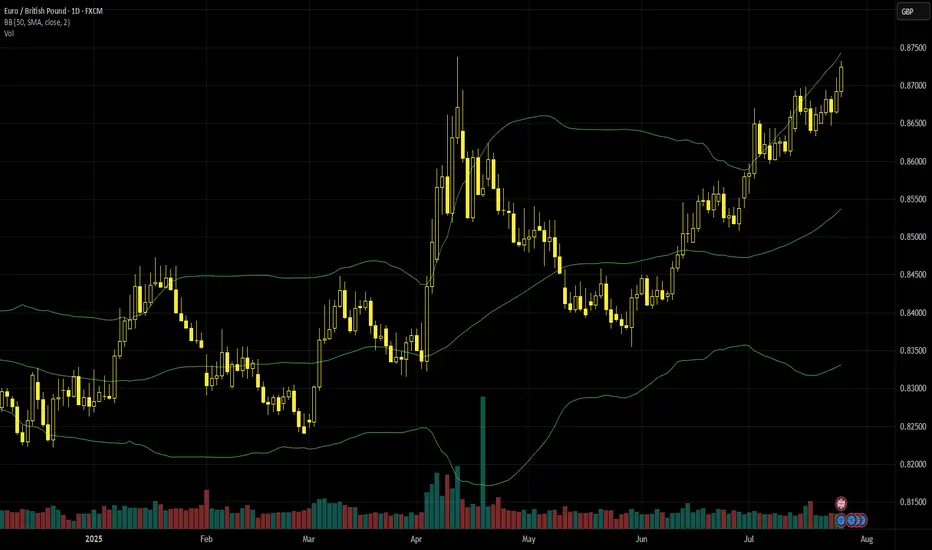
Euro-pound retests April’s highsThe ECB’s relative hawkishness or at least lower dovishness on 24 July seems to have boosted the euro significantly, with euro-pound in particular continuing its uptrend. Here though the generally weaker recent sentiment on British growth and disappointing retail data added fuel to EURGBP’s gains. There’s also some likelihood that the EU will secure a trade deal with the USA in the next few days before the deadline for new tariffs of 1 August.
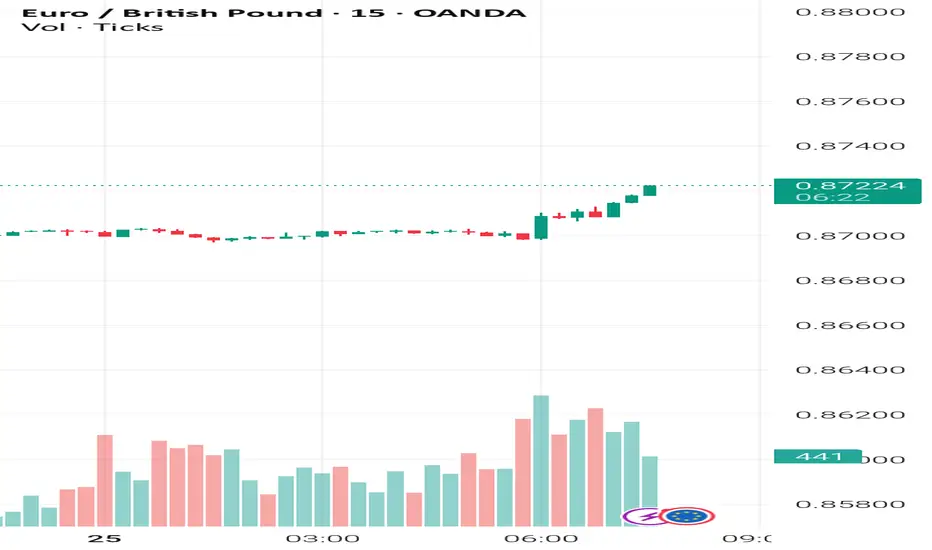
87p on 24 July was euro-pound’s highest daily close since December 2023 and gains continued intraday the following day with a clear push above the 23.6% monthly Fibonacci retracement. The overall trend since March is upward and these two days might suggest that the latest phase of it isn’t close to exhaustion yet; on the contrary, momentum has increased in recent sessions. However, volume has been significantly lower since late April and now a seasonal further drop might be possible. The slow stochastic signals overbought and ATR hasn’t risen significantly in recent days.
The 20 SMA might be an important dynamic support in the near future, but first it’d be possible to see the 23.6% Fibo flipping to support from resistance previously. Traders are looking ahead to the eurozone’s flash GDP for Q2 on 30 July and inflation on 1 August although the latter might be overshadowed by the NFP the same day.
This is my personal opinion, not the opinion of Exness. This is not a recommendation to trade.
EUR/GBP Pushing higherLooks like a good trade to the upside on the EUR/GBP.
Risk to reward potential 3:1
Upward trend is well formed

EURGBP near the current highest point of 2025.FX_IDC:EURGBP is slowly approaching a strong area of resistance, which is the current highest point of 2025. Let's dig in...
MARKETSCOM:EURGBP
Let us know what you think in the comments below.
Thank you.
75.2% of retail investor accounts lose money when trading CFDs with this provider. You should consider whether you understand how CFDs work and whether you can afford to take the high risk of losing your money. Past performance is not necessarily indicative of future results. The value of investments may fall as well as rise and the investor may not get back the amount initially invested. This content is not intended for nor applicable to residents of the UK. Cryptocurrency CFDs and spread bets are restricted in the UK for all retail clients.

EUR GBP: Long EUR GBP long 'relative fundamental' trade, based on the fairly 'hawkish' ECB and also today's and yesterday's 'soft' UK data. Entry 0.8712
The risk to the trade is the fact the stop loss is not behind a solid 'upswing of note'. But this is the only moment I have to potentially trade today and I think it's worth a go.
I do think a 'risk on' trade is also viable (which is also a risk if the GBP strengthens in a positive environment). But I've chosen to go with the 'freshness' of the UK data.
EUR GBP has a low ATR, the trade has a 10 pip stop loss and 15 pip profit target.
If it's ongoing, I will close the trade before end of day to avoid weekend risk.
Eurgbp sellI'm just waiting now for confirmation candles but looks good too sell from this current mark , and I can see a take profits area at 0.8669 will probably pull a lot further down but I'm fine with that and on to the next little and often is my philosophy to trade let's not get greedy belly

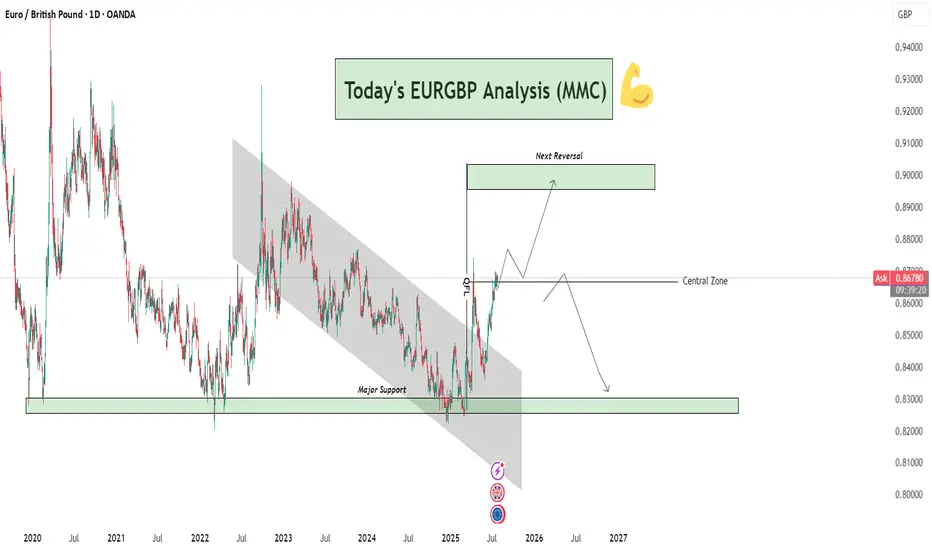
EURGBP Analysis : Breakout, Central Zone Flip & Reversal Target🧠 Overview:
This EURGBP daily chart clearly presents a bullish breakout from a long-term descending channel, a successful reclaim of the central structure zone, and a projection toward a key reversal level. This analysis incorporates Smart Money Concepts (SMC), Market Maker Concepts (MMC), and classic structural behavior.
🔍 Technical Breakdown:
📉 Long-Term Bearish Channel (2021–2025)
For nearly 4 years, EURGBP was trapped in a descending channel, forming consistent lower highs and lower lows.
This long-term bearish phase reflects strong supply-side control and institutional distribution.
The breakout above this structure is significant — marking a potential mid- to long-term trend reversal.
🔁 Major Support Zone (0.8300–0.8350)
Price bounced strongly from this historical demand zone multiple times (in 2021, 2022, and recently in 2025).
This zone is critical and acts as a high-volume accumulation area where smart money has stepped in.
The strong reaction from this level in 2025 triggered the breakout of the bearish structure.
🚀 Break of Structure + Retest
After breaking the descending channel, price retested the upper boundary, confirming a structure shift.
The breakout retest succeeded — marking the transition from a bearish phase to a bullish expansion.
📍 Central Zone Flip
The Central Zone, once a resistance/supply area during the downtrend, has now been reclaimed as support.
This is a powerful MMC concept – where the "central balance" of a structure flips and becomes a base for the next impulse.
Current price is sitting just above this zone, indicating bulls are still in control.
🎯 Next Reversal Zone (Target Area: 0.9000–0.9050)
The chart outlines a projected bullish move toward the Next Reversal Zone marked above.
This is a key supply area, likely to trigger profit-taking or institutional sell orders.
Expect price to range or wick into this zone before showing a possible bearish reversal.
🔄 Future Projection Scenarios:
Scenario 1 – Bullish Continuation:
Price continues to build bullish structure and approaches the 0.90 reversal zone.
Rejection from this zone may trigger consolidation or a minor retracement.
Scenario 2 – Major Reversal:
Upon hitting the next reversal zone, price could reverse and fall back toward the Central Zone or even the Major Support below, especially if macroeconomic fundamentals shift.
🔑 Confluences Supporting This Setup:
✅ Element 🧩 Description
🔹 Major Support Historical demand zone with repeated rejections
🔹 Channel Breakout Structure shift confirming bullish interest
🔹 Retest Success Technical confirmation of breakout validity
🔹 Central Zone Flip Old resistance → new support (MMC principle)
🔹 Reversal Zone Anticipated next profit-taking / supply area
📌 Strategic Insight:
Bias: Bullish short-term to mid-term
Entry Opportunity: Lower timeframe pullbacks into Central Zone (or retest zones)
Target: 0.9000–0.9050 area
Watch for Rejection: In reversal zone for potential bearish shift
⚠️ Risk Note:
Always wait for confirmation at reversal zones. Overextended moves without correction can quickly retrace. Manage your trades with stop-losses below key structural levels and maintain strict risk-reward planning.
🧠 Conclusion:
EURGBP has transitioned from a long bearish cycle into a bullish expansion phase. Smart Money accumulation at the base and a clean breakout with retest confirm a strong directional shift. Keep your focus on the Central Zone retests and the Reversal Zone reaction for optimal entries or exits.
EURGBP pivotal level at 0.8640The EURGBP remains in a bullish trend, with recent price action showing signs of a corrective pullback within the broader uptrend.
Support Zone: 0.8620 – a key level from previous consolidation. Price is currently testing or approaching this level.
A bullish rebound from 0.8620 would confirm ongoing upside momentum, with potential targets at:
0.8700 – initial resistance
0.8715 – psychological and structural level
0.8740 – extended resistance on the longer-term chart
Bearish Scenario:
A confirmed break and daily close below 0.8620 would weaken the bullish outlook and suggest deeper downside risk toward:
0.8600 – minor support
0.8590 – stronger support and potential demand zone
Outlook:
Bullish bias remains intact while the EURGBP holds above 0.8620. A sustained break below this level could shift momentum to the downside in the short term.
This communication is for informational purposes only and should not be viewed as any form of recommendation as to a particular course of action or as investment advice. It is not intended as an offer or solicitation for the purchase or sale of any financial instrument or as an official confirmation of any transaction. Opinions, estimates and assumptions expressed herein are made as of the date of this communication and are subject to change without notice. This communication has been prepared based upon information, including market prices, data and other information, believed to be reliable; however, Trade Nation does not warrant its completeness or accuracy. All market prices and market data contained in or attached to this communication are indicative and subject to change without notice.
