GBPJPY sitting at resistance – Is a drop to 193.360 likely?GBPJPY is sitting right at a key daily resistance zone. This is a level where it has struggled to break through and reversed strongly to the downside. So this makes it definitely one to monitor, especially if you’re eyeing potential short setups.
If we start seeing signs that the price is getting rejected here: like long wicks, strong bearish candles, it could be the early indication of another move lower. My focus is on a moderate drop toward the 193.360 area, similar to what we’ve seen in past pullbacks. Nothing too dramatic, just a simple downside play if sellers step in again.
But if we get a strong breakout? That changes everything: it would hint that bulls are taking full control. This area is pretty important and could give us a better idea of where price is headed next.
Just sharing my thoughts on support and resistance, this isn’t financial advice. Always confirm your setups and manage your risk properly.
Disclosure: I am part of Trade Nation's Influencer program and receive a monthly fee for using their TradingView charts in my analysis.
GBPJPY trade ideas

GBPJPY H4 XABCD Short at Market TP Below Market🔸Hello traders, let's review the 4 hour chart for GBPJPY. Strong gains off the lows recently, however price getting overextended and expecting reversal later at/near PRZ/D.
🔸Speculative XABCD structure defined by point X 199 point A 188 point B 195.20 point C 186.80 point D/PRZ 198.40/80 .
🔸Currently most points validated, point D/PRZ validated as well.
Short sell at market SL over point D/PRZ TP details see chart
🔸Recommended strategy for GJ traders: Short Sell at Market
SL over point D/PRZ TP1 193.30 TP2 191.00 TP3 188.80.
🎁Please hit the like button and
🎁Leave a comment to support our team!
RISK DISCLAIMER:
Trading Futures , Forex, CFDs and Stocks involves a risk of loss.
Please consider carefully if such trading is appropriate for you.
Past performance is not indicative of future results.
Always limit your leverage and use tight stop loss.

GBP/JPY Best Place To Buy Very Clear , Let`s Get This 200 Pips !Here is my 4H T.F Chart and if we check we will see that we have a very good support area very near the price now and we have already a good breakout and the price never retest the broken res and new supp so i`m waiting the price to retest it and give me any bullish price action and then we can buy it and targeting from 100 to 200 pips . and if we have a daily closure below my support then this idea will not be valid .

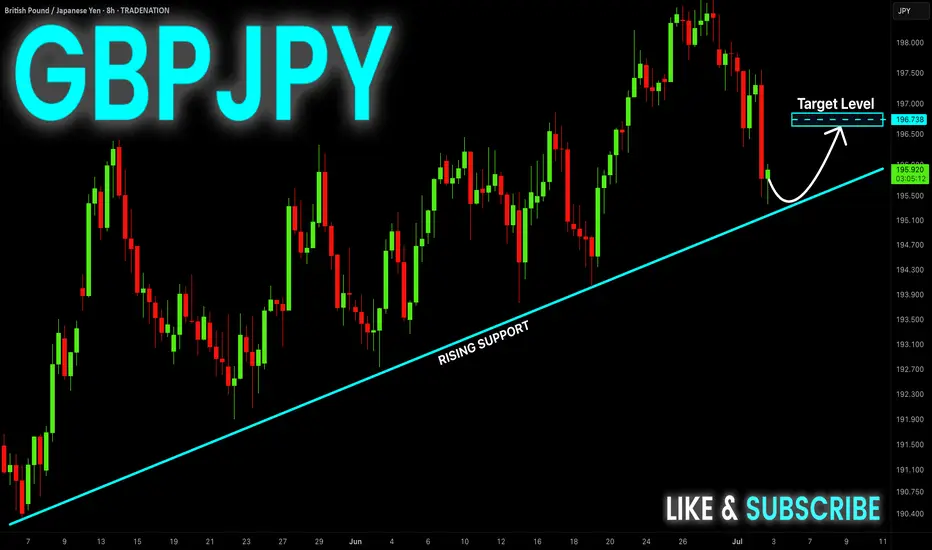
GBP/JPY Rising Within Ascending Channel – Target in SightGBP/JPY is currently moving within an ascending channel, where price action is forming higher highs and higher lows. This pattern indicates a steady uptrend.
At the moment, the pair is approaching the upper boundary (resistance line) of the channel. Based on the current momentum and structure, we expect the price to continue its upward movement and test the upper trendline.
This upper line serves as our near-term target, where we may look to take profit or reassess the trade setup. As long as the price remains within the channel and respects the trendline structure, the bullish bias remains intact.

04.07.25 Morning ForecastPairs on Watch -
FX:GBPJPY
FX:USDJPY
OANDA:XPTUSD
FX:EURCAD
A short overview of the instruments I am looking at for today, multi-timeframe analysis down to what I will be looking at for an entry. Enjoy!

GBPJPY: Bullish Impulse May Take Price To 205! 700+ Pips MoveGBPJPY is in steady bullish move in other words it is in impulse move; price has not yet exhausted and there is still extended bullish move to completed before bears takes control over. Please use accurate risk management while trading and do your own analysis.
LIKE
COMMENT
SHARE
Good luck.
Team Setupsfx_

GBP-JPY Correction Ahead! Buy!
Hello,Traders!
GBP-JPY will soon make
A retest of the rising support
Line and as we are bullish
Biased we will be expecting
A local bullish correction
Buy!
Comment and subscribe to help us grow!
Check out other forecasts below too!
Disclosure: I am part of Trade Nation's Influencer program and receive a monthly fee for using their TradingView charts in my analysis.
Shorty GbpJpyLook for liquidity sweep at the end of each trend
Mark your retracement zones
Use Fibonacci to find your sl and tp zones
Rule of your deposit
Try to set sl at 10% of your deposit
Use a reasonable lot size
AND MAKE A TRADE

GBPJPY SHORT DAILY FORECAST Q3 D4 W27 Y25GBPJPY SHORT DAILY FORECAST Q3 D4 W27 Y25
Professional Risk Managers👋
Welcome back to another FRGNT chart update📈
Diving into some Forex setups using predominantly higher time frame order blocks alongside confirmation breaks of structure.
Let’s see what price action is telling us today! 👀
💡Here are some trade confluences📝
✅Daily Order block identified
✅4H Order Block identified
✅1H Order Block identified
🔑 Remember, to participate in trading comes always with a degree of risk, therefore as professional risk managers it remains vital that we stick to our risk management plan as well as our trading strategies.
📈The rest, we leave to the balance of probabilities.
💡Fail to plan. Plan to fail.
🏆It has always been that simple.
❤️Good luck with your trading journey, I shall see you at the very top.
🎯Trade consistent, FRGNT X

GBPJPY Breakout and Potential RetraceHey Traders, in the coming week we are monitoring GBPJPY for a buying opportunity around 196.600 zone, GBPJPY was trading in a downtrend and successfully managed to break it out. Currently is in a correction phase in which it is approaching the retrace area at 196.600 support and resistance zone.
Trade safe, Joe.

GBP/JPY BULLISH BIAS RIGHT NOW| LONG
Hello, Friends!
It makes sense for us to go long on GBP/JPY right now from the support line below with the target of 198.556 because of the confluence of the two strong factors which are the general uptrend on the previous 1W candle and the oversold situation on the lower TF determined by it’s proximity to the lower BB band.
Disclosure: I am part of Trade Nation's Influencer program and receive a monthly fee for using their TradingView charts in my analysis.
✅LIKE AND COMMENT MY IDEAS✅

GBP_JPY WILL GROW|LONG|
✅GBP_JPY made a pullback
From the resistance above just
As we predicted, however, the
Pair made a retest of the horizontal
Support below around 196.500 and
We are already seeing a beautiful
Rebound so as the pair is in the
Uptrend we will be expecting
A further bullish move up
LONG🚀
✅Like and subscribe to never miss a new idea!✅
Disclosure: I am part of Trade Nation's Influencer program and receive a monthly fee for using their TradingView charts in my analysis.

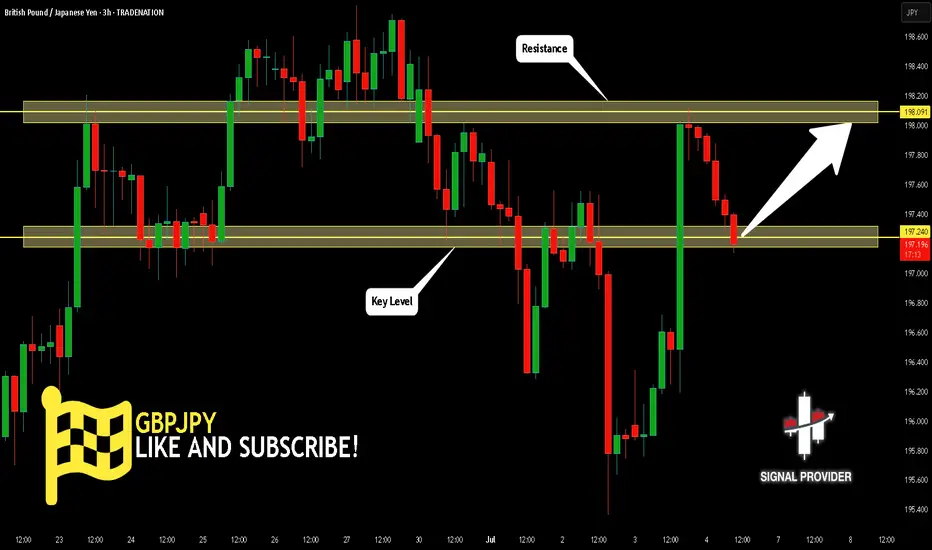
GBPJPY Will Go Up! Buy!
Please, check our technical outlook for GBPJPY.
Time Frame: 3h
Current Trend: Bullish
Sentiment: Oversold (based on 7-period RSI)
Forecast: Bullish
The market is approaching a key horizontal level 197.240.
Considering the today's price action, probabilities will be high to see a movement to 198.091.
P.S
Please, note that an oversold/overbought condition can last for a long time, and therefore being oversold/overbought doesn't mean a price rally will come soon, or at all.
Disclosure: I am part of Trade Nation's Influencer program and receive a monthly fee for using their TradingView charts in my analysis.
Like and subscribe and comment my ideas if you enjoy them!
GBP/JPY) back bullish trend analysis Read The captionSMC trading point update
Technical analysis of GBP/JPY on the 2-hour timeframe, signaling a potential rally from a key support area. Here’s a breakdown of this analysis:
---
Technical Breakdown
1. Key Support Zone (Yellow Box):
Price has pulled back to a strong support level around 196.50–197.00.
This level previously acted as resistance and now flipped to support (classic support-resistance flip), marked by the green arrow.
2. EMA 200 as Dynamic Support:
The 200 EMA (~196.567) is just below the support zone, reinforcing the likelihood of a bullish bounce from this area.
3. Bullish Price Projection:
The chart suggests a bounce off this support zone with a projected move toward the target point at 200.132, indicating a +1.71% upside.
4. RSI Indicator (14):
RSI is at 43.47, approaching the oversold region but curving upward — supporting a potential reversal to the upside.
---
Forecasted Move
Expected Move: Bullish reversal from support, targeting 200.132.
The chart outlines a potential entry at current levels, with a bounce confirmed by price respecting the yellow support zone.
Mr SMC Trading point
---
Trading Idea Summary
Bias: Bullish
Entry Zone: Around 196.50–197.00
Stop-Loss: Below support zone (~196.00 or lower)
Take-Profit: 200.132
Confirmation: Bullish candlestick pattern or RSI crossover
plesse support boost 🚀 this analysis

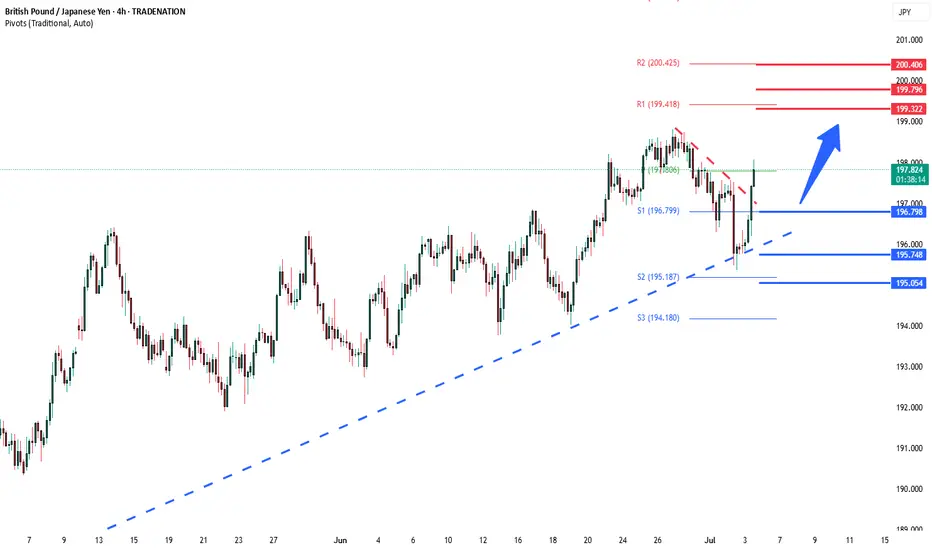
GBPJPY uptrend continuation breakoutKey Support: 196.75
This level marks the prior consolidation zone and serves as a critical pivot. A corrective pullback toward 196.75 followed by a bullish reversal would validate the uptrend, with upside targets at:
199.20 – Initial resistance and short-term target
199.70 – Minor resistance zone
200.40 – Longer-term breakout objective
However, a daily close below 196.75 would invalidate the bullish scenario, potentially triggering a deeper retracement toward:
195.80 – Near-term support
194.80 – Key downside level in a bearish reversal
Conclusion:
As long as 196.75 holds, the bias remains bullish, favoring continuation toward the 199–200 zone. A confirmed break below this support would shift momentum, opening the door for a broader corrective decline.
This communication is for informational purposes only and should not be viewed as any form of recommendation as to a particular course of action or as investment advice. It is not intended as an offer or solicitation for the purchase or sale of any financial instrument or as an official confirmation of any transaction. Opinions, estimates and assumptions expressed herein are made as of the date of this communication and are subject to change without notice. This communication has been prepared based upon information, including market prices, data and other information, believed to be reliable; however, Trade Nation does not warrant its completeness or accuracy. All market prices and market data contained in or attached to this communication are indicative and subject to change without notice.
gbpjpy long outlookif anyone see any different lmk what you see. whati am seeing based off weekly chart is price breaking ristance asreas and moving on up to another ristsance zone. what do you guys think
?

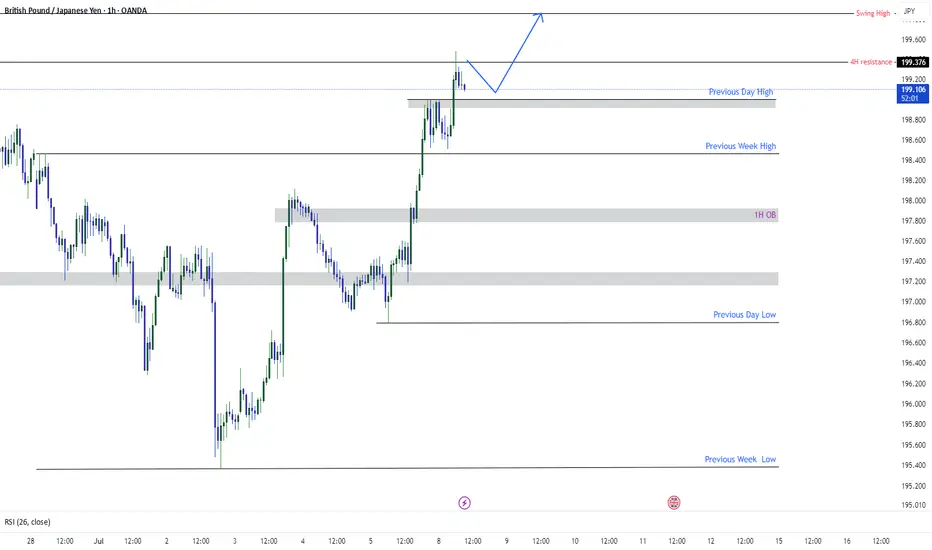
GBPJPY Targeting SwingGBPJPY has currently broken previous day high and wants to target the swing high which is 199.857 after retracing form previous 4H resistance GJ wants to travel to swing high. Chart is showing everything clearly. do not make things complex. Simplify as much as you can.

#GBPJPY Buy 196.732#GBPJPY Buy 196.732
SL 196.132
TP 196.932
TP 197.732
TP 199.132
Trade at your own risk
Protect your capital
The Wizard 🧙♂️ SWFX

GBPJPY Eyes 200 BoJ Dovishness & Bullish UK SentimentGBPJPY pair has staged a decisive breakout from a multi-day consolidation zone, with technical momentum and macro fundamentals aligning in favor of further upside. Price action has respected a bullish continuation structure — a falling wedge followed by horizontal accumulation — and is now pressing toward the psychological 200.00 level. With the Bank of England holding firm on policy and the Bank of Japan maintaining its ultra-loose stance, GBPJPY presents one of the strongest carry trade setups in the market. Here's a breakdown of what’s driving this move and what to watch next:
📈 Current Bias: Bullish
The pair has confirmed a bullish breakout above the 198.80–198.95 resistance zone, targeting higher fib extensions at 199.40 and 200.00. Momentum is clearly on the bulls’ side as GBPJPY follows through on a textbook pattern breakout.
🔍 Key Fundamentals:
Bank of Japan’s Dovish Stance: The BoJ continues to resist any significant tightening, reaffirming yield curve control and negative real yields. This keeps the yen fundamentally weak, especially against higher-yielding currencies.
Bank of England’s Hawkish Hold: Despite global easing signals, the BoE remains cautious and data-dependent, with inflation still sticky in the UK. This underpins GBP strength relative to the yen.
Global Risk Appetite: Strong equity markets, especially the US500 rally, reduce demand for the safe-haven JPY and increase appetite for high-yielding cross pairs like GBPJPY.
⚠️ Risks to the Trend:
Safe-Haven Shocks: Any sudden geopolitical tension (e.g., Middle East, US-China trade rhetoric) may trigger JPY demand and reverse the bullish flow.
Unexpected BoE Dovish Pivot: A surprise in UK inflation or dovish commentary from the BoE could weaken GBP momentum.
JPY Intervention Risks: With the yen near historically weak levels, any threat or action from Japan’s Ministry of Finance or verbal intervention by BoJ officials could spark sudden volatility.
📅 Key News/Events Ahead:
Japan’s Tankan Survey (June 30): May influence BoJ tone.
UK Final Manufacturing PMI (July 3): A key gauge for growth momentum.
BoE Governor Bailey Speech (July 5): Any hints on policy trajectory will be market-moving.
US NFP & Global Risk Sentiment: Impacts broader carry trade appetite.
⚖️ Leader or Lagger?
GBPJPY is a leader — it often acts as the flagship pair for carry trade demand. Moves in GBPJPY frequently guide sentiment across other JPY pairs like CADJPY, AUDJPY, and NZDJPY, especially when driven by macro divergences. Its high beta to risk sentiment also makes it a prime barometer for global financial mood.
🎯 Conclusion:
GBPJPY has momentum, macro divergence, and a clean technical setup on its side. The breakout above consolidation favors a continued rally toward 199.40 and possibly 200.00. While geopolitical or policy shocks remain risks, the current backdrop supports staying bullish while above the 197.65 invalidation level.


GBPJPY High Probability of a Bearish CorrectionThe trend is no doubt bullish here. But in the event that the current H1 demand is violated, there is a high probability of a retest or pullback to an H4 demand zone before the bullish trend resumes.

GBPJPY SELL IDEAPrice reached a daily resistance last week and respected it. The price was consolidating and finally broke the previous low (support) on the H4 chart, forming a lower low and signaling the beginning of a downtrend/fall.
I'm on the lookout for a retest of the broken support on H1 for entry for a sell to the next low.
Risk - 30 pips
Reward - 172 pips
