GBPJPY - Bullish No More!Hello TradingView Family / Fellow Traders. This is Richard, also known as theSignalyst.
📈As per our last GBPJPY analysis (attached on the chart), it rejected the lower bound of the rising blue channel.
What's next?
GBPJPY is currently approaching the upper bound of its falling trend marked in red.
Moreover, the green zone is a strong structure and resistance.
🏹 Thus, the highlighted red circle is a strong area to look for sell setups as it is the intersection of structure and upper red trendline acting as a non-horizontal resistance.
📚 As per my trading style:
As #GBPJPY approaches the red circle zone, I will be looking for bearish reversal setups (like a double top pattern, trendline break , and so on...)
📚 Always follow your trading plan regarding entry, risk management, and trade management.
Good luck!
All Strategies Are Good; If Managed Properly!
~Rich
Disclosure: I am part of Trade Nation's Influencer program and receive a monthly fee for using their TradingView charts in my analysis.
GBPJPY trade ideas

GBP/JPY 4H Chart Analysis – Bullish Channel Setup📈 Trend:
Price is moving in an ascending channel
🔵 Support line below
🔴 Resistance line above
---
Key Zones & Levels:
📍 Demand Zone (Buy Area):
Between 191.753 – 194.016
Price might bounce here before continuing up
🔵 Likely pullback expected here
🎯 Target Point:
202.500
🚀 If price respects the demand zone, this is the upside target
🟢 Entry Point:
Around 193.964 – 194.016
Optimal buying zone before the projected rise
❌ Stop Loss:
Below 191.700
🛑 Placed to minimize losses if price breaks down
---
Indicators:
📉 EMA (70):
Currently at 192.816
✅ Acting as dynamic support
---
Trade Plan Summary:
🔄 Wait for a retracement into the Demand Zone
🛒 Enter long near 193.964
⛔ Stop loss at 191.700
🎯 Target at 202.500

Lingrid | GBPJPY potential Short-Term RetracementFX:GBPJPY broke above the March high but immediately reversed, forming a fake breakout paired with bearish divergence. This signals potential exhaustion as the pair sits near the upper boundary of the resistance zone. A pullback toward 194.200 or deeper into the 192 area appears increasingly likely.
📌 Key Levels
Support level: 192.338
Invalidation level: Above 196.500
Target area: 194.200 and possibly 192.338
⚠️ Risks
Continued bullish pressure could invalidate the bearish reversal setup
A sustained hold above 196 would point to trend continuation toward 198+
Traders, if you liked this idea or if you have your own opinion about it, write in the comments. I will be glad 👩💻

DeGRAM | GBPJPY Formed a Falling Wedge📊 Technical Analysis
● Clean breakout above the 190.3 –191.3 demand zone and retest of the grey downtrend line sets a bullish base.
● The small falling wedge points to horizontal resistance at 193.5.
💡 Fundamental Analysis
● BoE minutes reveal a hawkish tilt, cementing a wide UK–Japan yield gap as markets push back rate-cut bets .
● BoJ stays ultra-dovish: April CPI slowed to 2.3 % YoY, keeping the yen soft against higher-yielding currencies .
✨ Summary
Demand-zone hold + hawkish BoE/dovish BoJ underline a short-term long bias: targets 193.5 → 196; invalidation on a close below 190.
-------------------
Share your opinion in the comments and support the idea with like. Thanks for your support!

GBPJPY Sell Opportunity There is a sell opportunity. We needed to wait for a retest and sell
Entry:193.215
SL:193.414
TP:191.984
It as already reached a daily resistance and I hope to sell.
Pls comment you opinions

GBP/JPY For Bullishyou can go short now to entry point
or
wait for pull-back near by entry point and then go long
general trend is up trend
have fun :)

GBP/JPY Breaks Above 196.00! Continuation or Distribution?Detailed Techno-Macro Analysis – GBP/JPY
GBP/JPY has just completed a significant weekly structure breakout, pushing through a key supply zone between 195.00 and 196.30 — an area that historically acted as strong resistance. The breakout occurred via a high-volatility daily candle that closed above the zone, indicating strong bullish pressure.
🔍 Structure & Price Action
Price action shows higher lows and higher highs: a clearly defined bullish structure.
The breakout originated from an accumulation base, following a false bearish breakout below 188.50 (bull trap).
RSI is around 70 on the daily timeframe → strong momentum, but signs of potential exhaustion.
🧠 Key Zones Identified
Current weekly supply: 195.00 – 196.80 (being tested)
Next resistance: 198.70 – 199.50 (swing high and monthly level)
Immediate support: 194.00 – 192.80 (ideal area for pullback and long setups)
Structural support: 190.50 – 188.80
Invalidation: Daily close below 191.00 → potential reversal signal
📈 Macro & Fundamental Context
🇬🇧 UK Macro Update
Wages rising: +5.5% (above expectations) → could support further monetary tightening
Claimant count increasing → early weakness in the labor market
Mixed data, but wage growth bias favors GBP strength
🇯🇵 JPY Still Weak
BoJ remains ultra-accommodative
Verbal interventions from Japanese officials haven’t yet had structural impact
🪙 Retail Sentiment
70% of retail traders are short GBP/JPY, with an average price of 190.59
Only 30% are long, with an average price of 194.65
➡️ Current price (196.30) is above both → retail squeeze in play. Contrarian setup confirmed.
🧾 COT Report
GBP (Non-Commercial Speculators):
Long: +3,320 contracts
Short: -1,956 contracts
➡️ Net long positions increasing → favorable institutional exposure
JPY:
Mixed positions, with increases in both long and short → institutional neutrality on the yen
📅 Seasonality – GBP/JPY
May is historically bearish on both 5Y and 20Y timeframes:
5Y: -2.52%
20Y: -0.43%
Only the 2Y pattern shows a positive return
➡️ Negative seasonality vs. bullish technical structure → conflict worth watching
🔍 Execution Summary
The bullish breakout is strong and supported by sentiment and institutional positioning, but price is now entering a potential distribution zone, where profit-taking could increase.
👉 Main scenario: technical pullback toward 194.00–192.80 for possible long entries, targeting 198.50–199.50
👉 Alternative scenario: daily close below 191.00 → bias reversal and bearish continuation

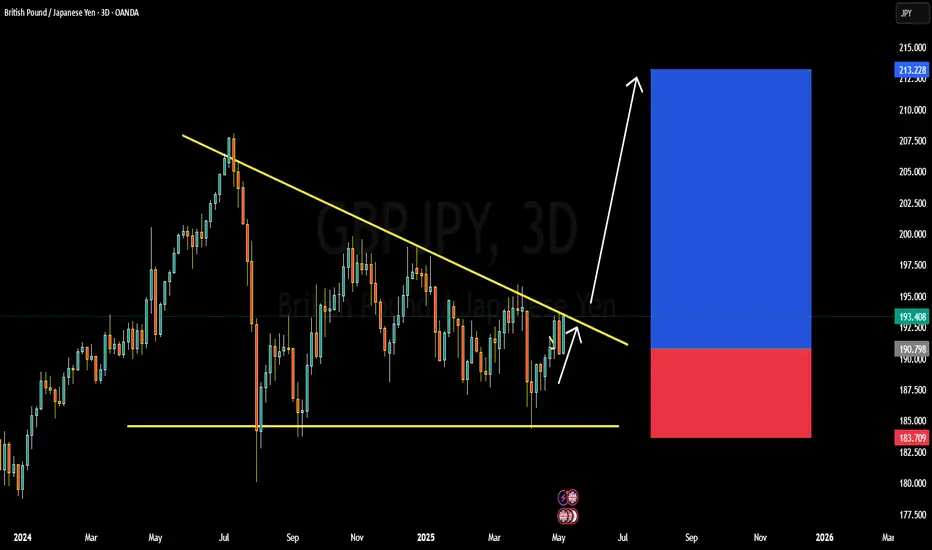
GBPJPY BULLISH OR BEARISH DETAILED ANALYSISGBPJPY is currently trading near 190.80 and is forming a significant breakout structure on the 3-day chart. After months of consolidation under a descending trendline, the pair is now coiling tightly, signaling a potential bullish breakout. The pair has respected the lower support range near 183.70 while pushing up against descending resistance multiple times. This squeeze pattern often precedes a major directional move, and with bullish momentum building, GBPJPY could be primed for a rally toward the 210.00 zone.
Fundamentally, the British pound is finding strong support from the latest hawkish commentary by the Bank of England, which has hinted that inflation remains sticky, keeping rate cut expectations delayed. On the other hand, the Japanese yen remains under consistent pressure due to the Bank of Japan's ultra-dovish stance and yield curve control policies. The BoJ’s reluctance to shift its policy outlook, coupled with soft macro data from Japan, is weakening the yen across the board.
Technically, a breakout and close above the descending trendline around 194.00 will be a key confirmation point. If this happens, bulls could dominate and push GBPJPY toward the 210.00 resistance zone in the medium term. The R\:R on this setup remains favorable with stops safely tucked below 183.70, giving this trade strong upside potential.
This pair is currently one of my top watchlist setups for May as both the technical and fundamental landscapes align. With bullish sentiment driving GBP strength and JPY weakness being a prevailing macro theme, GBPJPY could deliver a powerful upside continuation if the breakout confirms.
GBPJPY → Return to range. Possible price decline.FX:GBPJPY is forming a local bearish trend amid a correction in the dollar. The price is returning to the range and entering strong resistance.
Amid a correction in the dollar, the Japanese yen is strengthening, putting pressure on the currency pair.
GBPJPY is returning below a strong level (within the range) and consolidating in the selling zone, which could trigger a continuation of the decline towards areas of interest. Technically, the global trend is neutral and the currency pair is forming a rebound from strong downward resistance. If the bears keep the price below 193.45 - 193.74, the local downward trend may continue.
Resistance levels: 193.45, 193.74, 194.22
Support levels: 193.04, 192.35, 191.65
Price consolidation below 193.74 - 193.45 will confirm that bears are holding the range resistance. The sell-off may continue, and in this case, the price will head towards the indicated zones of interest and liquidity.
Best regards, R. Linda!

GBPJPY: 1050+ Pips Move! Will JPY continue dropping? In our previous analysis, we anticipated a similar move for GBPJPY, but the price dropped a bit further than expected. It’s now in a position to buy long, but please use accurate risk management as JPY pairs are likely to remain more volatile than ever. There are three targets you can keep an eye on: 197, then 200. Remember, trading involves risk, so make your own decisions.
Good luck and trade safely!
Thank you for your unwavering support! 😊
If you’d like to contribute, here are a few ways you can help us:
- Like our ideas
- Comment on our ideas
- Share our ideas
Team Setupsfx_
❤️🚀

GBPJPY daily and 4hr Analaysis GBP/JPY is expected to turn bearish from the 196.096 - 197.372 - 200.781 zone, with a projected drop towards the 186.572 - 179.071 area, where it may find support and potentially reverse into a bullish move. However, there's also a possibility of a continued bearish breakout that could extend the decline further towards the 174.45 level.

ICT STRATEGY First thing we need to have fair value gap that have to be inverted, after being inverted, the market breaks the structure and then come back to our point of interest which is our order block
DeGRAM | GBPJPY broke through and fixed above the channel📊 Technical Analysis
● Price has broken the 8‑month descending channel’s roof and reclaimed the last swing‑high at 194, turning it into support and signalling a trend reversal.
● The move launches from a bullish pennant; its measured target and the channel’s midline converge in the 196 – 197.8 resistance zone.
💡 Fundamental Analysis
● UK average earnings held above 6 % y/y in April, curbing BoE‑cut speculation and keeping gilt yields elevated.
● Japan’s Q1 GDP shrank and the BoJ left policy ultra‑loose, widening the UK–JP rate gap and pressuring the yen.
✨ Summary
Channel breakout plus strong UK data and soft JPY bias favour a long GBP/JPY: aim for 196 → 197.8, risk managed on a daily close back below 194.
-------------------
Share your opinion in the comments and support the idea with like. Thanks for your support!

GBP/JPY (British Pound / Japanese Yen) trade idea.The chart represents a trade setup for GBP/JPY on the 1-hour timeframe. Here's a breakdown:
Key Zones and Levels:
Entry Zone:
Highlighted between approximately 195.653 and 196.200
This is where the trader expects price to reverse and start moving downward.
Stop Loss (SL):
Set at 196.896
If price moves above this level, the trade idea is invalidated.
Target 1:
Set at 193.634
A partial take-profit level where the trader might secure some gains.
Final Target:
Set at 191.542 – 191.569
This is the ultimate take-profit level if the trade goes as planned.
Expected Price Action :
Price is expected to enter the Entry Zone, then reverse downward.
It may consolidate or make a pullback, then continue dropping.
The move is expected to reach Target 1, followed by the Final Target.

GBPJPY Signal : 1H / 4H Beautiful buy !!!Hello Traders! 👋
What are your thoughts on GBPJPY ?
GBPJPY
Market price : 192.40
Buy Limit: 191.20 - 191.00
Tp1 : 192.10
Tp2 : 193.10
Tp3 : 194.50
Tp4 : 195.90
Sl : 190.10 ( 100 pip )
Don’t forget to like and share your thoughts in the comments! ❤️
Remember this is a position that was found by me and it is a personal idea not a financial advice, you are responsible for your loss and gain.

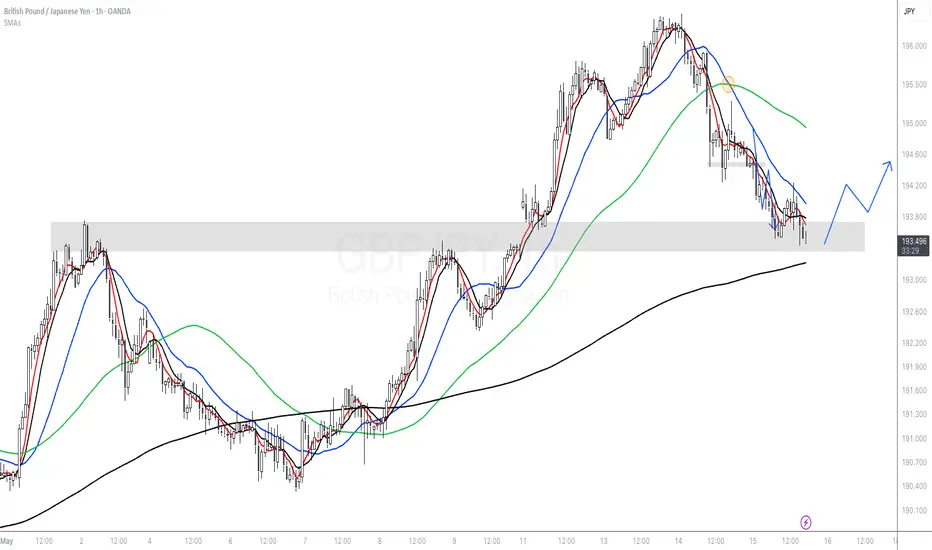
GBPJPY Role Reversal Setup (GBPJPY 1HR)Price has now closed the gap previously set, and is now on a strong level of support on the 1hr chart. I will be watching this level closely for possible reversal signs and a push higher as this may be a longer term plan.
- 1d trend change confirmed
- Support level being tested
- Watch the 15min chart for price action to confirm
- Scalp the entry
Thats the plan.
We may push lower, which would involve breaking current support and retesting for next leg lower.
GBP/JPY Fibo ResistanceGBP/JPY has been on a run with more than 1,000 pips gained on the pair from the April 9th low around the 185.00 handle. There's been a few different clean setups, as well, such as the ascending triangle when the 190.00 level was holding as resistance, and then support.
The BoJ rate decision helped to prod JPY weakness and then there's been widespread continuation of risk-on so far to start this week. There's also some important context for the bullish continuation theme given this week's early rally...
The long-term gap from back in 2008 continues to carry weight and we saw that last week as the bottom of that gap at 193.61 held as resistance. The top of that gap sits at 198.08 and this was resistance when it was last in-play on January 7th.
At this point there's also Fibonacci resistance at 195.66 coming in to hold the highs, and this sets the stage for a higher-low at either 195.00 or 193.61. A show of support there opens the door for bullish continuation, and the top of that gap would be an ideal area for resistance to show at or around 198.08. Also of interest is a shorter-term Fibonacci level at 197.41 which is confluent with the psychological level of 197.50. - js

GJ bullishWaiting on price to take out double top liquidity. To then pull back to demands that are confluent to then go long. Let's go bulls!

GBP/JPY BEARS ARE STRONG HERE|SHORT
GBP/JPY SIGNAL
Trade Direction: short
Entry Level: 192.017
Target Level: 189.531
Stop Loss: 193.669
RISK PROFILE
Risk level: medium
Suggested risk: 1%
Timeframe: 9h
Disclosure: I am part of Trade Nation's Influencer program and receive a monthly fee for using their TradingView charts in my analysis.
✅LIKE AND COMMENT MY IDEAS✅

GBP/JPY: From Fibo Resistance to Gap SupportFor JPY-weakness I think GBP/JPY still makes for a compelling argument, especially when compared to EUR/JPY. I looked at a big spot of Fibonacci resistance that came into play earlier in the week and bulls spent three days stumbling there until sellers took firmer hold today. But - now there's another major level that's in-play and that's the 193.61 level, which has reference to all the way back in the Financial Collapse...
In August of 2008 GBP/JPY closed the month at 198.08. September opened with a far different feel, and the pair gapped-down to 193.61 to begin the month. That gap was partially filled in September but for the next seventeen years has continued to carry weight. In 2015, on the heels of Abe-nomics launching huge Yen-trends, GBP/JPY found resistance at the bottom of that gap for three months before ultimately reversing.
And then last March, that gap came back into play as resistance and in the year since, it's had a big pull on price, in both directions. Most recently that 193.61 level was resistance for the past two weeks - until the Monday breakout (and breakdown in the Yen) launched the pair past the 195.00 level. But now that Yen bulls have clawed back that early-week loss, GBP/JPY is back to testing this as short-term support, as taken from prior resistance.
Like EUR/JPY in the prior post the weekly close here is huge, as bulls failing to defend this level would not only spell a more bearish looking weekly bar, but they would be giving up defense of a major long-term level in the pair. But - until there's greater evidence of Yen-strength, GBP/JPY makes for a compelling argument for Yen-weakness scenarios, perhaps even moreso than USD/JPY with the 145.00 level a little further away. -js

SHORT ON GBP/JPYGJ Has finally pulled back to a Major Resistance area.
This previous high broke a low in the past and is a strong resistance zone.
I expect price to fall to the pervious swing low / demand are for over 300-400 pips.

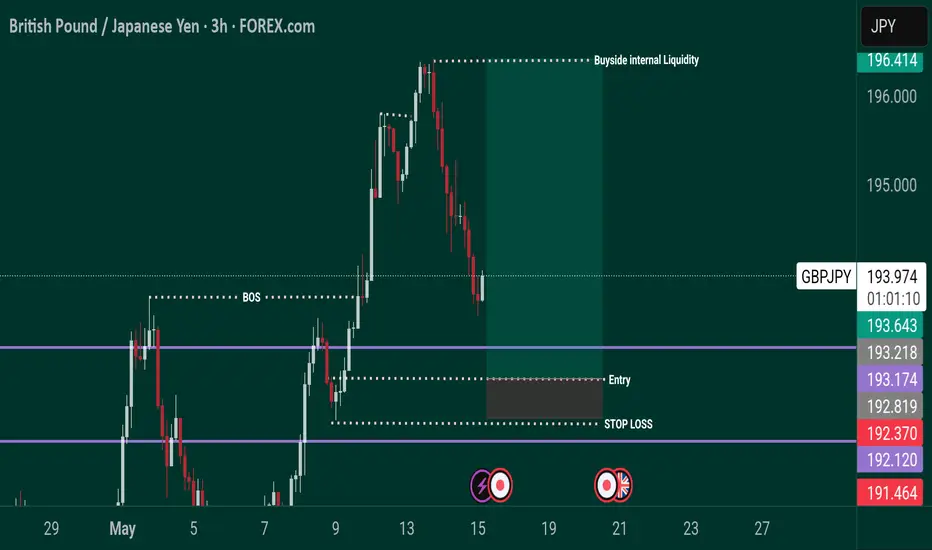
GBPJPY ChoCh + Order Block = Bearish Liquidity Hunt Setup 🧠 Smart Money Breakdown: GBPJPY | 30-Min Chart
This is one of those A+ textbook SMC setups where Smart Money is likely loading shorts before the next liquidity raid.
Let’s break it down:
🔄 1. Change of Character (ChoCh)
Market flipped structure cleanly, printing a ChoCh below a key internal low. That’s our signal that Smart Money is likely done accumulating and prepping for a distribution move.
🟪 2. Order Block + Premium Price Zone
Price is retracing into a well-defined bearish Order Block right inside a premium zone. This OB sits just below a Strong High at 195.855 — a clear inducement level. Retail traders will chase that high... and get wrecked.
You’ll notice that OB is marked around 195.341–195.600 — right where liquidity pools stack.
🧲 3. Target: Weak Low at 193.640
Smart Money doesn’t care about patterns. It wants liquidity — and there’s a juicy Weak Low sitting at 193.640 waiting to be swept.
📐 4. Trade Setup Idea (R:R Approx. 4:1)
🔼 Entry Zone: 195.300–195.500
❌ Stop Loss: Just above Strong High: 195.880
✅ Target: 193.640 (liquidity sweep)
This setup gives you a tight stop and a wide target — just how SMC likes it.
🎯 Execution Tip:
Wait for:
Rejection wick inside OB
Bearish engulfing confirmation
BOS on lower timeframe before entering
Partial TP at mid-FVG or 194.200. Let the rest run.
📎 Confluences:
✅ ChoCh
✅ Bearish OB
✅ Rejection from premium pricing
✅ Clear inducement above Strong High
✅ Weak low as draw-on-liquidity
⚠️ Risk Reminder:
Don’t front-run the OB. Let price come to you. Watch how Smart Money manipulates before you execute. Confirmation > prediction.
🔚 Summary:
GBPJPY is set for a bearish redistribution move. The structure shift, clean OB, and weak low target all scream “trap above, raid below.”
You’re either trading with Smart Money… or you’re the liquidity.
💬 Drop “🎯” if you’re targeting the same liquidity level.
📉 Follow @ChartNinjas88 for more deadly-accurate setups.
🚨 Tag a friend who keeps buying into strong highs 😅

GBPJPY SWING TRADE.📊 GBPJPY Trade Setup
Bias: Bullish (HTFs)
Current Move: Pullback to facilitate continuation of uptrend
Timeframes: Watching 1H / 15M for break of lower high (entry trigger)
🔍 Fundamentals:
JPY: Bearish
GBP: Bullish / Neutral
✅ Fundamentals support long bias
📈 Technical Setup:
Entry: On break of lower high marked on 1H/15M
TP1: 1:1.5
TP2: 1:3
SL: Below most recent swing low
Risk per trade: 1.5%
🧠 Notes:
Ensure price closes above the marked lower high before entry.
