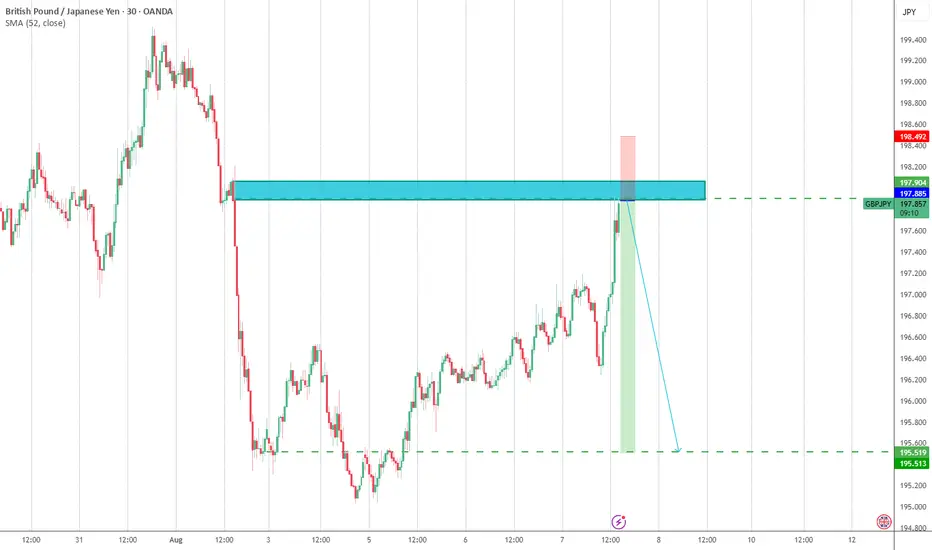
GBPJPY Sell Setup from Two Key Levels!Hey friends 👋
Here’s my carefully prepared GBPJPY analysis, just for you 📊
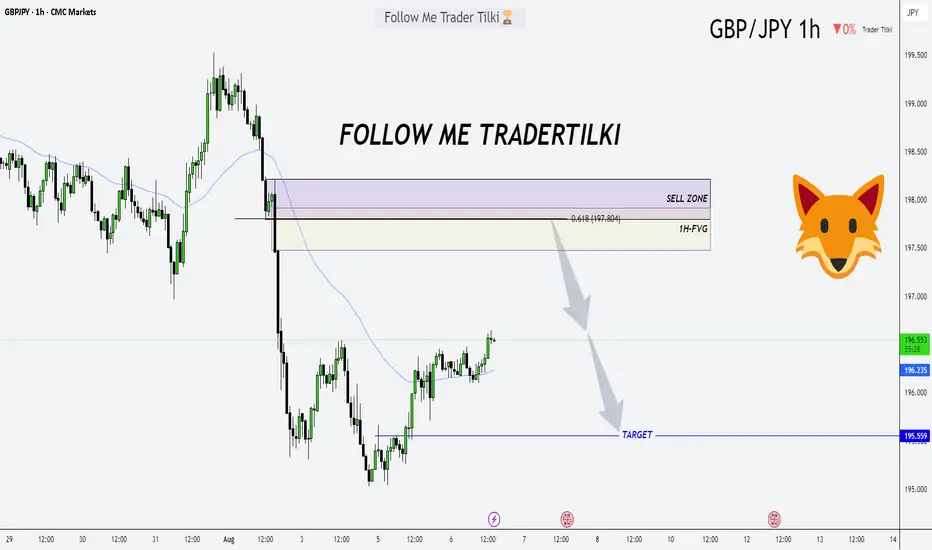
In this setup, I’ll be opening sell positions from two key levels:
1️⃣ 197.477
2️⃣ 198.100
My target level is: 🎯 195.560
Every single like you give truly fuels my motivation to keep sharing these insights.
Huge thanks to everyone who supports and encourages me with their likes 🙏
GBPJPY trade ideas
GBPJPY NEXT MOVE (expecting a bearish move)(mid term)Go through the analysis carefully, and do trade accordingly.
Anup Bias (Mid term)
Current price- 198.500
"if Price stay below 200.500 then next target is 196.500 and 191.500 and below that 189.000.
-POSSIBILITY-1
Wait (as geopolitical situation are worsening )
-POSSIBILITY-2
Wait (as geopolitical situation are worsening)
Best of luck
Never risk 2% of principal to follow any position.
Support us by liking and sharing the post.

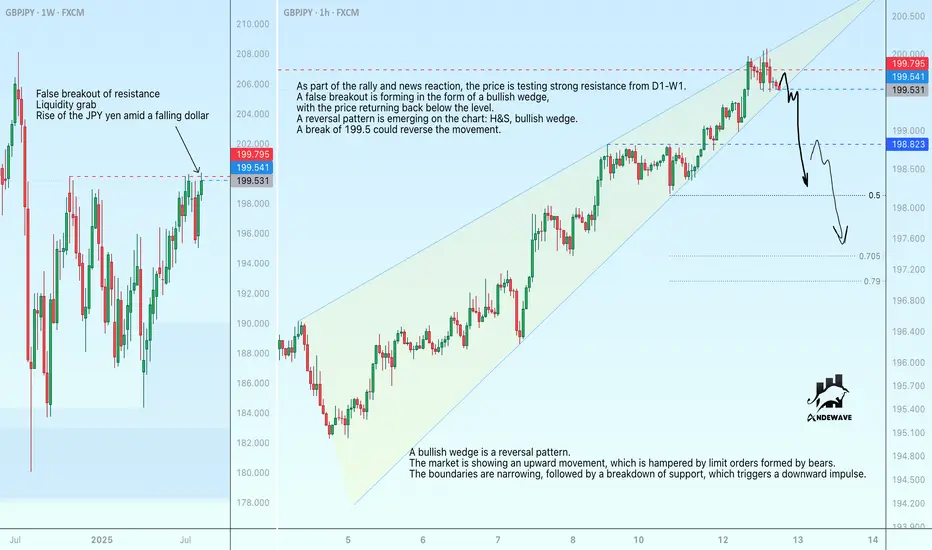
GBPJPY is forming a reversal pattern. Trend reversal...As part of the rally and news reaction, the price is testing strong resistance from D1-W1.
A false breakout is forming in the form of a bullish wedge, with the price returning back below the level. A reversal pattern is emerging on the chart: H&S, bullish wedge. A break of 199.5 could reverse the movement.
A bullish wedge is a reversal pattern. The market is showing an upward movement, which is hampered by limit orders formed by bears. The boundaries are narrowing, followed by a breakdown of support, which triggers a downward impulse.
GBPJPY Short trade set up 4H📉 GBP Swing Trade Setup – Bearish Bias
Liquidity Sweep: On 31st July, price swept key liquidity before commencing its move lower.
FVG Structure: The drop left multiple Fair Value Gaps (FVGs). Price has now fully retraced into the first FVG of this leg down, presenting a potential continuation opportunity.
Discounted Price: Current price action has retraced into discounted territory (below equilibrium of the prior swing).
Orderflow Bias: Using the Orderflow Boxing method, bias remains bearish.
Fundamental Confluence:
The Bank of England has signalled a rate-cutting cycle ahead, with commentary suggesting the nominal rate should move towards the 2–4% range.
This is typically bearish for GBP unless already fully priced into the market.
Swing Trade Plan:
Direction: Short (bearish bias)
POI: First FVG from the leg down starting 31st July
Confluences:
Liquidity sweep
Retracement into discount
Within FVG
Bearish orderflow
Dovish BoE stance
📌 This is not financial advice. For educational purposes only.

GBP/JPY Trap? Smart Money Might Be Setting Up the Next Drop📊 1. Technical Overview
Price broke the bullish structure decisively, closing below a key demand zone between 195.00–196.00, leaving a large unfilled imbalance.
Last week's recovery candle suggests a potential pullback toward 197.40–197.80, now acting as a resistance confluence.
The descending channel and weak RSI further support a continuation of the bearish trend.
Bearish targets: 193.50 and 192.20
📈 2. COT (Commitment of Traders) Report
GBP:
Non-commercials are cutting long positions (–5,961) and adding shorts (+6,637) → Bearish divergence developing on GBP.
JPY:
Non-commercials are heavily increasing short exposure (+15,113), but remain strongly net-long overall, indicating a potential exhaustion of bullish JPY positioning.
💭 3. Retail Sentiment
Positioning is neutral: 51% long / 49% short.
This balance suggests no excessive retail bias, leaving room for directional moves without immediate contrarian pressure.
📆 4. Seasonality
August is historically bearish for GBP/JPY:
• –2.82% (20Y average)
• –3.04% (15Y average)
• –1.44% (5Y average)
The data shows a consistent historical bias to the downside during this month.
🎯 5. Strategic Outlook
• Primary Bias: Bearish below 197.40–197.80
• Invalidation: Weekly close above 198.10
• Targets: 195.00 > 193.50 > 192.20
The confluence of technical rejection, bearish COT dynamics, neutral sentiment, and negative seasonality supports a corrective scenario for August.

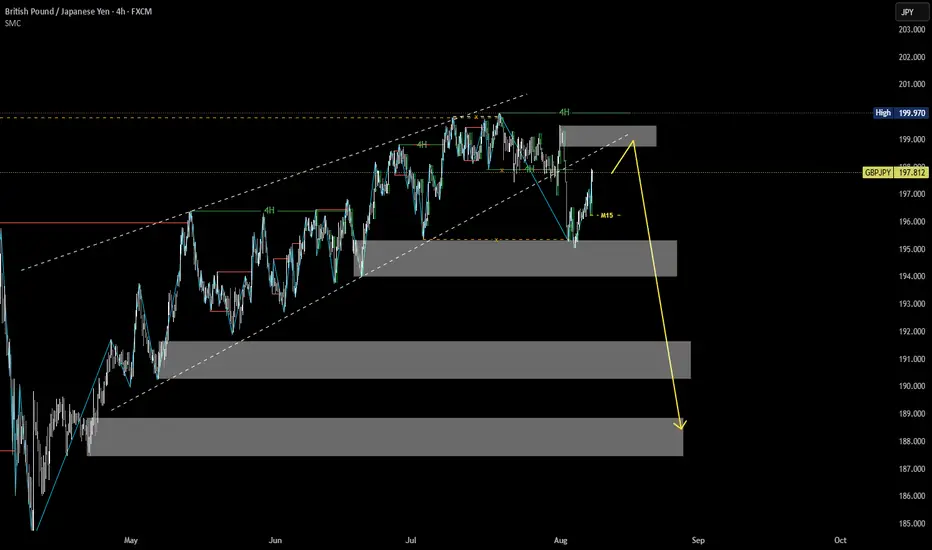
Market Structure Analysis of GBPJPY on the 4H TimeframeMulti-Timeframe Context (HTF: 4H, LTF: M15)
The main trend on the 4H chart is bearish.
Price is currently in a retracement phase (pullback).
On the M15, price is in a bullish short-term structure.
We monitor the M15 market structure closely to look for signs of weakness and identify high-probability short entries in alignment with the 4H downtrend.
GBPJPY Forming Bullish ContinuationGBPJPY has broken upward from a multi-test demand zone near the 195.00–195.50 area on the daily chart, and buyers are now stepping in confidently. Price is holding above that support and pushing toward the upper resistance region. A clean move and close above 200.00 could set the stage for a further leg upward, targeting the 207.30 zone as indicated on the chart.
From a macro perspective, recent developments are in favor of the pound and against the yen. The Bank of England has started easing, cutting rates to 4% with a "gradual and careful" tone, but still remains relatively hawkish amid sticky inflation pressures. Meanwhile, the Bank of Japan remains cautious, keeping rates low, which continues to exert weakening pressure on the yen overall.
Technically, the bounce from that demand zone and clear upward momentum indicate a strong continuation pattern. As long as the pair stays above 195.50, the trend remains bullish. Traders may look to enter on dips with stops below that zone, aiming for the 207.30 level where resistance and liquidity converge.
Overall, GBPJPY is showing a compelling trend-following opportunity driven by both technical structure and fundamental divergence. Breaking above 200 would likely accelerate momentum toward the 207 area. It’s a high-probability setup with clearly defined risk levels and strong macro alignment—not to be missed.

GBPJPY SELL SWEET SETUP SHOOOOOOOOOOOOORT HHHHHHHHHI think we should research selling opportunity
because we have uptrend line has broken and tested
and we have bearish channel and the price reflect from resistance on time frame 1W
SO SHORTLY i will sell Especially since we have a rebound from the imbalance as well.
Look at this picture as it makes it clearer to you

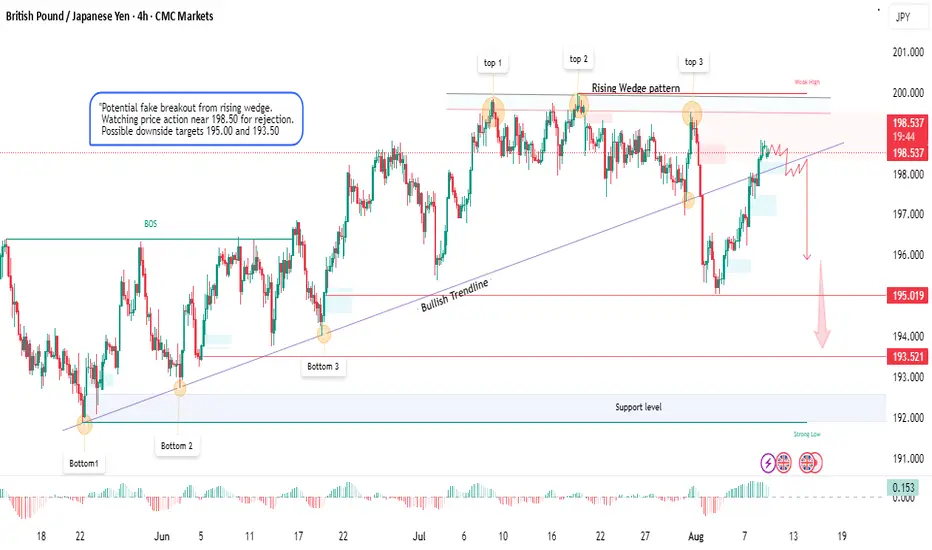
GBP/JPY–Potential Fake Breakout from Rising Wedge/KeyLevelsAheadGBP/JPY is currently testing the 198.50 resistance area after forming a Rising Wedge pattern on the 4H chart. This zone has historically acted as a strong rejection point (previous tops), and the current structure suggests a possible fake breakout scenario.
Key observations:
Pattern: Rising Wedge following a bullish trendline from June lows.
Resistance: 198.50–200.00 remains a critical supply zone.
Rejection Signals: Multiple failed attempts to hold above this level (Tops 1, 2, and 3).
Downside Targets: If price confirms rejection, potential short-term targets are 195.00 and 193.50.
Support: Major support zone near 191.50–192.00.
Trading Plan:
I am closely monitoring price action around 198.50. A clear bearish rejection with strong volume could trigger a sell-off toward the mentioned targets. If buyers push above 200.00 with strong momentum, the bearish scenario becomes invalid.
⚠️ Risk Management: Always wait for confirmation before entering trades. Use stop-loss orders and avoid over-leveraging. This is not financial advice — for educational purposes only
GBP/JPY WEEKThis week in the markets was nothing short of amazing. I stayed sharp, made calculated moves, and turned challenges into opportunities. Every trade taught me something new, and I kept my focus steady even when the charts got wild. It felt good to see my strategy pay off and my confidence grow with every win. Overall, it was a powerful reminder that persistence, patience, and smart decisions can really make the difference. Ready to keep this momentum going! OANDA:GBPJPY

GBP/JPY - Full Trade Plan📉 GBP/JPY Short Setup – Structure Cracking Below
Pair: GBP/JPY
Timeframe: 4H / Daily
Bias: Bearish
Entry Zone: 196.900 - 197.100 (71% + EMA Retest)
Target Zones:
🔹 TP1: 195.00
🔹 TP2: 190.00 (W-Target)
🧠 Technical Breakdown:
✅ 4H Structure Shift Confirmed
Price has broken and shifted structure on the 4H timeframe.
Multiple BOS (Breaks of Structure) confirm a weakening bullish trend.
✅ Daily Still Holding – But Weak
Daily structure hasn't fully flipped yet, but bullish pressure is cracking.
This gives us a high-risk-reward opportunity before full higher-timeframe confirmation.
✅ Breakout & Retest + 71% Retracement
Classic breakout and retest pattern from the high.
Price has pulled back into the 71% Fib level, providing a premium entry.
✅ Retest of EMA + Contested POI
Price also tested the 4H EMA, acting as dynamic resistance.
This zone overlaps with a previous point of interest (POI) – heavy confluence for sell pressure.
📌 Sell Plan:
Sell Zone: 196.900 – 197.100 (watch for rejection candles or LTF structure breaks)
Stop Loss: Above the last swing high or EMA
Take Profits:
TP1: 195.00
TP2: 190.00 (Weekly Target)
⚠️ Risk Management
Only execute once LTF confirms entry (M15/M5 BOS or bearish engulfing rejection).
Position size with R:R in mind; this setup offers a potential 1:4+ move.
🗓️ Market Outlook:
GBP/JPY is showing early signs of rolling over. The 4H shift, combined with a premium retest and EMA rejection, creates a clean short window. Watch the daily close for full confirmation.
🔔 Like and follow for more clean smart money & structure-based setups.

GBPJPY : Short-Term Bullish SetupGBPJPY – Short-Term Bullish Setup
GBPJPY has just broken above a minor resistance zone, signaling a shift in short-term momentum.
The previous 1-hour candle closed strong and bullish, suggesting that the pair could continue gaining strength in the next few hours.
This move appears to be driven mainly by market speculation and ongoing tariff discussions, adding fuel to the bullish outlook.
Key levels to watch:
196.05
196.45
197.00
You may find more details in the chart!
Thank you and Good Luck!
PS: Please support with a like or comment if you find this analysis useful for your trading day
Disclosure: I am part of Trade Nation's Influencer program and receive a monthly fee for using their TradingView charts in my analysis.

GBPJPY SELLEIGHTCAP:GBPJPY , Expectation that GBPJ will resume the bearish moves from the indicated sell zone is very high due to the recent price actions at these level. sell GBPJ

GBP/JPY 1D Chart - OANDAdaily performance of the British Pound (GBP) against the Japanese Yen (JPY) as of August 12, 2025, with a current value of 199.248 (+0.264 or +0.13%). The chart includes a bullish trendline, a highlighted resistance zone around 203.575, and key support levels at 199.079 and 196.683. Buy and sell signals are marked at 199.259 and 199.236 respectively, with a projected upward movement indicated.

Breaker Block - Trend ContinuationGBPJPY is currently Bullish.. The current structure signal an Upward movement.. The presence of an inducement after the BOS validates our Breaker Block for Buy continuation

GBPJPY: More Growth is Coming! 🇬🇧🇯🇵
GBPJPY will likely bounce from a key daily support,
following a formation of a double bottom pattern
on an hourly time frame.
I think that the price will reach 196.7 level soon.
❤️Please, support my work with like, thank you!❤️
I am part of Trade Nation's Influencer program and receive a monthly fee for using their TradingView charts in my analysis.

GBPJPYLet´s see if this up movement is only fake image of what the price needs to do.
For me till tomorrow afternoon the trend needs to be bearish.
Don´t put a big order.
You can see my account "passiveincomes" in signal start.
thks
blessings.
BUY ROAD MAP FOR GBPJPYGBPJPY Update
Price is respecting the bullish channel and reacted well from the internal structure (blue arrow 📍). Expecting a short-term pullback before continuation to higher targets.
🔽 TP Zone: 195.45
🔼 Final TP: 199.51
Watching price action closely around key demand zones.

UPDATE: GBP/JPY heading to target but like a Dungbeetle!Another analysis done in May with a W Formation.
It broke above then below then tested the resistance (neckline) three times.
Before it turned back up.
So now we are getting good traction for upside (if the interest daily charges haven't eaten enough of the portfolio.
And now we will just wait for the price to head to the first target of 205.66
W Formation
Price>20 and 200MA
Target 205.66
Disclosure: I am part of Trade Nation's Influencer program and receive a monthly fee for using their TradingView charts in my analysis.

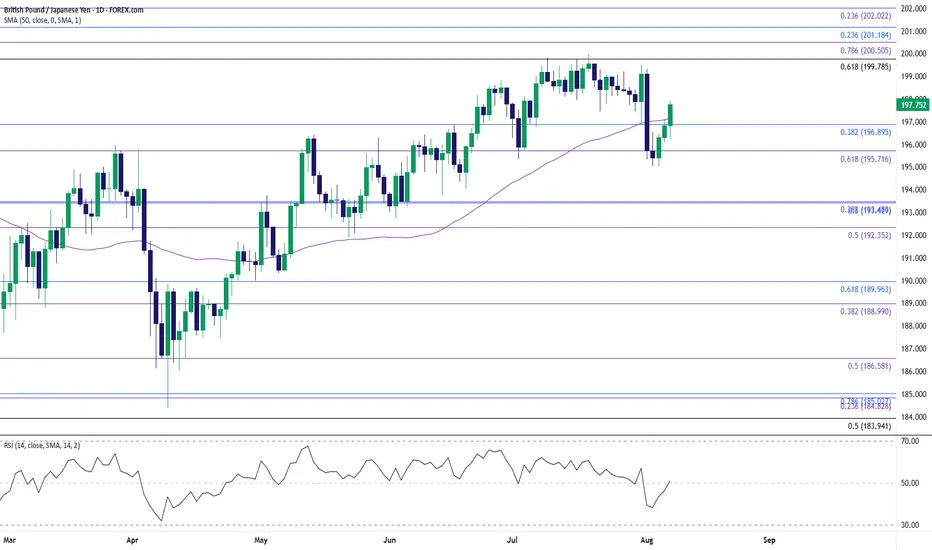
GBP/JPY Stages Three-Day RallyGBP/JPY climbs to a fresh weekly high (197.93) as it stages a three-day rally, and a close above the 195.70 (61.8% Fibonacci extension) to 196.60 (23.6% Fibonacci extension) region may lead to a test of the July high (199.98).
A breach above 201.20 (23.6% Fibonacci retracement) opens up 202.00 (23.6% Fibonacci extension), but GBP/JPY may struggle to extend the recent series of higher highs and lows should fail to close above the 195.70 (61.8% Fibonacci extension) to 196.60 (23.6% Fibonacci extension) region.
A breach of the monthly low (195.04) may GBP/JPY toward the June low (192.73), with a move/close below the 192.40 (50% Fibonacci extension) to 193.50 (38.2% Fibonacci extension) zone opening up the May low (190.33).
--- Written by David Song, Senior Strategist at FOREX.com
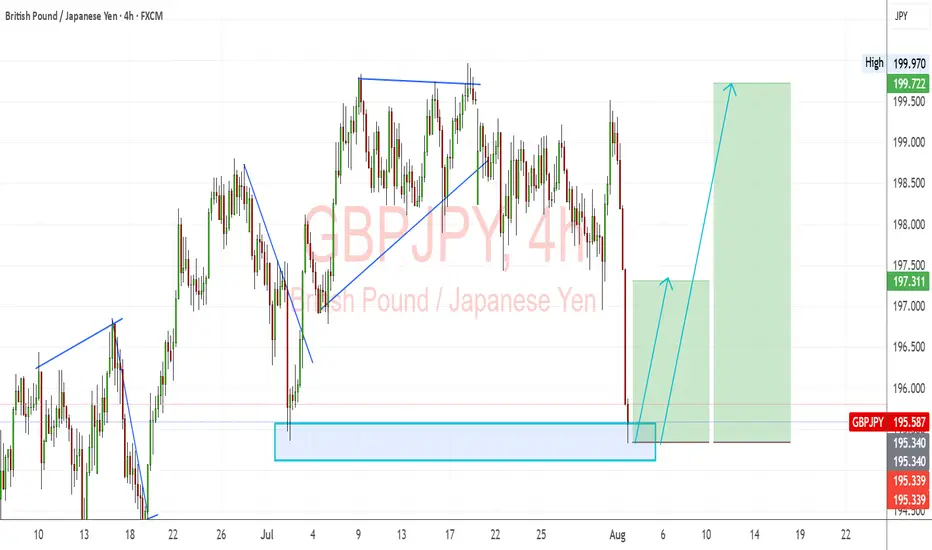
GBPJPY: Strong Bullish Reversal from Demand ZoneGBPJPY has bounced sharply from a key demand zone, indicating renewed bullish momentum. The pair continues to follow the broader bullish bias in GBP crosses, with JPY weakness driven by the Bank of Japan's dovish policy stance.
Technical Analysis (4H Chart)
Pattern: Bullish rejection from the 195.30–195.50 demand zone.
Current Level: 195.58, rebounding from strong support, setting up for a potential upward leg.
Key Support Levels:
195.34 – immediate demand zone and critical support.
194.90 – deeper backup support if a pullback occurs.
Resistance Levels:
197.31 – near-term resistance and first upside target.
199.72 – extended target if bullish continuation strengthens.
Projection: As long as 195.34 holds, GBP/JPY could push toward 197.31, with potential for 199.72 if GBP strength persists.
Fundamental Analysis
Bias: Bullish.
Key Fundamentals:
GBP: Supported by the BOE’s cautious but tight stance due to persistent inflation pressures.
JPY: Remains fundamentally weak, with the BoJ avoiding major policy tightening while intervention threats only provide short-term support.
Risk Sentiment: Mild risk-on conditions favor GBP over safe-haven JPY.
Risks:
BoJ FX intervention could temporarily strengthen JPY.
A dovish BOE shift could slow GBP momentum.
Key Events:
BOE policy updates and UK CPI.
BoJ commentary and risk sentiment indicators.
Leader/Lagger Dynamics
GBP/JPY is a leader among JPY pairs due to GBP’s volatility and strength. It often outpaces EUR/JPY and CHF/JPY, making it a key pair for JPY sentiment shifts.
Summary: Bias and Watchpoints
GBP/JPY is bullish, with price rebounding from the 195.34 demand zone. Upside targets are 197.31 and 199.72. Watch for BOE communication, BoJ intervention signals, and global risk sentiment for confirmation of the move.
A strong short bias on gbpjpyGBPJPY is on a key supply zone , so i anticipate that price may reject going above that area , since it has shown previously to have respected that strong supply zone , apply risk management when taking the short position

GBP/JPY Long Attack After MA Breakout – Loot the Beast!🔓 GBP/JPY Bullish Break-In Heist! 💷💣 Price Cracked the MA Vault 🎯
🏴☠️ Welcome to the GBP/JPY Treasure Run!
Thief Trader’s back in the FX vault—this time we’re after the Beast Pair. A clean moving average breakout just unlocked the vault at 196.900, and we’re going in heavy with layered long entries!
📈 Heist Blueprint:
Asset: GBP/JPY
🧭 Plan: Bullish (Price has broken key MA level)
🎯 Entry: ANY price above 196.900 (after MA breakout confirmation)
📉 Stop Loss: 195.000 (secure the backdoor)
💰 Target: 199.500 (clean getaway zone)
🔫 Entry Method: Limit orders stacked like trapdoors — Thief’s layering strategy in motion!
💼 Strategy Breakdown:
⚔️ Scalp Raiders: Snipe quick profits on the M15-M30 pullbacks.
🛡 Swing Bandits: Ride this bullish wagon up to 199.500. Use trailing SL to stay alive.
📡 Chart Radar: Eyes on volume spikes + MA alignment = green signal for aggressive buys.
🧠 Market Logic Behind the Heist:
🔥 MA breakout confirms buyer strength
🔍 Intermarket flow supports GBP dominance
📊 Sentiment & positioning flip to bullish
💼 Risk events priced in – no traps detected (yet)
🚨 Caution for Rookie Thieves:
News bombs ahead? Lock down with tighter SLs or pause the raid until the dust settles.
💎 Join the Crew of Chart Bandits!
👍 Like this plan? 🔁 Share it.
💬 Drop your view. 💣 Boost it with a 🚀
We're not just trading—we’re robbing the market with style.
🔐 Stay dangerous, stay profitable…
THIEF TRADER OUT. 🏴☠️📉📈
