GBPJPY BuyPrice has induced the low and channe of asia session within Frankfurt. Price should continue upward to take out asia range.
GBPJPY trade ideas

GBPJPY SHORT FORECAST Q2 W25 D16 Y25GBPJPY SHORT FORECAST Q2 W25 D16 Y25
Professional Risk Managers👋
Welcome back to another FRGNT chart update📈
Diving into some Forex setups using predominantly higher time frame order blocks alongside confirmation breaks of structure.
Let’s see what price action is telling us today!
💡Here are some trade confluences📝
✅Daily order block
✅15' order block
✅Intraday breaks of structure
✅Daily high rejection
🔑 Remember, to participate in trading comes always with a degree of risk, therefore as professional risk managers it remains vital that we stick to our risk management plan as well as our trading strategies.
📈The rest, we leave to the balance of probabilities.
💡Fail to plan. Plan to fail.
🏆It has always been that simple.
❤️Good luck with your trading journey, I shall see you at the very top.
🎯Trade consistent, FRGNT X

Bullish ContinuationI am expecting the price to continue higher from here targeting the daily weak HH.

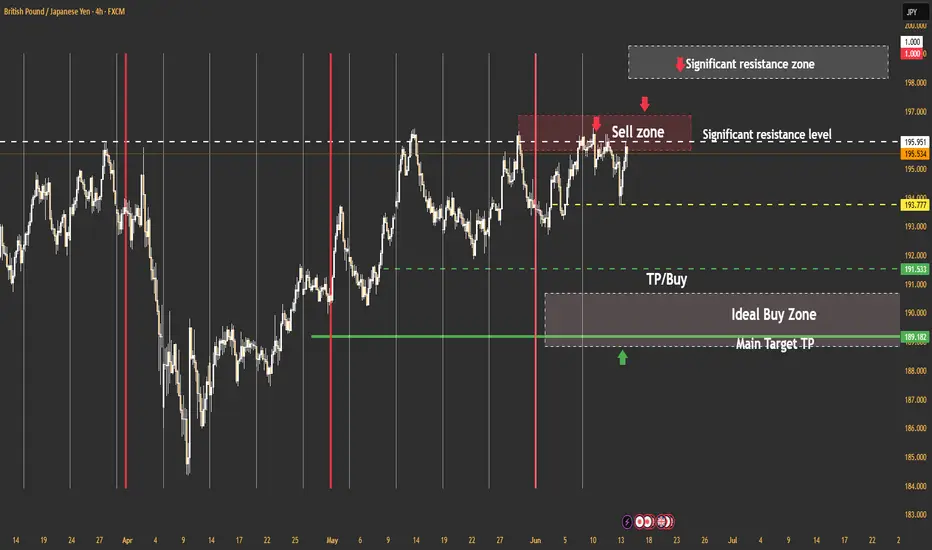
GBPJPY. |||. HITTING selling zone soonthe zone followed by a sharp rejection.
---
🧠 Smart Money Insight:
Possible SMC-style reaction anticipated:
Liquidity inducement above highs
Sharp rejection from seller zone
BOS (Break of Structure) for confirmation
Right-side inset illustration highlights expected distribution before drop.
---
🔎
---
🧩 Trading Plan:
Wait for price action confirmation in the supply zone.
Look for M15/H1 shift in structure and strong bearish engulfing patterns.
Risk management is key: Place stop-loss above zone highs.

GBPJPY - Medium term prediction - 16/06/25Here’s how I see GBP/JPY in this well-defined range:
Key levels
Resistance: 199.81 (multiple rejections since late 2023)
Support: 191.43 (holds going back to mid-2024)
Range dynamics
Price has spent the last 18 months oscillating between these two lines—no sustained trend outside the band.
We’re currently stuck just below the midpoint (~195.6) with failure to break higher into 196–197.
Momentum & recent action
Near-term momentum is drifting lower (series of lower highs into resistance).
No bullish catalyst convincing enough to clear 197–199.
Slide down to 191.43 ~60% Favors another mean-reversion off the top half of range
Rally up to 199.81 ~40% Needs a clear break above 196.5 with follow-through

GBP/JPY Tests 196.4FenzoFx—GBP/JPY is testing the 196.4 monthly high, a fragile resistance after four previous attempts.
On Friday, bulls pushed higher with a long-wick candlestick, but the Stochastic Oscillator signals an overbought market.
The bullish trend remains intact if GBP/JPY holds above 193.8 support. A breakout above 196.4 may target 198.3, while closing below support could shift momentum downward.

GBPJPY| Bullish Shift in ProcessGBPJPY broke its major lower high on the 4H, signaling a shift in directional intent to the upside. While external liquidity remains intact, I’m monitoring for a potential continuation setup.
On the 30-minute timeframe, price broke a significant high and internal structure is now aligned with bullish order flow. I’ve marked a near-term zone where price may pull back into — specifically watching for a sweep of short-term liquidity within an internal order block.
No rush. Just waiting for price to offer a high-probability entry aligned with refined structure and flow.
— Inducement King 👑
Bless Trading!

GBPJPY - Look for Long (INTRADAY) 1:4.5 and Short (SWING) 1:XXGBPJPY appears to remain in a distribution phase from the supply zone, making its way toward the next demand zone on the higher time frame. We might see a potential sell opportunity during any consolidation before the price continues trending toward the demand area.
Let’s wait and see how price action develops — there’s a chance for entries in both directions, but only if a clear consolidation forms. Otherwise, it’s best to remain patient and look for setups at the next key resistance level.
Disclaimer:
This is simply my personal technical analysis, and you're free to consider it as a reference or disregard it. No obligation! Emphasizing the importance of proper risk management—it can make a significant difference. Wishing you a successful and happy trading experience!


GJ Update - June 14 - 4HI don’t trade triangles, but I don’t ignore them either. A breakout to the upside is possible, but as long as price stays below a key resistance level, my primary bias remains short. Even if price breaks higher, I’ll stay cautious and operate on the 1H timeframe as usual. GJ is known for sharp drops. I expect a clear move within the next two weeks. On Monday, I’ll have a better view on my entry and exit for the week.
GBPJPY WEEKLY HTF FORECAST Q2 W25 Y25GBPJPY WEEKLY HTF FORECAST Q2 W25 Y25
Professional Risk Managers👋
Welcome back to another FRGNT chart update📈
Diving into some Forex setups using predominantly higher time frame order blocks alongside confirmation breaks of structure.
🔑 Remember, to participate in trading comes always with a degree of risk, therefore as professional risk managers it remains vital that we stick to our risk management plan as well as our trading strategies.
📈The rest, we leave to the balance of probabilities.
💡Fail to plan. Plan to fail.
🏆It has always been that simple.
❤️Good luck with your trading journey, I shall see you at the very top.
🎯Trade consistent, FRGNT X

GBPJPY Short then Long to 198.000Looking to take an intraday short depending on PA and opening of market then looking for the long setup to 198.00.

GBPJPY : Could price break the resistance area?Looking at the 1-hour chart of GBP/JPY, price is currently trading around 195.53, caught between two significant zones. Immediate resistance lies around the 196.40–196.50 area, where price has previously rejected several times—this is a strong supply zone.
On the downside, the 194.40–194.60 zone acts as key support and demand, with price bouncing off this level multiple times, showing buyers are still defending it.
The overall structure still respects a higher low formation, supported by an ascending trendline from the end of May, suggesting bullish bias unless that structure breaks.
Next week, keep an eye on UK CPI and BOE rate decision—both could be big movers. If CPI comes in hot, it could spark bullish momentum and push GBP/JPY through the 196.50 ceiling.
On the other hand, dovish BOE commentary could reverse sentiment fast. For now, potential long entries could be considered near 194.60 support with targets toward 196.50, while shorts might be taken around the resistance zone with tight stops and confirmation.
Always watch for breakout or rejection signs at these levels before committing.

Forex Pairs. Orderflow and Thought Process. Part 1Outlined overall orderflow on currency pairs. Go ahead and check it out

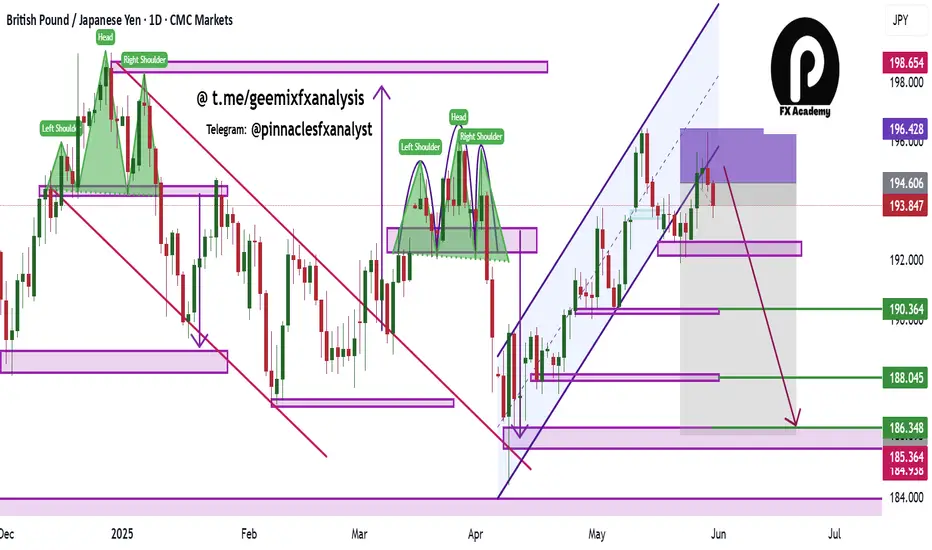
GBPJPY At the Top? Massive Liquidity Grab📈 1. Price Action & Key Technical Levels (Daily Chart)
Price reached a major supply zone between 196.0 and 197.0, showing clear rejection (weekly pin bar and a lower high structure relative to the previous peak).
The long-term descending trendline acted as resistance again.
A confirmed rising wedge pattern broke to the downside, with first target around 191.4, and extended target near 187.4 (key demand zone with historical confluence).
Weekly RSI shows a bearish divergence vs price highs – an additional signal of bullish exhaustion.
📊 2. COT Data (as of June 3, 2025)
GBP (British Pound)
Net long positions increased by +30,371 contracts (Commercial + Non-Commercial).
Non-Commercials: 103,672 long vs 68,457 short → net long +35,215 but the increase is relatively modest.
Commercials are increasing both long and short positions, but the net delta supports medium-term GBP resilience.
JPY (Japanese Yen)
Net short worsened by -13,566 contracts.
Non-Commercials are cutting longs and adding shorts → aggressive yen selling.
Commercials remain heavily short (275,659 vs 100,151 long).
➡️ COT Conclusion: GBP remains structurally strong, but the JPY is now extremely oversold, increasing the likelihood of a technical correction in favor of JPY (GBPJPY pullback).
📉 3. Retail Sentiment
72% of retail traders are short GBPJPY, with an average entry at 191.2.
Current price is above 195.8 → a liquidity sweep above retail shorts may have already occurred.
The order book shows a heavy sell cluster between 195.0–195.9 → potential zone of manipulation/liquidation.
➡️ Contrarian view: After sweeping liquidity above retail highs, we may now see downside pressure to clean out breakout longs.
📅 4. Seasonality
June tends to be neutral to bearish:
5-year average: +0.45% (weak gain)
10- and 15-year averages: -1.24% and -1.30%
Historically, the first 10 days of June often mark a local top, followed by a decline – consistent with the current price structure.
🧠 5. Macro-Technical Confluence
The broader setup points to a distribution phase between 195.5–196.5, with high probability of a technical pullback toward 193.5–191.4 in the short-to-medium term.
The yen's oversold conditions may ease temporarily, supporting a corrective GBPJPY retracement.
Break below 193.5 would confirm the move toward 191.4 and eventually 187.4 – an area of institutional interest.
🔍 Trade Setup Summary (Bias: Bearish)
Technical context: Short setup confirmed by structure break, divergence, and supply rejection.
Macro/sentiment context: Supports a corrective pullback on the pair.
Strategy: Look for intraday weakness below 195.0–194.5 → targeting 193.5, then 191.4.
Invalidation: Daily/weekly close above 197.0.

GBP/JPY Consolidates After Pushing Above May HighGBP/JPY consolidates after pushing above the May high (196.41) earlier this week, but the pullback in the exchange rate may turn out to be temporary as it holds above the monthly low (192.73).
In turn, a move/close above the 195.70 (61.8% Fibonacci extension) to 196.60 (23.6% Fibonacci extension) region may lead to a test of the January high (198.26), with the next area of interest coming in around the December high (198.96).
However, lack of momentum to push/close the 195.70 (61.8% Fibonacci extension) to 196.60 (23.6% Fibonacci extension) region may push GBP/JPY back towards the monthly low (192.73), with a break/close below the 192.40 (50% Fibonacci extension) to 193.50 (38.2% Fibonacci extension) zone bringing the May low (190.33) on the radar.
--- Written by David Song, Senior Strategist at FOREX.com

GBP_JPY LOCAL SHORT|
✅GBP_JPY has been growing recently
And the pair seems locally overbought
So as the pair is approaching a horizontal resistance of 196.400
Price decline is to be expected
SHORT🔥
✅Like and subscribe to never miss a new idea!✅
Disclosure: I am part of Trade Nation's Influencer program and receive a monthly fee for using their TradingView charts in my analysis.

GBPJPY Strong rebound. Buy opportunity.The GBPJPY pair has been trading within an Ascending Triangle pattern. Today's geopolitics made the price form its latest Higher Low at the bottom of the pattern, which also coincided with a 4H MA200 (orange trend-line) test, and rebounded.
That was a clear buy signal on the 4H RSI Support that signaled the last three bottom buys. Our Target is the top of the pattern at 196.300.
-------------------------------------------------------------------------------
** Please LIKE 👍, FOLLOW ✅, SHARE 🙌 and COMMENT ✍ if you enjoy this idea! Also share your ideas and charts in the comments section below! This is best way to keep it relevant, support us, keep the content here free and allow the idea to reach as many people as possible. **
-------------------------------------------------------------------------------
Disclosure: I am part of Trade Nation's Influencer program and receive a monthly fee for using their TradingView charts in my analysis.
💸💸💸💸💸💸
👇 👇 👇 👇 👇 👇

possibility of correctionIt is expected that a trend change will take place in the current resistance range and we will witness the beginning of a downward trend. If the price consolidates above the resistance range, the continuation of the upward trend is likely.

GBPJPY at a Turning Point: Triple Top Signals Potential DeclineGBPJPY at a Turning Point: Triple Top Signals Potential Decline
Fundamental Analysis:
GBP is showing signs of weakness against the Japanese Yen following the latest UK employment data. The UK unemployment rate rose to 4.6% for the three months ending in April, while the Claimant Count Change increased by 33.1K in May.
Meanwhile, hawkish expectations for the Bank of Japan (BoJ) continue to strengthen the Japanese Yen.
Technical Analysis:
GBPJPY has encountered strong resistance near the recent highs for the third time, increasing the likelihood of a decline, as seen on the chart. The price action suggests the formation of a triple top pattern, which could trigger a deeper drop from this zone.
Targets:
🎯 194.70 🎯 193.60 🎯 192.40
You may find more details in the chart!
Thank you and Good Luck!
❤️PS: Please support with a like or comment if you find this analysis useful for your trading day❤️
Disclosure: I am part of Trade Nation's Influencer program and receive a monthly fee for using their TradingView charts in my analysis.

GBPJPY SHORT FORECAST Q2 W24 D13 Y25GBPJPY SHORT FORECAST Q2 W24 D13 Y25
Professional Risk Managers👋
Welcome back to another FRGNT chart update📈
Diving into some Forex setups using predominantly higher time frame order blocks alongside confirmation breaks of structure.
Let’s see what price action is telling us today!
💡Here are some trade confluences📝
✅Daily order block
✅15' order block
✅Intraday breaks of structure
✅4H 50 EMA rejection
🔑 Remember, to participate in trading comes always with a degree of risk, therefore as professional risk managers it remains vital that we stick to our risk management plan as well as our trading strategies.
📈The rest, we leave to the balance of probabilities.
💡Fail to plan. Plan to fail.
🏆It has always been that simple.
❤️Good luck with your trading journey, I shall see you at the very top.
🎯Trade consistent, FRGNT X

GBPJPYI believe my analysis will help expose how the price moves in the market. It is clear that the price moves forming different patterns giving hints as to what we could expect next.
The price has been moving in an ascending channel, it got broken and retested, I believe the price will eventually fall towards my arrow head.
GBP/JPY trendGBP/JPY is trading within an ascending channel and has recently bounced strongly from the key support area around 193.77. As long as this level holds, the price is expected to push higher toward the resistance at 194.81 and potentially 195.45. A break below 193.77 would invalidate the bullish scenario and could indicate a shift to a more neutral or bearish structure.
