GBP/JPY Bearish Pullback to Key Fibonacci LevelsGBP/JPY shows a strong bearish move followed by a consolidation near the 0.236–0.382 Fibonacci retracement zone. I’m monitoring this area closely as price retests the 0.5 (194.648) and 0.618 (194.855) Fibonacci levels — classic zones for bearish continuation setups.
This setup suggests that price may reject the 0.618 zone, especially if volume and candle structure confirm resistance. My trade idea is based on short entries near 0.5–0.618 with a potential continuation toward 193.33 (-0.25) and 192.68 (-0.618 extension).
GBPJPY trade ideas


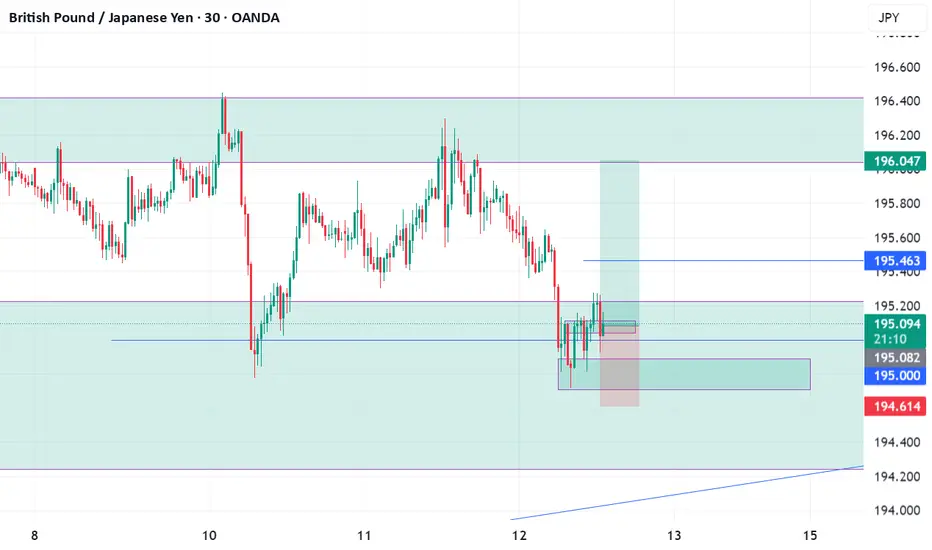
GBP/JPY - Triangle Breakout (12.06.2025)The GBP/JPY Pair on the M30 timeframe presents a Potential Selling Opportunity due to a recent Formation of a Triangle Breakout Pattern. This suggests a shift in momentum towards the downside in the coming hours.
Possible Short Trade:
Entry: Consider Entering A Short Position around Trendline Of The Pattern.
Target Levels:
1st Support – 194.34
2nd Support – 193.76
🎁 Please hit the like button and
🎁 Leave a comment to support for My Post !
Your likes and comments are incredibly motivating and will encourage me to share more analysis with you.
Best Regards, KABHI_TA_TRADING
Thank you.
Disclosure: I am part of Trade Nation's Influencer program and receive a monthly fee for using their TradingView charts in my analysis.

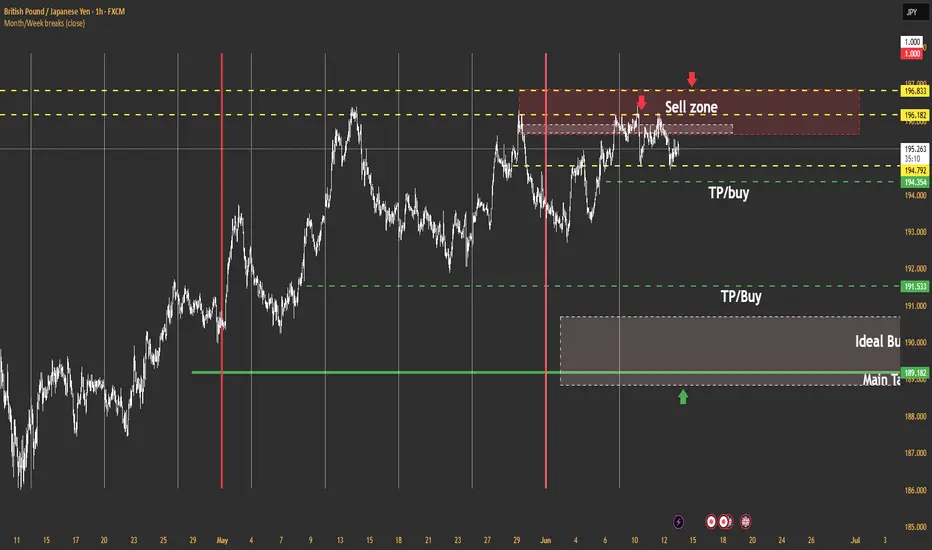
Update GJ June 12No sell confirmation yet. Until then, I'm scalping — 20 to 50 pips a day.
Structurally, a swing higher wouldn’t surprise me, but anything can happen. Keep monitoring the levels.
Notice how price respected the levels I mapped out in advance — these are not random lines.
Stay prepared. Anticipate with patience!
Gbpjpy sellA major downward move is expected from GBP/JPY. If the trendline is broken and the price exits the consolidation zone, it could drop to the 189 area. However, if the price stabilizes above 196.411, this analysis would not be valid.

GBPJPY – Golden Pocket Breakout SetupTimeframe: 1H | 🎯 Bias: Bullish Breakout
GBPJPY is testing a key Fibonacci retracement zone (0.5–0.618) from the recent impulse leg (194.00 → 196.195). This golden pocket sits inside strong demand and could launch the next leg higher.
🔍 Technical Confluence
Fib Support Zone: 195.270–195.447 (0.618–0.5)
Price Action: Consolidating near golden pocket, showing rejection wicks
Structure: Higher highs and higher lows intact
RSI: Resetting around 45–50, leaving room for momentum buildup
Next Resistance: 196.200 (previous high), then 197.300 and 198.500
🧠 Fundamental Confluence
GBP Strength Drivers:
BoE's "hawkish cut" tone — restrictive policy to fight sticky inflation
UK macro improving: upcoming GDP & labor data could surprise to the upside
Market pricing less aggressive easing compared to peers = GBP premium
JPY Weakness Factors:
COT RSI at 100% = overbought positioning
BoJ delays normalization to 2027
Risk-on flows (VIX ~16.7) reducing safe-haven demand
Macro Flows: Bullish NASDAQ + stable oil → support GBPJPY upside
Macro Themes:
Oil & NAS100 bullish = supports GBPJPY upside
Market unwinding defensive positions = bullish for GBPJPY
🛠 Trade Plan
📥 Entry Option 1: Buy on bullish reaction from 195.27–195.45 (Fib golden pocket)
📥 Entry Option 2: Break and close above 196.200 (confirmation entry)
🛑 Stop Loss: Below 195.00 (under Fib + recent structure)
🎯 TP1: 196.80
🎯 TP2: 198.00 (measured move)
📌 “Golden pockets don’t lie when fundamentals align.”

Lingrid | GBPJPY potential Extension after Bullish BreakoutOANDA:GBPJPY is consolidating just above the key support around 195.05 after bouncing from a higher low and failing to hold the recent breakout above PMH. The bullish structure remains intact within the upward channel, but the pair is currently lacking momentum. If price holds above 195.00 and forms a new bullish wave, a push toward 198.00 remains likely.
📈 Key Levels
Buy zone: 194.80–195.20
Buy trigger: bullish confirmation above 195.60
Target: 198.00
Sell trigger: break below 194.80 with strong volume
💡 Risks
Failure to hold 195 could shift structure to neutral
Extended range may lead to choppy conditions
Yen strength could trigger sudden reversals from resistance
Traders, if you liked this idea or if you have your own opinion about it, write in the comments. I will be glad 👩💻


MY PRICE ACTION IDEA 1. 4-Hour Chart:
○ You identify a clear uptrend (making HH and HL).
○ You mark a significant 4-hour Support Level where price has bounced strongly multiple times in the past.
○ Confluence: Strong uptrend + major support. Your bias is to buy.
2. 30-Minute Chart:
○ Price pulls back from a recent high and approaches your identified 4-hour support level.
○ As price touches the 4-hour support, a large Bullish Engulfing Bar forms and closes. The body of this candle completely engulfs the previous bearish candle.
○ Confluence: Price at 4H support + Bullish Engulfing Bar + aligns with 4H uptrend. This is your potential setup.
3. 5-Minute Chart:
○ After the 30-minute Bullish Engulfing Bar closes, you switch to the 5-minute chart.
○ You see that after the engulfing bar, the 5-minute chart has formed a new higher low and then broken above a short-term 5-minute resistance level, with a strong bullish 5-minute candle closing above it.
○ Entry: You enter a long trade immediately after the 5-minute confirmation candle closes.
○ Stop Loss: Place your stop loss just below the low of the 30-minute Bullish Engulfing Bar (or slightly below the 4-hour support).
○ Take Profit: Identify the next major 4-hour resistance level as your target.
○ Confluence: 30M signal confirmed by 5M structure break + tight stop loss placement.
GBPJPY Intraday Bearish sideways consolidationThe GBP/JPY currency pair continues to display a bearish outlook, in line with the prevailing downward trend. Recent price action suggests a corrective pullback, potentially setting up for another move lower if resistance holds.
Key Level: 196.50
This zone, previously a consolidation area, now acts as a significant resistance level.
Bearish Scenario (rejection at 196.50):
A failed test and rejection at 196.50 would likely resume the bearish momentum.
Downside targets include:
194.20 – Initial support
193.00 – Intermediate support
191.90 – Longer-term support level
Bullish Scenario (breakout above 196.50):
A confirmed breakout and daily close above 196.50 would invalidate the bearish setup.
In that case, potential upside resistance levels are:
197.50 – First resistance
198.30 – Further upside target
Conclusion
GBP/JPY remains under bearish pressure, with the 196.50 level acting as a key inflection point. As long as price remains below this level, the bias favors further downside toward the 194.20–191.90 region. However, a sustained break above 196.50 would shift sentiment bullish, targeting 197.50 and beyond. Traders should watch for price confirmation around 196.50 to assess the next move.
This communication is for informational purposes only and should not be viewed as any form of recommendation as to a particular course of action or as investment advice. It is not intended as an offer or solicitation for the purchase or sale of any financial instrument or as an official confirmation of any transaction. Opinions, estimates and assumptions expressed herein are made as of the date of this communication and are subject to change without notice. This communication has been prepared based upon information, including market prices, data and other information, believed to be reliable; however, Trade Nation does not warrant its completeness or accuracy. All market prices and market data contained in or attached to this communication are indicative and subject to change without notice.

GJ 6/10/25 APre-Analysis
1) Session Break (A took out NY)
2) Expecting? (Trend)
3) High Volume located at (End)
4) Leg being traded? (1)
5) Market digestion? (1hr)
6) Edge? (S1) higher TF is (1hr)
7) Edge Specifics? (S1H)
8) Continuation
9) Micro Timeframe (15min)
10) Class (B)

GBPJPY Uptrend and Bullish Continuation Patterns on H4 TFDespite price being in a daily resistance zone, GBPJPY is still showing strong signs of being bullish. I would caution against committing to any short positions - at least on a long term basis.

GBP/JPY) Bearish analysis Read The captionSMC trading point update
Technical analysis of GBP/JPY (British Pound / Japanese Yen) based on multiple Technical signals on the 4-hour timeframe. Let's break it down in detail:
---
Overall Analysis Summary
Direction Bias: Bearish
Timeframe: 4H
Price (at analysis time): 195.033
Tool Used: EMA 200, RSI, Support/Resistance, Chart Pattern
---
Technical Components
1. Strong Resistance Zone (~195.800 - 196.200)
Marked by 3 red arrows.
Price has rejected this level multiple times, forming a Triple Top pattern.
Suggests strong selling pressure and low probability of price breaking higher in the short term.
2. Trendline Break (Structure Shift)
Ascending support trendline (marked with "$$$") is broken.
This is a key market structure break, indicating the bullish momentum is weakening or reversing.
3. EMA 200 (193.661)
Price is currently just above the 200 EMA.
A clean break and close below the EMA would confirm trend reversal.
EMA often acts as dynamic support/resistance.
---
Target Zones
Two downside targets are indicated:
Target 1: 192.600
Minor support level, could be the first stop for bearish pressure.
Target 2: 190.733
Strong historical support zone (yellow box labeled big support level).
Also aligns with measured move from the top of the range to the base (height of the range).
---
RSI (Relative Strength Index)
RSI (14): ~43.40
Neutral zone (not oversold yet), meaning there’s room for more downside before oversold conditions are hit.
---
Trading Psychology & Risk Management
This setup assumes:
Sellers continue to defend the resistance zone.
Break of structure (trendline + EMA) confirms shift.
Traders may consider short entries below 194.800–195.000 with stops above 196.200.
---
Trade Idea (Based on This Chart)
Entry: Below 194.800 (after break confirmation)
Stop-Loss: Above 196.200
Take-Profit 1: 192.600
Take-Profit 2: 190.733
Risk-Reward: Favorable (~1:2+)
Mr SMC Trading point
---
Caution
If price reclaims 196.200 and closes above the resistance, bearish setup is invalidated.
Watch for fakeouts near EMA.
plesse support boost 🚀 this analysis)

GBPJPY Will Go Higher! Buy!
Here is our detailed technical review for GBPJPY.
Time Frame: 1D
Current Trend: Bullish
Sentiment: Oversold (based on 7-period RSI)
Forecast: Bullish
The market is approaching a significant support area 194.845.
The underlined horizontal cluster clearly indicates a highly probable bullish movement with target 199.003 level.
P.S
Overbought describes a period of time where there has been a significant and consistent upward move in price over a period of time without much pullback.
Disclosure: I am part of Trade Nation's Influencer program and receive a monthly fee for using their TradingView charts in my analysis.
Like and subscribe and comment my ideas if you enjoy them!

GBPJPYConclusion: Fundamentals and institutional positioning align with the bearish technical setup. Short rallies may offer opportunities to sell. GBP/JPY – Bearish Bias Confirmed by COT Data

Why? Because liquidity is building at this support zone.🚨 GBP/JPY Traders — Don’t Get Trapped! 🚨
GBP/JPY has just touched a major support level, and on the surface, it looks like a golden buying opportunity. But here’s the catch: this is exactly where most retail traders get trapped.
Why? Because liquidity is building at this support zone. Smart money knows retail traders have stop losses and pending orders sitting right below — and they’re coming for it. 🧠💰
Here’s what the market is likely to do next:
📈 Step 1: A small bullish bounce to lure retail traders in. Everyone starts thinking, “This is the reversal!”
🔄 Step 2: Boom — a sharp move down. Stop hunts. Fakeouts. Panic sells. The market dips below support, grabbing liquidity.
🚀 Step 3: Once liquidity is swept and BPR (Break Point Range) is hit, then the real move begins.
This is a classic setup — trap retail, feed institutional orders, and then drive the market in the true direction.
⚠️ Don’t fall for the bait. Stay patient. Let the trap spring before you strike.
📊 Watch structure. Watch liquidity. Watch price behavior. That’s where the edge is.
DYOR — Do Your Own Research. This isn’t financial advice — it’s a trader’s insight.
Trade smart. Trade sharp. 💼🔥

GJ-Thu-12/06/25 TDA-Bearish structure building up, will go down?Analysis done directly on the chart
Follow for more, possible live trades update!
If 195.000 support zone breaks, we can definitely
see GJ pushing lower and continue its bearish
momentum especially after GBP GDP worst than
expected which is bearish for GBP.
Active in London session!
Not financial advice, DYOR.
Market Flow Strategy
Mister Y

GBP/JPY💰Symbol: { GBP/JPY }
🟩Price: { 196.094 }
🟥Stop: { 196.872 }
1️⃣profit: { 195.469 }
2️⃣profit: { 194.816 }
3️⃣profit: { 194.044 }
4️⃣profit: { 193.270 }
5️⃣profit: { 192.754 }
📊Check your chart before entering.
🚨Check before use to make sure there is no important news.🚨

GBPJPY Hello traders. There is a sell opportunity on the GBPJPY pair. We just need to wait for the price to retest the marked level. Once that happens, it will present a good entry opportunity. You can consider joining the trade with the following targets:
🔍 Trade Details
✔️ Timeframe: 15-Minute
✔️ Risk-to-Reward Ratio: 1:2
✔️ Trade Direction: Sell Limit
✔️ Entry Price: 195.251
✔️ Take Profit: 194.715
✔️ Stop Loss: 195.519
🔔 Disclaimer: This is not financial advice. I’m simply sharing a trade I’ve taken based on my personal trading system, strictly for educational and illustrative purposes.
📌 Interested in a systematic, data-driven trading approach?
💡 Follow the page and turn on notifications to stay updated on future trade setups and advanced market insights.

#GBPJPY TODAY'S PRICE ACTION SETUP BEARISH
The GBPJPY Pair traded in Ascending channel to major Resistance then started consolidating 196.32 price region a strong bearish pressure can pull the price back to 192.55 support price level.

GBP/JPY Remains Trapped in a Sideways ChannelAt the moment, GBP/JPY continues to face steady buying pressure, which has held firm as the yen weakens gradually, driven by a temporary easing in trade war tensions. This has diminished the yen’s appeal as a safe-haven asset in the short term. While the bullish bias remains intact, it has not been strong enough to break out of the broad sideways channel that has defined price action in recent months.
Wide Sideways Channel
Since October 2024, the pair has remained confined within a broad horizontal range, bounded by resistance at 198.245 and key support at 188.437. So far, price movements have been insufficient to break out of this channel in the short term, making it the most relevant structure to monitor in the upcoming sessions.
Short-Term Uptrend
Within this broader range, bullish price swings have formed a steady short-term uptrend. However, recent moves have failed to produce higher highs, signaling a possible pause in upward momentum. If a neutral bias persists, this could challenge the ability of the uptrend to break free from the larger range.
Indicator Divergence
Flat price highs in GBP/JPY, combined with lower highs in RSI and MACD, have formed a bearish divergence, pointing to potential short-term exhaustion in buying pressure. This market imbalance could open the door for corrective selling in the near term if the divergence persists.
Key Levels to Watch:
196.406 – Current Resistance: Marks recent highs and could trigger short-term selling corrections if tested again.
198.245 – Major Resistance: Upper boundary of the broader sideways channel. A break above this level would invalidate the range and potentially signal a stronger bullish bias in upcoming sessions.
193.078 – Key Support: Aligns with the ascending trendline and the 50- and 200-period moving averages. A return to this level would reinforce the neutral tone and extend the current range-bound structure.
Written by Julian Pineda, CFA – Market Analyst

GBPJPY Technical & Order Flow AnalysisOur analysis is based on a multi-timeframe top-down approach and fundamental analysis.
Based on our assessment, the price is expected to return to the monthly level.
DISCLAIMER: This analysis may change at any time without notice and is solely intended to assist traders in making independent investment decisions. Please note that this is a prediction, and I have no obligation to act on it, nor should you.
Please support our analysis with a boost or comment!

GBPJPY for long 15m*The content on this analysis is subject to change at any time without notice, and is provided for the sole purpose of assisting traders to make independent investment decisions.
