GBPJPY POTENTIAL SHORT OPPORTUNITY ???Yes the gbpjpy is in a very strong uptrend. However it might meet some resistance soonwhich will slow down the bulls. Lets see how this plays out
GBPJPY trade ideas
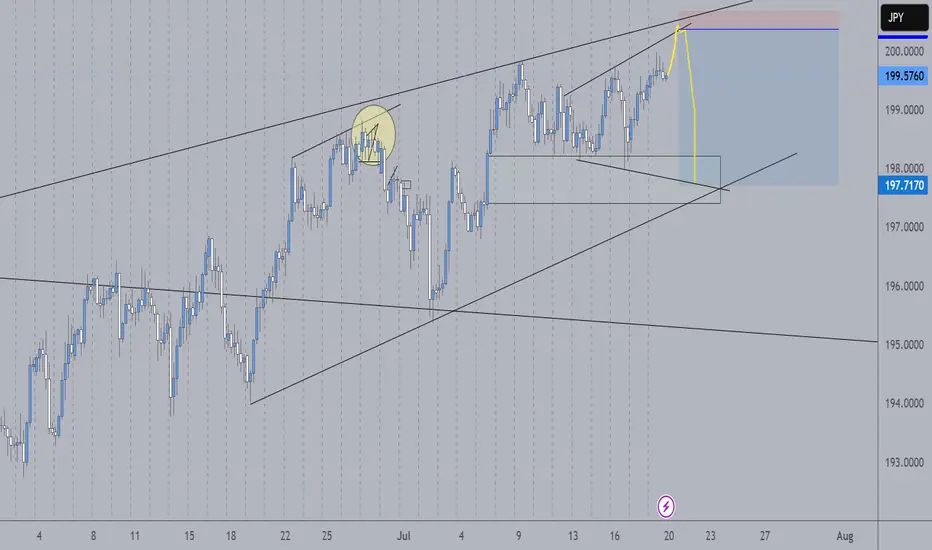
gbp/jpymultiple rejections from the key supply/resistance zone i dont see a reason why market wouldnt target the support/demand zone.

GBPJPY - 1D SetupThe Japanese yen may get stronger for a while due to the weakening of the British Economy, which may lead to a pullback of the GBPJPY currency, and this seems to be a good trading opportunity in sells with a strict stop-loss. OANDA:GBPJPY
Note- This is my own view and not a financial advice as trading comes with high risk.


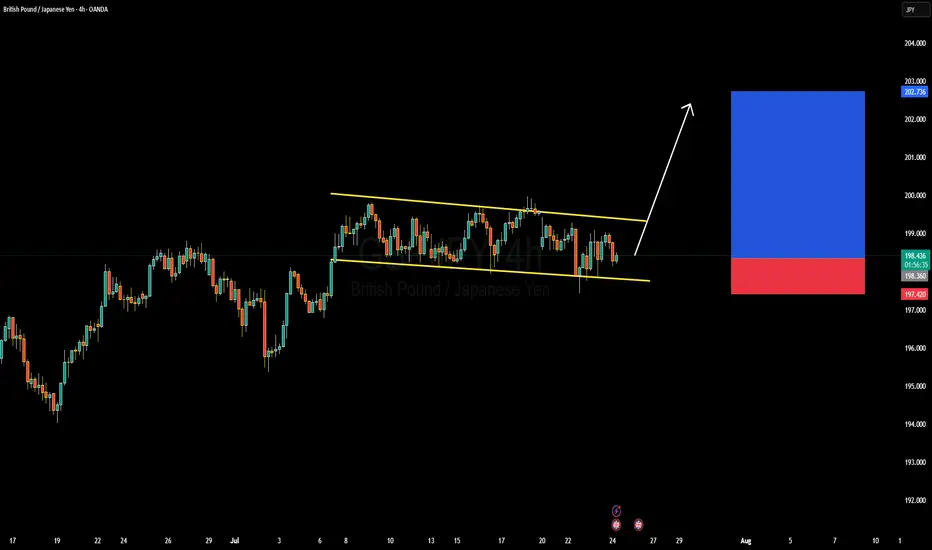
GBP/JPY SYMMETRICAL TRIANGLESYMMETRICAL TRIANGLE Completion: A potential breakout scenario for GBP/JPY involves the currency pair moving sharply out of a symmetrical triangle pattern. If the pair breaks above the upper trendline, it could signal a bullish move, with traders targeting higher resistance levels. Conversely, a break below the lower trendline may indicate a bearish trend, prompting a search for support levels.

CHECK GBPJPY SIGNAL UPDATE GO READ CAPTAINEntry Point: Around 198.650 TO 198.550
Take Profit 1: 199.050
Take Profit 2: 199.500
Last Target: 199.900
Stop Loss: 198.050

GBPJPY Forming Descending ChannelGBPJPY is currently trading within a well-defined descending channel on the 4H chart, showing signs of building pressure toward an upside breakout. The price has consistently respected both the upper and lower bounds of this channel, creating a controlled correction within a larger bullish trend. With the recent bounce off the lower channel boundary, the pair is now preparing for a potential bullish breakout, aiming for a target zone near 202.700 in the coming sessions.
From a fundamental perspective, the British pound is benefiting from hawkish commentary by the Bank of England, which continues to battle sticky inflation. The latest UK inflation data suggests that price pressures remain elevated, prompting market participants to anticipate further tightening or a prolonged hold in interest rates. On the other hand, the Japanese yen continues to weaken due to the Bank of Japan’s ultra-loose monetary policy, making GBPJPY attractive for long positions amid widening yield differentials.
Technically, the structure remains bullish in the broader context, and this descending channel looks more like a bullish flag—a continuation pattern. If bulls maintain momentum and break above the upper trendline near 199.50, we can expect a strong impulsive move toward the 202–203 zone. The risk remains well-defined below 197.40, which is the recent swing low, giving a healthy risk-to-reward setup for traders.
With strong technical structure and fundamental divergence favoring the British pound over the yen, GBPJPY presents a high-probability long opportunity. I'm looking for confirmation of a breakout on lower timeframes, and once triggered, I expect clean bullish follow-through. Stay ready for the breakout—it’s a textbook setup aligning with macro and technical confluence.
GBPJPY Potential UpsidesHey Traders, in the coming week we are monitoring GBPJPY for a buying opportunity around 197.900 zone, GBPJPY is trading in an uptrend and currently is in a correction phase in which it is approaching the trend at 197.900 support and resistance area.
Trade safe, Joe.

Possible GBY/JPY bullish?I did mark my chart. You can look at it and decipher accordingly! If you have any ideas or mark ups please drop them or tag me in them :)

Gbpjpy buy The pound looks like it has finally given a signal for a buy bouncing off a nice support zone and fib , I can see a good healthy rise from 198.126 take profits at 199.857


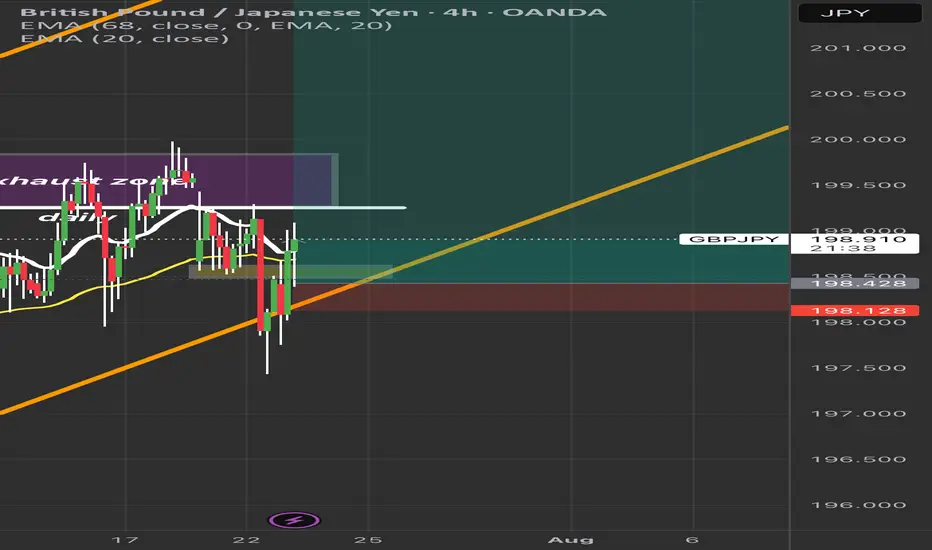
GBPJPY Breakout or Trap? Price in Key Exhaustion Zone | 4H ChannGBPJPY is sitting at a critical point inside an ascending channel. After rejecting the exhaustion zone multiple times, price is trying to reclaim bullish momentum. Key levels to watch:
✅ Bullish Bias: Hold above 198.400 and break past 199.200 for continuation toward 200.000+.
⚠️ Bearish Risk: A break below 198.400 could signal a deeper correction.
The 20 EMA and 68 EMA are converging—expect a strong move soon!
Question: Do you think we break out or fake out? Comment below! 👇
#GBPJPY #ForexTrading #PriceAction #ForexSignals #GBPJPYAnalysis #TradingView #ForexSetup #TechnicalAnalysis #ForexStrategy #SwingTrading #ForexEducation #ForexMarket #DayTrading
Bull Market, Bear Move: Temporary Shift or Trend Change?Hello Traders,
Welcome to the new trading week.
The daily timeframe remains in a strong bullish trend; however, recent price action shows a break in alignment on the 4-hour chart. After sweeping a weak daily higher high, the 4-hour structure has shifted bearish, indicating a potential retracement or deeper correction. This internal shift suggests that price may now be heading toward the last weak low as liquidity and structural targets align. Caution is advised until the 4-hour and daily biases realign.

GBPJPY outlook: Potential Sell Setup FormingPrice action has recently broken out of a sustained uptrend and completed a retest of the former trendline support, now acting as resistance. This behavior suggests a potential bearish setup is developing.
📉 Entry Level: ~198.700
🛑 Stop Loss: 199.200
🎯 Take Profit Targets:
• TP1: 196.515
• TP2: 194.521
We’re now watching for confirmation to enter short, anticipating a move toward the stated profit targets should momentum continue to shift in favor of the bears.

GBPJPY short at current market priceH4 candle closed in doji pattern, hint for buyer started losing the strength.
i'm short at current market price.
target to take profit at 198.60
calculate your own risk & reward
Good luck

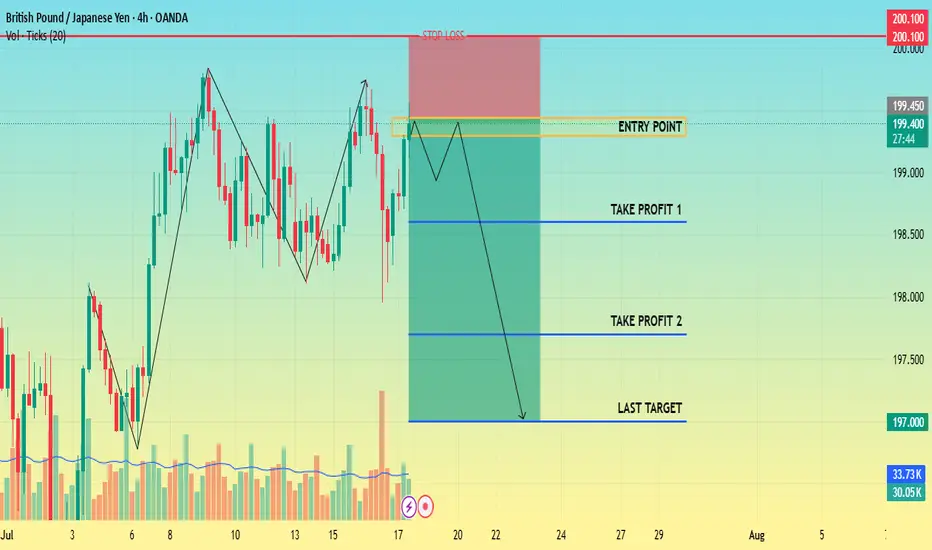
CHECK GBPJPY SIGNAL READ CAPTAIN📍 Trade Setup Overview
Trade Direction: Short (Sell)
Entry Point: Around 199.450
Stop Loss: Around 200.100
🎯 Target Levels
Take Profit 1:
198.500
Take Profit 2:
197.800
Last Target:
197.000
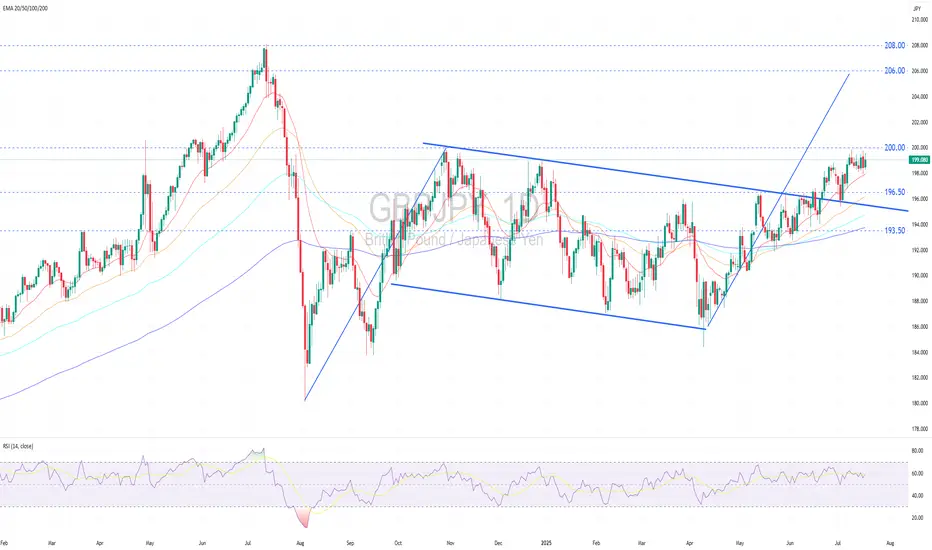
GBPJPY Remains in a Solid Uptrend.GBPJPY remains in a solid uptrend.
Technical Outlook:
GBPJPY remains in a firm uptrend, forming a series of higher highs and higher lows while holding above widening bullish EMAs, signaling strong bullish momentum.
Price is currently consolidating sideways near the recent peak, following a successful retest of the broken descending trendline, a classic bullish continuation setup.
No clear reversal signals have emerged, and the range-bound action suggests accumulation ahead of a potential upward breakout (above 200.00).
A decisive breakout above the psychological resistance at 200.00 would confirm a trend-following breakout, opening upside targets at 206.00 (flagpole projection) and potentially 208.00 (2024 high).
Near-term pullbacks may find support at 196.50 , the prior breakout zone, before resuming the uptrend.
Fundamental Outlook:
The pound is supported by higher-than-expected inflation data for June, with the UK’s Consumer Price Index (CPI) coming in at 3.6%, nearly twice the BoE target. This has led markets to expect that the BoE might delay or pause interest rate cuts at its upcoming meeting in August.
Moreover, the UK Prime Minister’s strong commitment to fiscal discipline has played a pivotal role in reinforcing investor confidence, thereby lending further support to the pound.
In contrast, the BoJ continues to adopt a cautious stance, keeping its policy rate at a relatively low at 0.50%. This conservative approach reflects the central bank’s intent to monitor the economic impacts of US tariff increases before any further action.
The BoJ’s low-rate policy sustains yen carry trades, driving capital outflows into higher-yielding US assets, mostly US treasury bonds, and intensifying downward pressure on the yen.
Analysis by: Krisada Yoonaisil, Financial Markets Strategist at Exness

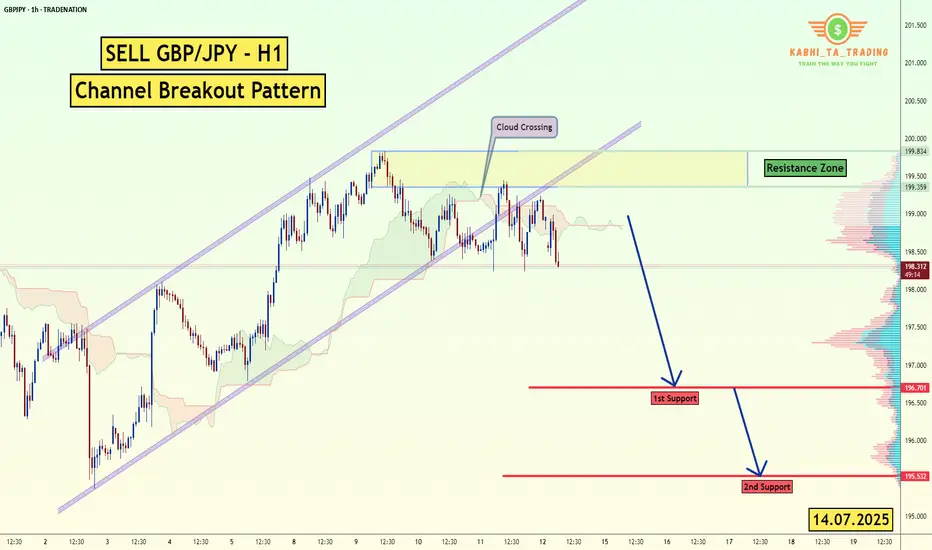
GBP/JPY -H1- Channel Breakout (14.07.2025)The GBP/JPY Pair on the H1 timeframe presents a Potential Selling Opportunity due to a recent Formation of a Channel Breakout Pattern. This suggests a shift in momentum towards the downside in the coming hours.
Possible Short Trade:
Entry: Consider Entering A Short Position around Trendline Of The Pattern.
Target Levels:
1st Support – 196.70
2nd Support – 195.53
🎁 Please hit the like button and
🎁 Leave a comment to support for My Post !
Your likes and comments are incredibly motivating and will encourage me to share more analysis with you.
Best Regards, KABHI_TA_TRADING
Thank you.
Disclosure: I am part of Trade Nation's Influencer program and receive a monthly fee for using their TradingView charts in my analysis.
GBPJPY SELLThe break of the support level on the H4 is complete. Looking at the retest of the broken support for the continuation of the fall

Waiting for the bigger move with GBPJPYHi Traders!
Right now, GJ is failing to swing higher at a major resistance at 199.200. Looking at the 4HR, yesterday July 16th, price wicked down to 198.000 retesting a previous 4HR CHOCH, then pulling back up to continue consolidation in between 198.000 and 199.200. However, on the 4HR price didn't close below 198.000 with continuation, which would make me believe that if the new 4HR CHOCH is valid, eventually price will break through 199.200. This will require patience if I want a bigger move. A more conservative approach to this trade, for me, would be entering on the break with a retest/bounces off 199.200.
SL below a new HL, TP1: 201.000, Overall TP: 202.000.
In addition, the only way I would sell is if price broke down past 198.500/198.200, and kept rejecting. Then, I could see a downside. But, imo price action just it's giving that confirmation right now.
*DISCLAIMER: I am not a financial advisor. The ideas and trades I take on my page are for educational and entertainment purposes only. I'm just showing you guys how I trade. Remember, trading of any kind involves risk. Your investments are solely your responsibility and not mine.*

GBP/JPY) Bearish Analysis Read The captionSMC trading point update
Technical analysis of GBP/JPY on the 3-hour timeframe, suggesting a potential short-term pullback within a larger ascending channel.
---
Analysis Summary
Pair: GBP/JPY
Timeframe: 3H
Current Price: 198.883
Bias: Bearish move toward channel support
---
Key Technical Insights
1. Ascending Channel Formation:
Price is moving within an upward-sloping channel.
Current structure suggests price is heading toward the lower trendline support.
2. Support Level & Target Zone:
The yellow zone around 196.355 is a major support area and target point, coinciding with both structural support and the bottom of the channel.
3. EMA (200 Close):
Price is still above the 200 EMA (197.067), so overall trend remains bullish — but current move is a correction.
4. RSI (14):
RSI is neutral near 51.14, allowing room for further downward movement before becoming oversold.
---
Target Point
Target: 196.355 (support zone and bottom of channel)
---
Trade Idea
Direction Entry Stop-Loss Target
Sell 198.80–199.00 Above 199.70 196.35
SMC trading point
---
Summary
GBP/JPY is likely to retrace toward support at 196.35 before possibly bouncing within the larger bullish structure. This offers a short-term selling opportunity, with potential buy setups near the lower trendline later.
Please support boost 🚀 this analysis)

Breakout upPrice is in a right angle broadening descending triangle . Looking for breakout to the upside. 177 pips target should equal the last move down.
