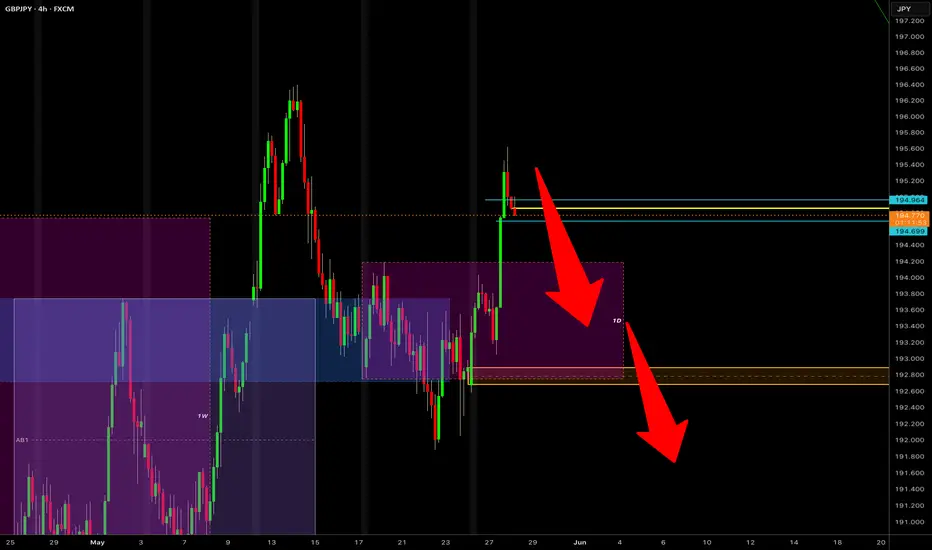
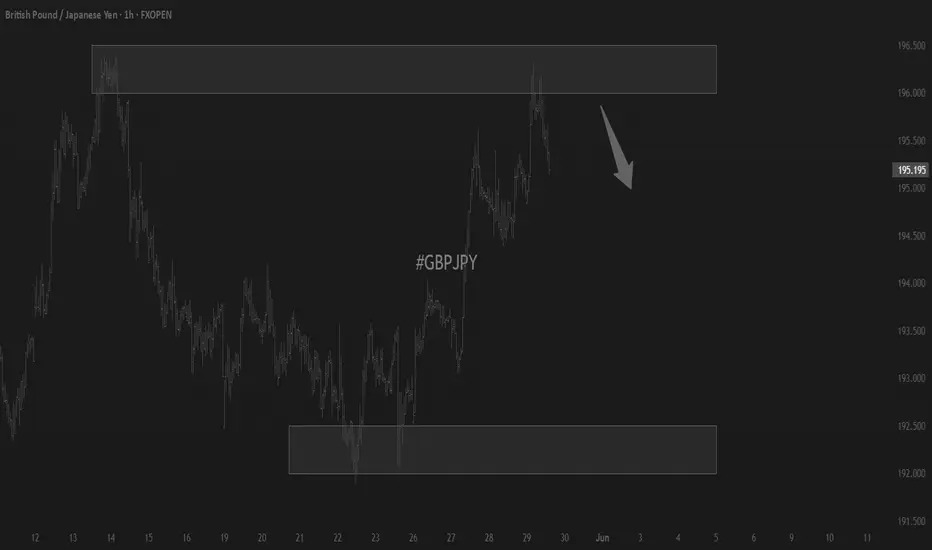
GBPJPY INTRADAY capped at 196.50The GBP/JPY currency pair continues to display a bearish outlook, in line with the prevailing downward trend. Recent price action suggests a corrective pullback, potentially setting up for another move lower if resistance holds.
Key Level: 196.50
This zone, previously a consolidation area, now acts as a significant resistance level.
Bearish Scenario (rejection at 196.50):
A failed test and rejection at 196.50 would likely resume the bearish momentum.
Downside targets include:
194.20 – Initial support
193.00 – Intermediate support
191.90 – Longer-term support level
Bullish Scenario (breakout above 196.50):
A confirmed breakout and daily close above 196.50 would invalidate the bearish setup.
In that case, potential upside resistance levels are:
197.50 – First resistance
198.30 – Further upside target
Conclusion
GBP/JPY remains under bearish pressure, with the 196.50 level acting as a key inflection point. As long as price remains below this level, the bias favors further downside toward the 194.20–191.90 region. However, a sustained break above 196.50 would shift sentiment bullish, targeting 197.50 and beyond. Traders should watch for price confirmation around 196.50 to assess the next move.
This communication is for informational purposes only and should not be viewed as any form of recommendation as to a particular course of action or as investment advice. It is not intended as an offer or solicitation for the purchase or sale of any financial instrument or as an official confirmation of any transaction. Opinions, estimates and assumptions expressed herein are made as of the date of this communication and are subject to change without notice. This communication has been prepared based upon information, including market prices, data and other information, believed to be reliable; however, Trade Nation does not warrant its completeness or accuracy. All market prices and market data contained in or attached to this communication are indicative and subject to change without notice.
GBPJPY trade ideas

Trading balanceTrading balance The price of the asset has rebounded from the balance zone. With the prospect of growth into the resistance zone.
GBP/JPY Elliott Wave Count Warns of Impending Sell-OffThe GBP/JPY pair has just completed a 5-wave downtrend, which ended around early April. Since then, the price has been moving higher in what appears to be a typical A-B-C corrective pattern — a common move that occurs after a major downtrend in Elliott Wave Theory.
We are currently in the final wave (C) of this correction, and within that, it appears that Wave 5 of C is now unfolding. This final wave appears to be nearing its end, and the price is approaching a strong resistance area between 196.813 and 197.513.
T1: 193.735
T2: 192.133
SL: 198.252
❌ Invalidation Level:
If the price closes above 198.252, this Elliott Wave count is likely wrong. That could mean the market is preparing for a bigger rally instead.

GBPJPY BUYHonestly speaking, it wasn't funny for all JPY pairs last week, everybody collect, Hopefully the recovery that we are now seeing on some jpy pairs these week will stands. I shared trade ideas on GBPJPY, currently we are seeing some promising moves from team bullish. lets join the flow.

CHECK GBPJPY SIGNAL READ CAPTAIN( gbpjpy) buy zone
( trade satup )
entry point (194.518) to (194.720) 📊
first tp (195.150)📊
2nd target (195.835) 📊
last target (195.560) 📊
stop loss (194.280)❌

CHECK GBPJPY SIGNAL READ CAPTAIN( gbpjpy) buy zone
( trade satup )
entry point (194.950) to (194.900) 📊
first tp (195.100)📊
2nd target (195.350) 📊
last target (195.550) 📊
stop loss (194.700)❌

gbpjpy sell signal. Don't forget about stop-loss.
Write in the comments all your questions and instruments analysis of which you want to see.
Friends, push the like button, write a comment, and share with your mates - that would be the best THANK YOU.
P.S. I personally will open entry if the price will show it according to my strategy.
Always make your analysis before a trade

GJ-Thu-29/05/25 TDA-Possible buy above 4hR 196.283Analysis done directly on the chart
Follow for more, possible live trades update!
Asian session gave a good push, if you feel
missing out (FOMO). Don't worry, opportunities
will always be there.
Not financial advice, DYOR.
Market Flow Strategy
Mister Y

GBP/JPY 4H Chart Analysis – Bullish Channel Setup📈 Trend:
Price is moving in an ascending channel
🔵 Support line below
🔴 Resistance line above
---
Key Zones & Levels:
📍 Demand Zone (Buy Area):
Between 191.753 – 194.016
Price might bounce here before continuing up
🔵 Likely pullback expected here
🎯 Target Point:
202.500
🚀 If price respects the demand zone, this is the upside target
🟢 Entry Point:
Around 193.964 – 194.016
Optimal buying zone before the projected rise
❌ Stop Loss:
Below 191.700
🛑 Placed to minimize losses if price breaks down
---
Indicators:
📉 EMA (70):
Currently at 192.816
✅ Acting as dynamic support
---
Trade Plan Summary:
🔄 Wait for a retracement into the Demand Zone
🛒 Enter long near 193.964
⛔ Stop loss at 191.700
🎯 Target at 202.500

SELL GBPJPYThe price was creating the highs
After Sb, it did not visit the demand zone.
Now the price is showing the rejection to the up side zone hence creating strong supply
We now looking a drop up to the demand zone.
Let us observe it, if it will be a trade, however trade wisely

BUY GBPJPYAfter a long bearish retracement, JPY pairs seem ripe to continue up. This week started with a strong bullish move across all JPY pairs. A bullish flag has printed here. Buy from here

GBP/JPY – Bullish Flag Breakout Setup | wk-6We're observing a bullish flag pattern forming on the GBP/JPY 1-hour chart — a classic continuation pattern that often signals the resumption of the uptrend after a brief consolidation.
With price coiling tightly and momentum building, we are placing a Buy Stop trade setup just above the flag’s resistance to catch the breakout confirmation.
Trade Setup Details:
Pair: GBP/JPY
Timeframe: 1H
Pattern: Bullish Flag
Trend: Bullish
Entry (Buy Stop): 195.687
Stop Loss (SL): 194.324
Take Profit 1 (TP1): 197.050 (1:1)
Take Profit 2 (TP2): 198.413 (1:2)
Lot Size: 0.12
Risk/Reward Breakdown:
Trade 1: Risk $100 / Reward $100 (1:1)
Trade 2: Risk $100 / Reward $200 (1:2)
Total Risk: $200
Total Potential Reward: $300
✅ Trade Rationale:
✅ Bullish Flag: Classic continuation pattern in a strong uptrend
✅ Breakout Entry: Buy Stop placed above resistance for confirmation
✅ Strong Risk Management: Two trades with calculated R:R ratios
✅ Momentum Aligned: Market conditions favor further upside
🔗 Hashtags:
#GBPJPY #BullishFlag #ForexBreakout #TechnicalAnalysis #ForexTrading #BuyStop #ChartPatterns #BullishContinuation #SmartTrading #RiskReward #TradingSetup #PriceAction #TradingView

GBP/JPY) Bullish pullback analysis Read The ChaptianSMC trading point update
Tchnical analysis for GBP/JPY (British Pound / Japanese Yen) on the 4-hour timeframe. Here’s a breakdown of the trading idea and structure:
---
Key Technical Elements:
1. Support Zones:
Orderblock Zone (small yellow box near 192.15): Price is currently hovering around this area, which acts as a demand zone.
Main Support Level (larger yellow zone around 190.00): A deeper pullback may test this level if the orderblock fails.
2. EMA 200 (192.167):
Price is fluctuating around the 200 EMA, showing indecision.
A strong bounce above this moving average could indicate bullish momentum resuming.
3. RSI Indicator:
RSI is neutral (~47.80), leaving room for upside movement without being overbought.
4. Projected Price Path:
Two potential bullish scenarios:
A bounce from the orderblock leads straight to a rally.
A deeper dip into the support level forms a double bottom or liquidity grab, followed by a strong reversal.
5. Target Point:
The projection shows price rising to 196.368, which is a prior high and significant resistance.
---
Trade Idea Summary:
Bias: Bullish
Entry Zone:
Primary: Around 192.15 (orderblock)
Secondary (deeper entry): Around 190.00 (support level)
Confirmation: Bullish engulfing candle or strong wick rejection near entry + price reclaiming 200 EMA
Target: 196.368
Invalidation: Break and close below 189.80 (support zone violated)
Mr SMC Trading point
---
Risk Management & Notes:
Good R:R potential if entering near support with a stop below 189.80.
Watch for confirmation before entry — especially if price dips to the lower support.
Macroeconomic events (UK or Japan central bank decisions) could impact volatility.
Pales support boost 🚀 analysis follow)

GBPJPY is Holding above the SupportHello Traders
In This Chart GBPJPY HOURLY Forex Forecast By FOREX PLANET
today GBPJPY analysis 👆
🟢This Chart includes_ (GBPJPY market update)
🟢What is The Next Opportunity on GBPJPY Market
🟢how to Enter to the Valid Entry With Assurance Profit
This CHART is For Trader's that Want to Improve Their Technical Analysis Skills and Their Trading By Understanding How To Analyze The Market Using Multiple Timeframes and Understanding The Bigger Picture on the Charts

GBPJPY: Short Signal with Entry/SL/TP
GBPJPY
- Classic bearish formation
- Our team expects pullback
SUGGESTED TRADE:
Swing Trade
Short GBPJPY
Entry - 194.65
Sl - 195.26
Tp - 193.50
Our Risk - 1%
Start protection of your profits from lower levels
Disclosure: I am part of Trade Nation's Influencer program and receive a monthly fee for using their TradingView charts in my analysis.
❤️ Please, support our work with like & comment! ❤️

A quick buy
GBP/JPY Buy Setup – Targeting the Next Leg Up from Key Order Block
The GBP/JPY pair is currently presenting a promising long setup on the 1-hour chart. After a strong bullish rally that broke significant highs, the market has pulled back and is consolidating near a previously defined bullish order block in the 193.865–193.418 region.
This zone aligns with an earlier accumulation area that fueled the breakout above the previous weekly high (PWH), making it a high-probability area for bullish continuation. The structure remains bullish, with higher highs and higher lows intact. Below the order block lies a 4H liquidity-protected low around 192.878, further supporting the idea of a bullish defense at this level.
A buy from the order block area offers a favorable risk-reward opportunity. Potential upside targets include:
195.450 – minor resistance and potential TP1
196.736– secondary target (previous swing high)
198.022 – major target aligned with projected bullish continuation
As long as price respects the protected low and order block, buyers have control, and a move toward higher targets remains likely.
Note: Always manage your risk. A daily close below the order block or a break of the protected low could invalidate this setup.

gbpjpy sell signal. Don't forget about stop-loss.
Write in the comments all your questions and instruments analysis of which you want to see.
Friends, push the like button, write a comment, and share with your mates - that would be the best THANK YOU.
P.S. I personally will open entry if the price will show it according to my strategy.
Always make your analysis before a trade

GBPJPY Bullish Momentum Will ResumeThe bulls are still strong in this market. However if you are currently not holding any positions I would recommend waiting for that H1 bull flag breakout and retest.

GBPJPY for the bearsWas eyeing this pair and gladly went through.
Any other ideas on other instruments, let's share ideas, we all win.

possibility of uptrendIt is expected that the corrective trend will eventually end in the specified support area and we will see the beginning of the upward trend. If the support area is broken, the continuation of the downward trend is likely.

GJ-Wed-28/05/25 TDA-GJ pulling back ahead of FOMC minutes!Analysis done directly on the chart
Follow for more, possible live trades update!
Today's FOCUS: market positioning
You can have good trade idea, BUT
you still get stopped out with loss or
break even (BE). And one of the reasons
why is your market positioning.
To solve this problem one of the good
ways is to understand firstly the higher
timeframe structure.
Ask yourself:
Am I inside the range?
Is price is breaking out of range?
ETC...
Comment down below if this was useful!
Not financial advice, DYOR.
Market Flow Strategy
Mister Y

GBPJPY PREDICTIONGBPJPY trend prediction for Wed, May 28 15m TF
moving pro strong internal Bearish trend targeting weak structure.

GBPJPY Sell Setup- Go for sell only when entry setup given
- Refine entry with smaller SL for better RR, if you know how
- keep looking for sell even if price goes one more up
A Message To Traders:
I’ll be sharing high-quality trade setups for a period time. No bullshit, no fluff, no complicated nonsense — just real, actionable forecast the algorithm is executing. If you’re struggling with trading and desperate for better results, follow my posts closely.
Check out my previously posted setups and forecasts — you’ll be amazed by the high accuracy of the results.