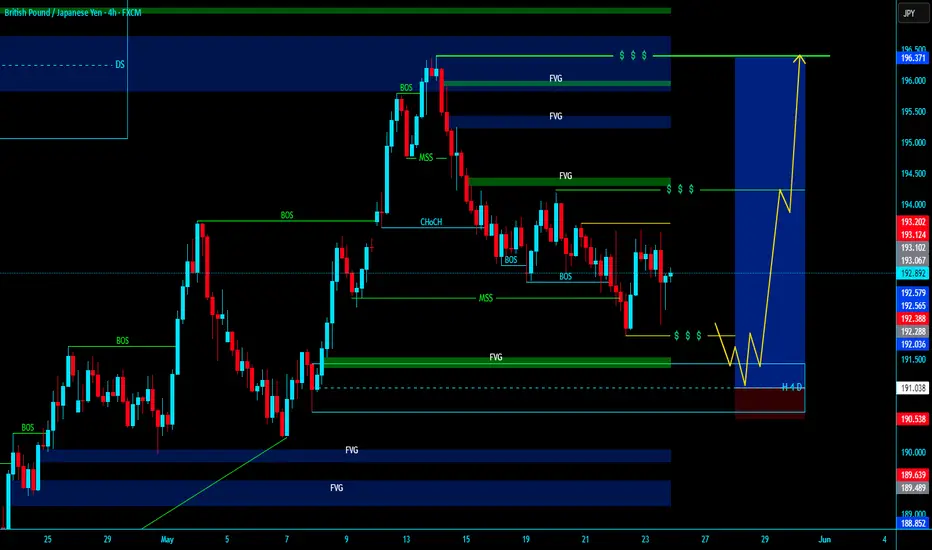
GJ-Mon-26/05/25 TDA-Big range, possible scalping buy! Analysis done directly on the chart
Follow for more, possible live trades update!
There are periods when price will push smoothly,
others when price give little pushes and not so
clean. Understanding and reacting to how good
the volume is and price readiness is important to
create a consistent edge in your system.
Not financial advice, DYOR.
Market Flow Strategy
Mister Y
GBPJPY trade ideas

BUY GJ idea Will the market continue to break down or break up and retest the zones plotted for this week


GBPJPY Breaks Higher: Bullish Momentum in PlayGBPJPY Breaks Higher: Bullish Momentum in Play
GBPJPY has broken out of a bullish triangle, signaling potential for further gains.
Yesterday, GBPJPY surged 170 pips in 10 hours, showing strong momentum.
The pair could continue rising towards 193.50 and 194.00 as accumulation seems to have ended.
The breakout is reinforced by strong UK retail sales, which came in at +1.2% vs. +0.2% expected, boosting GBP strength.
You may find more details in the chart!
Thank you and Good Luck!
❤️PS: Please support with a like or comment if you find this analysis useful for your trading day❤️

GBPJPY - Bullish Breakout Likely
The GBP/JPY 4-hour chart shows a strong bullish trend that propelled the pair from 190.50 support in early May to peaks near 196.50, followed by a healthy consolidation phase around the 192.00-194.00 range. This sideways price action has allowed momentum to reset while maintaining the underlying upward structure, with the pair successfully holding above key support at 192.00. The current positioning near the upper boundary of the consolidation range, combined with signs of renewed buying interest, suggests the correction is nearing completion. The technical setup favors a bullish breakout, with the higher probability scenario pointing toward a resumption of the uptrend targeting the previous high around 196.50 and potentially extending toward the 197.00 resistance zone.
Disclosure: I am part of Trade Nation's Influencer program and receive a monthly fee for using their TradingView charts in my analysis.

GBPJPY daily and 4hr Analaysis GBP/JPY is expected to turn bearish from the 196.096 - 197.372 - 200.781 zone, with a projected drop towards the 186.572 - 179.071 area, where it may find support and potentially reverse into a bullish move. However, there's also a possibility of a continued bearish breakout that could extend the decline further towards the 174.45 level.

GBPJPY CONTINUE TO BULLISH Technically:
GBPJPY broke descending wage.
GBPJPY retest trendline as support
GBPJPY after printing higher high retest 0.70 fib
GBPJPY supporting a bullish trendline

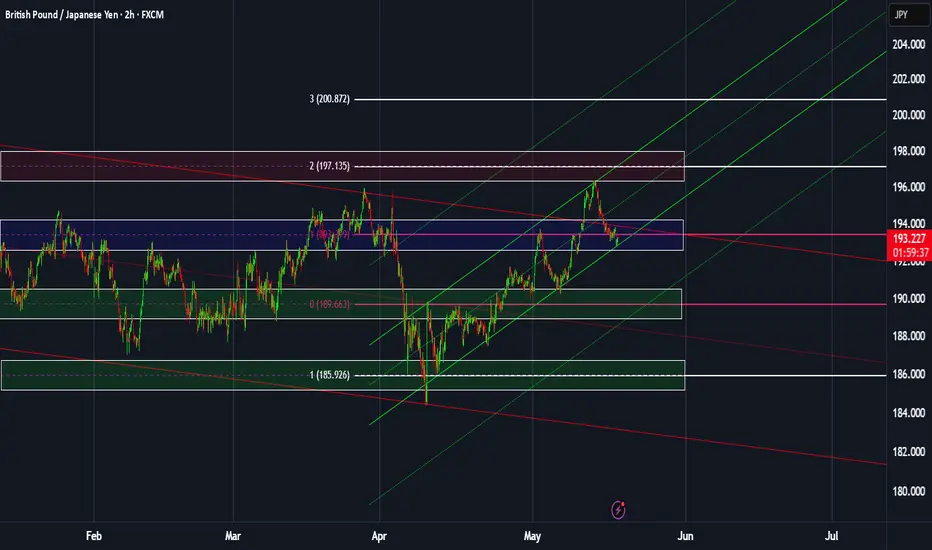
GBPJPY: Weekly overviewThe fake breakout of 12th of May is a sign of more bearish days. However, as traders we should be ready to adapt with new conditions.
We are ready to long from the zone around 189.720.
The indicated levels are determined based on the most reaction points and the assumption of approximately equal distance between the zones.
Some of these points can also be confirmed by the mathematical intervals of Murray.
You can enter with/without confirmation. IF you want to take confirmation you can use LTF analysis, Spike move confirmation, Trend Strength confrimation and ETC.
SL could be placed below the zone or regarding the LTF swings.
TP is the next zone or the nearest moving S&R, which are median and borders of the drawn channels.
*******************************************************************
Role of different zones:
GREEN: Just long trades allowed on them.
RED: Just Short trades allowed on them.
BLUE: both long and short trades allowed on them.
WHITE: No trades allowed on them! just use them as TP points

GBPJPY: Weekly overview + Significant zonesHello dear traders,
The indicated levels are determined based on the most reaction points and the assumption of approximately equal distance between the zones.
These points can also be confirmed by the mathematical intervals of Murray.
After reacting to the following zones, you can enter the trade. Place the stop loss slightly above/below the zone to which the reaction was shown. The profit point is the next zone.
The drawn channels and their medians can also be considered as moving support and resistance. I usually use them as target points. I've doubled the short-term channel because it was so thin ;-).
* I don't use 189.663 zone to take short! There are too many moving S&R around it.
This analysis is valid until the end of the week.
**************************************
Important news that could change the direction of the trade:
Wed: Great Britain CPI of April.
GBPJPY Channel Down making a Lower High rejectionThe GBPJPY pair rose aggressively since the last time we gave our buy signal (April 11, see chart below), quickly hitting our conservative 109.250 Target:
The price has since made a Lower High rejection at the top of the Channel Down but remains supported by the 1D MA50 (blue trend-line). Once broken and it closes a 1D candle below it, we will have bearish break-out signal. Our Targe will be 185.250, which will be the standard -5.85% decline that all 3 previous Bearish Legs had within the Channel Down.
-------------------------------------------------------------------------------
** Please LIKE 👍, FOLLOW ✅, SHARE 🙌 and COMMENT ✍ if you enjoy this idea! Also share your ideas and charts in the comments section below! This is best way to keep it relevant, support us, keep the content here free and allow the idea to reach as many people as possible. **
-------------------------------------------------------------------------------
💸💸💸💸💸💸
👇 👇 👇 👇 👇 👇

GBP/JPY SET UPGBP/JPY 1H - Above is a set up I will be looking to take part in as soon as we are delivered with the entry confirmation we need to get involved in this market. We have had two lots of break of structures to confirm longer term bullishness.
It is now a case of price trade into the third and finally area of Demand, to give us a nice refined entry for the position. Once we see price trade in and reject well we will look to take part in the market.
I have gone ahead and set my SL just below the zone we are getting involved from as this zone should act as protection and there should be enough Demand there to reverse price.
I have gone ahead and set my TP just below the last higher timeframe high, this is a great place to put it as this high should break to create a new higher timeframe high following the laws of bullishness. As a result giving us a great RR trade.

GBPJPY Bulls wake Up! Clean swing buy opportunity ahead! Price after the recent swing high as indicated on the chart (yellow circles)
It has since retraced to to 61.8 retracement level and has rejected with one bullish candle and currently rejecting again. There is a high probability to see some buy pressure ahead of next weeks trading sessions to the up side to target of 195.78 and beyond.

GBPJPY Bull Flag Pending a BreakoutI am still bullish on GBPJPY. Trading is mainly about patience. Until we get a clear breakout and retest of that flag, we continue to sit on our hands patiently :)

"TIME AND PRICE" LQ SETUP.TIME & PRICE is a narrative I define or state as the period between the movement of price induced by the trigger of liquidity-seeking orders to fill, and a more balanced and stable distribution of price.
So during this time of activity, we look for trade setups and opportunities to execute as price continues in its overall direction after LQ sweep between Swing Highs, Lows, and Breaks of market structure points.

GBPJPY SELL Analysis Idea!!!!⸻
Pair: GBPJPY
Timeframe: 1 Hour (1H)
Bias: Bearish (Sell Setup)
⸻
Technical Analysis:
1. Price Structure & Market Context:
• The chart shows a clear downtrend from the previous swing high near 196.000.
• Price has since formed a lower high within the red supply zone, reinforcing bearish pressure.
• Several liquidity grabs and rejections are visible near the red supply zone, indicating sellers are defending this level aggressively.
2. Key Zones & Levels:
• Supply Zone (Red Area): 193.243–193.594 — significant selling pressure observed.
• Buyers Above Zone: Price has failed to sustain above 193.243 despite attempts, confirming bearish strength.
• Break of Structure (BOS): At 192.824, confirming bearish momentum.
• Support Zones (Green Areas):
• First target area: 192.307
• Second target area: 191.272 — potential extended target if momentum continues downward.
3. Entry & Confirmation:
• Current Price: 193.168
• Price is rejecting the supply zone and failing to break above the 193.243 resistance line.
• Confirmation of sell setup co mes from:
• Bearish rejections at supply
• Price forming a lower high (193.100 HL level)
• BOS and retest pattern playing out
4. Trade Plan (Sell Idea):
• Sell Entry: Between 193.150–193.243 (rejection zone)
• Stop Loss: Above 193.594 (invalidate the supply zone rejection)
• Take Profit 1 (TP1): 192.307
• Take Profit 2 (TP2): 191.272 (extended target)
⸻
Confluence Factors:
• Price is respecting supply zone.
• Repeated bearish rejections and liquidity sweeps above key levels.
• BOS supports shift in structure to bearish.
⸻
Conclusion:
GBPJPY is showing strong signs of bearish control, with multiple rejections from the supply zone and a BOS indicating momentum shift. A sell from the current levels offers a good risk-to-reward setup, targeting the support zones below.


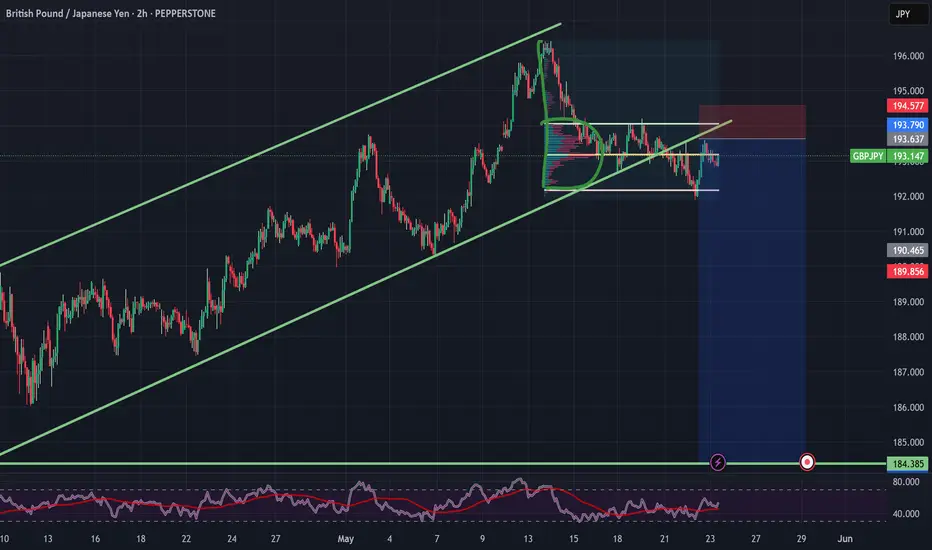
GBPJPY SELL NOW!!!!!!!GBPJPY took out the sell-side liquidity on a rising wedge pattern we have a retest and now again we have price making a sharp rejection off the POC level in the B shape formation am in on sell from this zone holding till new lows is created 184.385 is my measure target
JOIN AND ENJOY....

GBP/JPYJust my view of the markets. I give my reason why I took a buy and explained how I feel the market trend changes from bullish to bearish

Bearish drop off pullback resistance?GBP/JPY is rising towards the pivot and could drop to the 1st support, which is a pullback support.
Pivot: 193.76
1st Support: 191.56
1st Resistance: 194.80
Risk Warning:
Trading Forex and CFDs carries a high level of risk to your capital and you should only trade with money you can afford to lose. Trading Forex and CFDs may not be suitable for all investors, so please ensure that you fully understand the risks involved and seek independent advice if necessary.
Disclaimer:
The above opinions given constitute general market commentary, and do not constitute the opinion or advice of IC Markets or any form of personal or investment advice.
Any opinions, news, research, analyses, prices, other information, or links to third-party sites contained on this website are provided on an "as-is" basis, are intended only to be informative, is not an advice nor a recommendation, nor research, or a record of our trading prices, or an offer of, or solicitation for a transaction in any financial instrument and thus should not be treated as such. The information provided does not involve any specific investment objectives, financial situation and needs of any specific person who may receive it. Please be aware, that past performance is not a reliable indicator of future performance and/or results. Past Performance or Forward-looking scenarios based upon the reasonable beliefs of the third-party provider are not a guarantee of future performance. Actual results may differ materially from those anticipated in forward-looking or past performance statements. IC Markets makes no representation or warranty and assumes no liability as to the accuracy or completeness of the information provided, nor any loss arising from any investment based on a recommendation, forecast or any information supplied by any third-party.

GJ-Fri-23/05/25 TDA-Wide consolidation incoming?Analysis done directly on the chart
Follow for more, possible live updates!
Not everyday is a good trading day,
you are not forced to take trades every
single day. More trades is not equal
to better results.
Not financial advice, DYOR.
Market Flow Strategy
Mister Y
