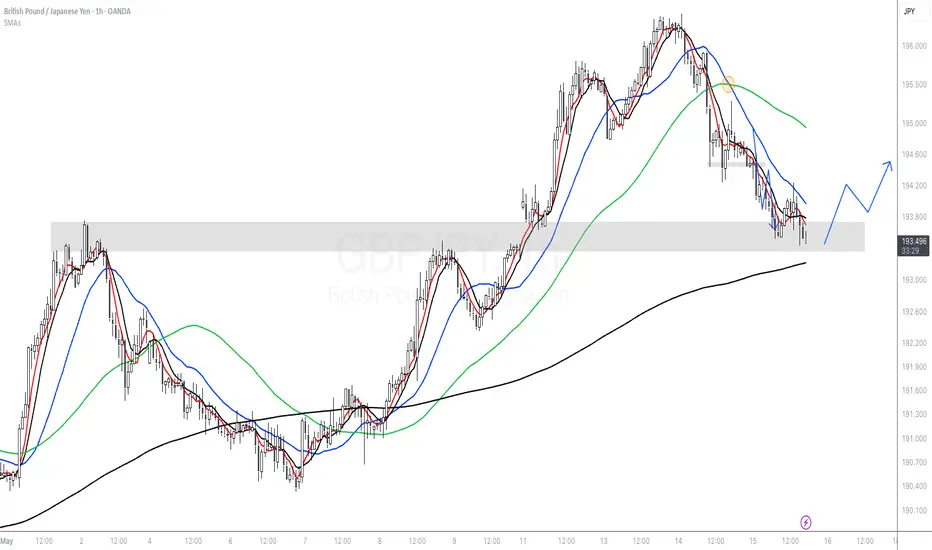
Resistance turning support on GJ. 193.60With that being said the Area of Value is perfect as well. With the 50 ema being above the 200ema and price pulling back to the 200 ema with the recent break through resistance at 193.60 which now may be support. Look to targer recent highs at 195-196.50.
GBPJPY trade ideas

GBPJPY Role Reversal Setup (GBPJPY 1HR)Price has now closed the gap previously set, and is now on a strong level of support on the 1hr chart. I will be watching this level closely for possible reversal signs and a push higher as this may be a longer term plan.
- 1d trend change confirmed
- Support level being tested
- Watch the 15min chart for price action to confirm
- Scalp the entry
Thats the plan.
We may push lower, which would involve breaking current support and retesting for next leg lower.
GBPJPY | 12.05.2025SELL 194.800 | STOP 197.000 | TAKE 192.000 | Trump has announced a deal with the UK. The deal will lift some of the tariffs he imposed on British goods such as cars, steel and aluminium. In return, the US has secured concessions that will provide greater access to US industries such as agriculture and a reduction in digital tax.
The Pound will also react to upcoming UK labour market data on Tuesday and GDP data on Thursday. Economists expect these data to show that the economy grew by 0.1 per cent in March after growing by 0.5 per cent in the previous month.

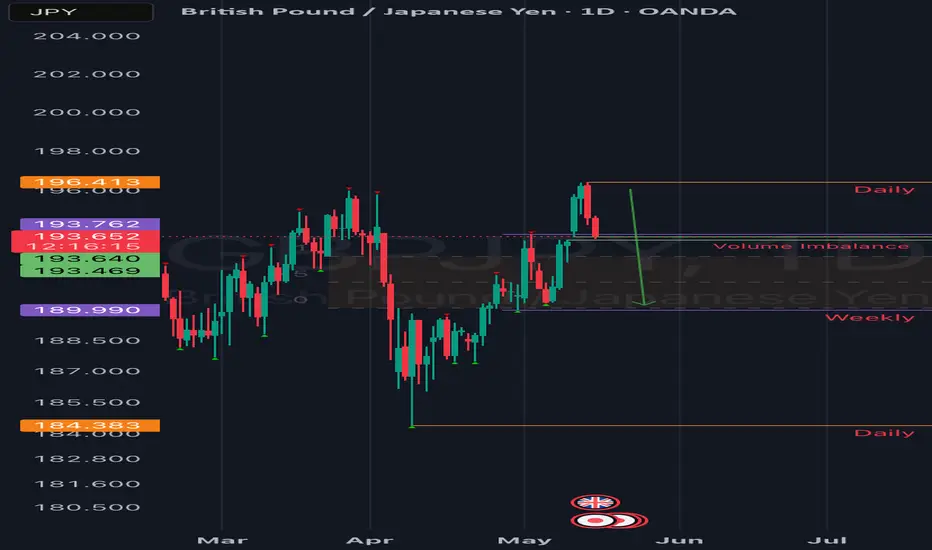
Potential bearishPotential change of trend? Yen basket to watch Entry 195.700
First tp at low 193.700
Second tp 192.500 if all good
Sl as always above last high

GBPJPY MAINTAINS BEARISH LOOK! Price maintains a bearish look after we saw a recent rebound around a trendline that we use to guide our trading decisions for the month. We anticipate a sell to occur from the current market price.

ICT STRATEGY First thing we need to have fair value gap that have to be inverted, after being inverted, the market breaks the structure and then come back to our point of interest which is our order block
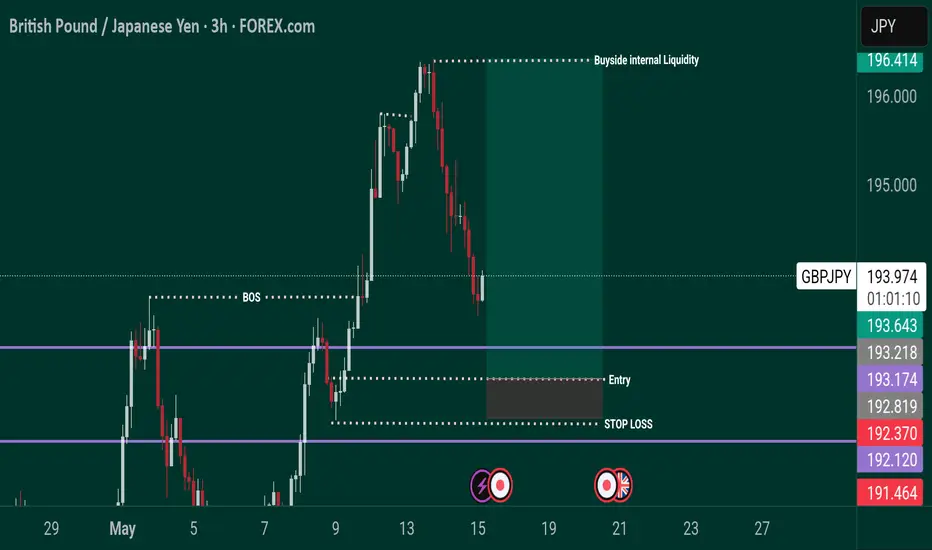
Ict trading ideaFirst thing first , we need to have a buyside Liquidity that have to be swept and also we need to have break of structure ( uptrend) , the retest of that buyside Liquidity should tap into our OB (Order block ) and that's our entry

DeGRAM | GBPJPY broke through and fixed above the channel📊 Technical Analysis
● Price has broken the 8‑month descending channel’s roof and reclaimed the last swing‑high at 194, turning it into support and signalling a trend reversal.
● The move launches from a bullish pennant; its measured target and the channel’s midline converge in the 196 – 197.8 resistance zone.
💡 Fundamental Analysis
● UK average earnings held above 6 % y/y in April, curbing BoE‑cut speculation and keeping gilt yields elevated.
● Japan’s Q1 GDP shrank and the BoJ left policy ultra‑loose, widening the UK–JP rate gap and pressuring the yen.
✨ Summary
Channel breakout plus strong UK data and soft JPY bias favour a long GBP/JPY: aim for 196 → 197.8, risk managed on a daily close back below 194.
-------------------
Share your opinion in the comments and support the idea with like. Thanks for your support!

GBPJPY( British pound my banker!)Good day traders, I’m back with another idea on GbPJPY but this one is based on the strength and weakness of the pound itself. Before you ask what I mean…on this respective TF we had a break of structure higher(strength) but we saw price immediately move lower showing some weakness in price.
For the rest of the London session we can expect price to move higher on that volume imbalance to start the New York session. The rectangle is a balanced price range.
GJ-Thu-15/05/25 TDA-Gap is starting to get filled! Interesting!Analysis done directly on the chart
Follow for more, possibly live trade updates!
Keep grinding, only when you are carrying your
own buckets of water, you'll feel every drop significantly!
Not financial advice, DYOR.
Market Flow Strategy
Mister Y

GBPJPY SELL NOW!!!!!GBPJPY formed a rising wedge or a bearish flag pattern on the 6h time frame price have already started looking forward to run liquidity on the small time frame in 30min am in on a sell here holding till new lows is created after liquidity run 184.385 IS MY GOAL support area....

GJ-Wed-14/05/25 TDA-Higher high, higher low to next DR 197.240?Analysis done directly on the chart
Follow for more, possible live trade updates!
Does anybody know if gaps will always be filled or not?
Based on what criteria if it will be filled or not?
Appreciate the responses!
Comment down below!
Not financial advice, DYOR.
Market Flow Strategy
Mister Y

GBPJPY SHORT FORECAST Q2 W20 D15 Y25GBPJPY SHORT FORECAST Q2 W20 D15 Y25
Professional Risk Managers👋
Welcome back to another FRGNT chart update📈
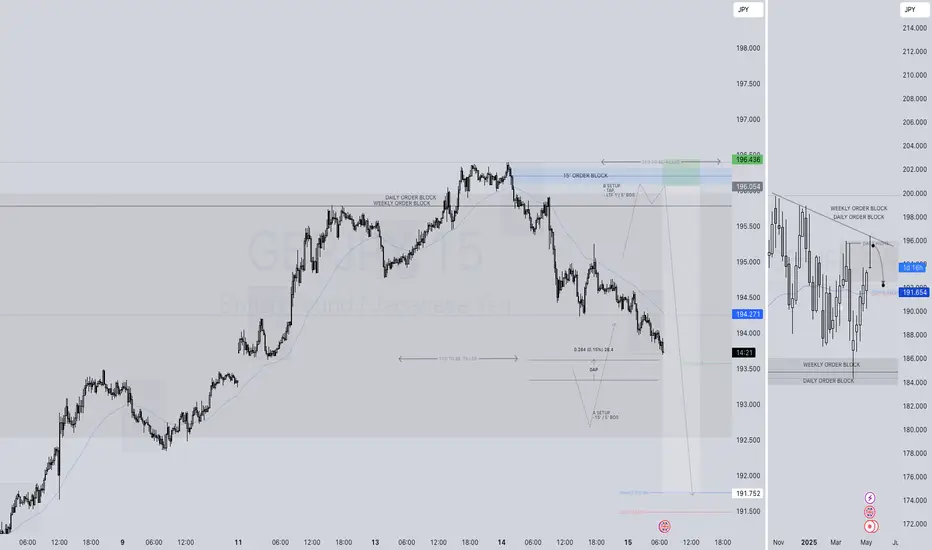
Diving into some Forex setups using predominantly higher time frame order blocks alongside confirmation breaks of structure.
Let’s see what price action is telling us today!
💡Here are some trade confluences📝
✅Weekly order block rejection
✅Daily order block rejection
✅Intraday 15' order blocks
✅Gap fill
🔑 Remember, to participate in trading comes always with a degree of risk, therefore as professional risk managers it remains vital that we stick to our risk management plan as well as our trading strategies.
📈The rest, we leave to the balance of probabilities.
💡Fail to plan. Plan to fail.
🏆It has always been that simple.
❤️Good luck with your trading journey, I shall see you at the very top.
🎯Trade consistent, FRGNT X
GB{JPY H4 | Bearish ContinuationBased on the H4 chart, the price could potentially rise toward our sell entry level at 194.75, a pullback resistance
Our take profit is set at 192.49, a pullback support that aligns close to the 61.8% Fibo retracement.
The stop loss is set at 196.99, a swing high resistance.
High Risk Investment Warning
Trading Forex/CFDs on margin carries a high level of risk and may not be suitable for all investors. Leverage can work against you.
Stratos Markets Limited (tradu.com):
CFDs are complex instruments and come with a high risk of losing money rapidly due to leverage. 63% of retail investor accounts lose money when trading CFDs with this provider. You should consider whether you understand how CFDs work and whether you can afford to take the high risk of losing your money.
Stratos Europe Ltd (tradu.com):
CFDs are complex instruments and come with a high risk of losing money rapidly due to leverage. 63% of retail investor accounts lose money when trading CFDs with this provider. You should consider whether you understand how CFDs work and whether you can afford to take the high risk of losing your money.
Stratos Global LLC (tradu.com):
Losses can exceed deposits.
Please be advised that the information presented on TradingView is provided to Tradu (‘Company’, ‘we’) by a third-party provider (‘TFA Global Pte Ltd’). Please be reminded that you are solely responsible for the trading decisions on your account. There is a very high degree of risk involved in trading. Any information and/or content is intended entirely for research, educational and informational purposes only and does not constitute investment or consultation advice or investment strategy. The information is not tailored to the investment needs of any specific person and therefore does not involve a consideration of any of the investment objectives, financial situation or needs of any viewer that may receive it. Kindly also note that past performance is not a reliable indicator of future results. Actual results may differ materially from those anticipated in forward-looking or past performance statements. We assume no liability as to the accuracy or completeness of any of the information and/or content provided herein and the Company cannot be held responsible for any omission, mistake nor for any loss or damage including without limitation to any loss of profit which may arise from reliance on any information supplied by TFA Global Pte Ltd.
The speaker(s) is neither an employee, agent nor representative of Tradu and is therefore acting independently. The opinions given are their own, constitute general market commentary, and do not constitute the opinion or advice of Tradu or any form of personal or investment advice. Tradu neither endorses nor guarantees offerings of third-party speakers, nor is Tradu responsible for the content, veracity or opinions of third-party speakers, presenters or participants.

GBPJPY Long at supportBuy after successfully breakout this resistant line or buy now with a short -term target of at least 10%+ from here.

THOUGHTS ON GBP/JPY GBP/JPY 4H - Here is a prime set up for this pair, as you can see we have recently had a higher timeframe break in structure to the upside, suggesting longer term bullishness.
I now want to see price pullback into a valid area of interest allowing us to get involved in this market with a more refined entry. Once we see price pullback down into our area of interest this is when we can prepare to go long.
We want to see price trade down, clear the area of Demand and then break structure to the upside fractally, this will confirm that enough Demand has been introduced to flip the balance.
By breaking the last protected high, it confirms that there is more Demand in the market than there is Supply, as we will begin following the laws of Bullish structure. Breaking highs and protecting lows.
------
You can see to the left the potential trade that could have been taken from last weeks Sunday Sessions video. 14RR
