GBPJPY – Correction Pressure Is Building UpGBPJPY is still trading within a well-defined ascending channel on the H4 chart. However, recent signals suggest a potential short-term correction. The price has repeatedly rejected the upper boundary of the channel and is now forming a distribution pattern with lower highs. The FVG zone near 200.400 may act as a short-term take-profit area before price pulls back toward the support zone around 198.400, which also aligns with the lower trendline.
Additionally, the upcoming UK GDP data this week could strongly impact GBP. If the data comes in weaker than expected, downside pressure may intensify and reinforce the developing correction scenario. Traders should monitor price action around 198.400 for confirmation of the pullback.
GBPJPY trade ideas

GBPJPY is still in pullbackGJ possibilities has been drawn on chart. GJ is in pullback still. It had developed liquidity around S&R Level and has taken. GJ may touch PD high today because it has already taken PD low. It may go towards the demand zone residing below PD low.

GBPJPY is Holding above the SupportHello Traders
In This Chart GBPJPY HOURLY Forex Forecast By FOREX PLANET
today GBPJPY analysis 👆
🟢This Chart includes_ (GBPJPY market update)
🟢What is The Next Opportunity on GBPJPY Market
🟢how to Enter to the Valid Entry With Assurance Profit
This CHART is For Trader's that Want to Improve Their Technical Analysis Skills and Their Trading By Understanding How To Analyze The Market Using Multiple Timeframes and Understanding The Bigger Picture on the Charts

GBPJPY SHORT (swing)This is a trade setup based on a **Bearish Butterfly Harmonic Pattern**. The pattern meets all the key Fibonacci criteria for validity. Specifically, the AB leg retraces 80.8% of XA, which is close to the ideal 78.6% level and is considered acceptable, especially since it closed with a wick. The BC leg retraces 37.5% of AB, which is within the standard range of 38.2% to 88.6%. The CD leg extends 127% of XA, which is the minimum required for a valid Butterfly pattern, and also extends 252% of BC, which falls within the acceptable range of 161.8% to 261.8%.
What makes this setup stronger is that the Potential Reversal Zone (PRZ) at point D coincides with a **major resistance level**, adding significant technical confluence to the area. This increases the probability of a market reaction or reversal from that zone.
However, no entry will be taken immediately upon price reaching the PRZ. A trade will only be initiated **after the appearance of a confirmed reversal candlestick pattern** at or near the D point, such as a bearish engulfing.
This ensures that we enter with confirmation and not just based on pattern completion.

SellPrevious Day Low
Trend Line Break
Divergence Volume
London Session
Previous Week High Breach
Market Structure Shift Bearish

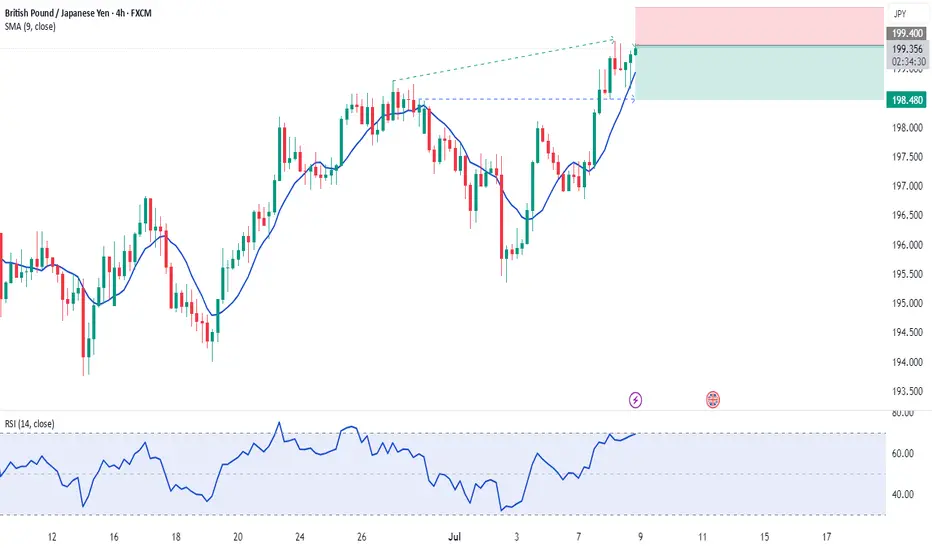
GBPJPY uptrend support at 196.75Key Support: 196.75
This level marks the prior consolidation zone and serves as a critical pivot. A corrective pullback toward 196.75 followed by a bullish reversal would validate the uptrend, with upside targets at:
199.20 – Initial resistance and short-term target
199.70 – Minor resistance zone
200.40 – Longer-term breakout objective
However, a daily close below 196.75 would invalidate the bullish scenario, potentially triggering a deeper retracement toward:
195.80 – Near-term support
194.80 – Key downside level in a bearish reversal
Conclusion:
As long as 196.75 holds, the bias remains bullish, favoring continuation toward the 199–200 zone. A confirmed break below this support would shift momentum, opening the door for a broader corrective decline.
This communication is for informational purposes only and should not be viewed as any form of recommendation as to a particular course of action or as investment advice. It is not intended as an offer or solicitation for the purchase or sale of any financial instrument or as an official confirmation of any transaction. Opinions, estimates and assumptions expressed herein are made as of the date of this communication and are subject to change without notice. This communication has been prepared based upon information, including market prices, data and other information, believed to be reliable; however, Trade Nation does not warrant its completeness or accuracy. All market prices and market data contained in or attached to this communication are indicative and subject to change without notice.

GBP/JPY BULLISH BIAS RIGHT NOW| LONG
Hello, Friends!
It makes sense for us to go long on GBP/JPY right now from the support line below with the target of 198.556 because of the confluence of the two strong factors which are the general uptrend on the previous 1W candle and the oversold situation on the lower TF determined by it’s proximity to the lower BB band.
Disclosure: I am part of Trade Nation's Influencer program and receive a monthly fee for using their TradingView charts in my analysis.
✅LIKE AND COMMENT MY IDEAS✅

BUYPrevious Day Low
Trend Line Rejection
Divergence Volume
London Session
Previous Week High Breach
Market Structure Shift Bullish

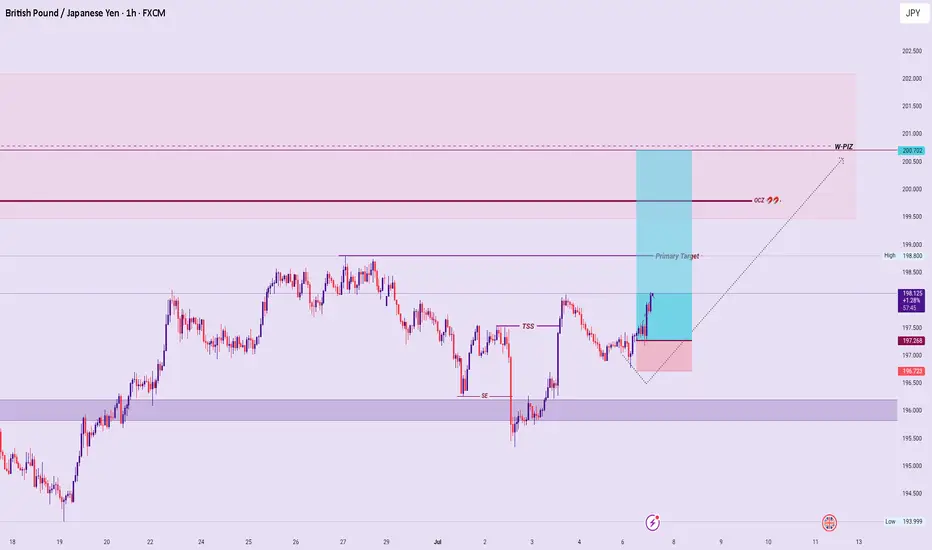
4H CHoCH Formed – Short from Supply with CautionHello Traders,
Today we’ve seen a Change of Character (CHoCH) form on the 4-hour chart after price broke above the higher time frame’s weak high (HH) from yesterday. This suggests we’re now in a bearish counter-trend pullback phase. Trading short from the 4H supply zone with lower time frame (LTF) confirmation presents a high-probability setup.
However, keep in mind that on the daily chart, price is reacting from a Fair Value Gap (FVG) or imbalance zone, meaning there’s still a chance price could push higher. So using LTF confirmation before entering shorts is essential.

BUYPrevious Day Low
Trend Line Rejection
Divergence Volume
London Session
Previous Week High Breach
Market Structure Shift Bullish
Watch
Trade
Manage
Smile

Will GBPJPY uptrend continue??Price is at a crucial point where traders are beginning to watch what’s likely to happen next in the market. Is market likely to continue to trade higher? From the technical standpoint, if price continues to rise and break the 200.000 level we will look for a buy opportunity in this market.
British Pound / Japanese Yen - 4H Chart (OANDA)4-hour chart from OANDA displays the GBP/JPY currency pair's price movement, with the current price at 199.248 (+0.024 or +0.01%). The chart highlights a recent upward trend, breaking through a resistance level around 199.274, with buy and sell indicators at 199.274 and 199.220 respectively. Key price levels include a high of 199.923 and a low of 198.188, with the chart spanning from June to early August 2025.

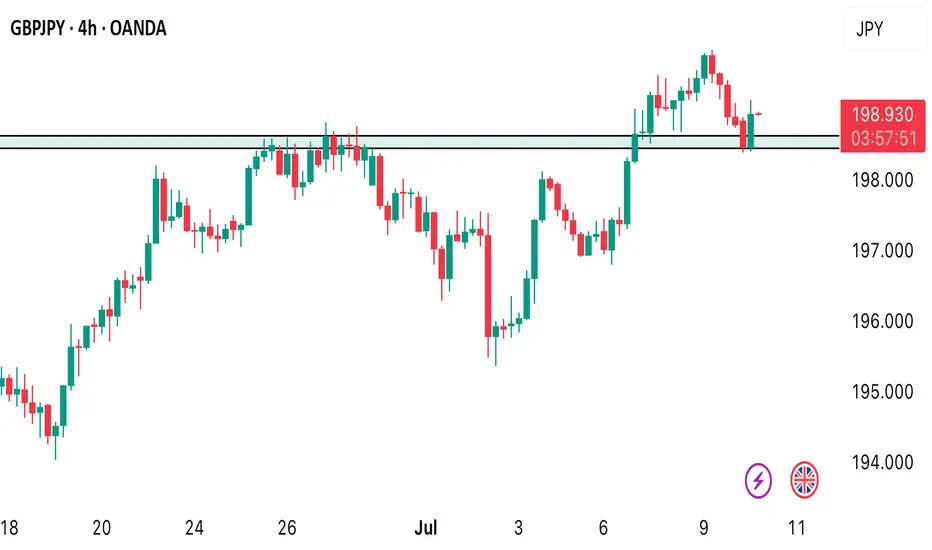
GBPJPY sitting at resistance – Is a drop to 193.360 likely?GBPJPY is sitting right at a key daily resistance zone. This is a level where it has struggled to break through and reversed strongly to the downside. So this makes it definitely one to monitor, especially if you’re eyeing potential short setups.
If we start seeing signs that the price is getting rejected here: like long wicks, strong bearish candles, it could be the early indication of another move lower. My focus is on a moderate drop toward the 193.360 area, similar to what we’ve seen in past pullbacks. Nothing too dramatic, just a simple downside play if sellers step in again.
But if we get a strong breakout? That changes everything: it would hint that bulls are taking full control. This area is pretty important and could give us a better idea of where price is headed next.
Just sharing my thoughts on support and resistance, this isn’t financial advice. Always confirm your setups and manage your risk properly.
Disclosure: I am part of Trade Nation's Influencer program and receive a monthly fee for using their TradingView charts in my analysis.

IDEA TRADE GBPJPY LONG POSITION Hi Traders
Pair: GBPJPY
📈 Position: LONG (BUY)
✅ Entry: 198.600
🔺 SL: 198.250 (-35 pips )
🎯 Take Profits:
• TP 1: 198.950
• TP 2: 199.300
• TP 3: 199.650 Trailing SL)

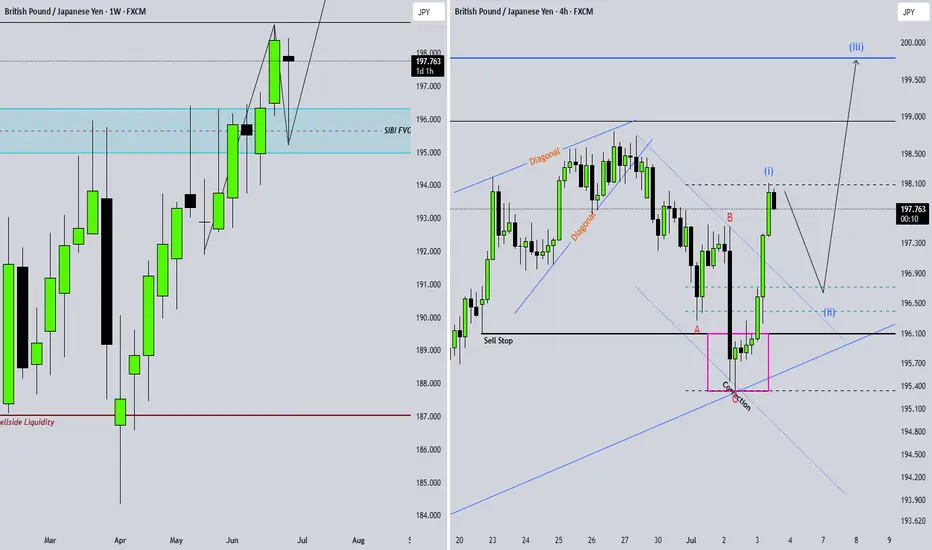
GBPJPY Elliott Wave AnalysisHello friends
We are witnessing the formation of a complete Elliott wave pattern on the GBPJPY chart. These waves from 1 to 5 are quite clear and you can even count their subwaves (especially the microwaves of the main wave 3). Now wave 5 is completing and moving inside an ascending channel.
At the moment, the microwaves of the 5th wave have not been completed, so we expect the price to grow within this channel. The minimum growth is up to 200.00, of course, it can grow even more.
But after the completion of the 5th wave, with the breakdown of the trend line drawn below and a return to it, we can expect the price to fall to the specified support. The first support is 196.00. Of course, the price decrease in the 5th wave is always accompanied by divergence and a decrease in the slope of the chart, as you can see that the slope of wave 5 is much lower than wave 3.
Good luck and be profitable.

GBPJPY Shown Good Pullback after hitting Swing HighAs share earlier GJ show good bullish move and hit swing high. After hitting swing has given a good pull back and entered into the trade. The engulfing hourly candle showing strong pullback which will possibly go further down to retest a demand zone and an area.

Follow up on GBPJPY outlookA quick entry at LND open. Monitoring for any invalidation that might present
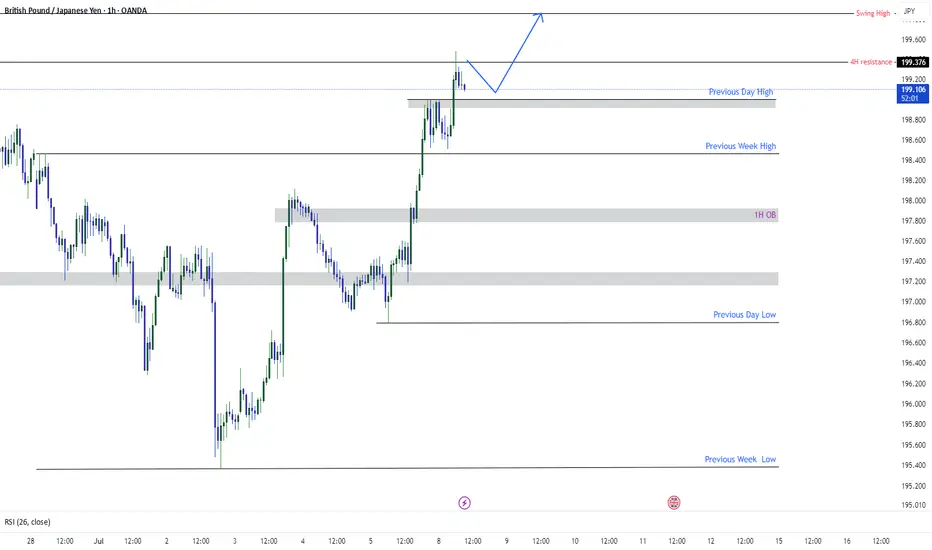
GBPJPY Targeting SwingGBPJPY has currently broken previous day high and wants to target the swing high which is 199.857 after retracing form previous 4H resistance GJ wants to travel to swing high. Chart is showing everything clearly. do not make things complex. Simplify as much as you can.
GBPJPY BullishAfter exiting a correction, the first impulse (Wave 1) appears. I expect a retracement of at least 50% of the Fibonacci.
possibility of uptrendAs long as the price is above the green support range, the continuation of the upward trend is likely. Upon reaching the 100% level, a correction trend will probably form.

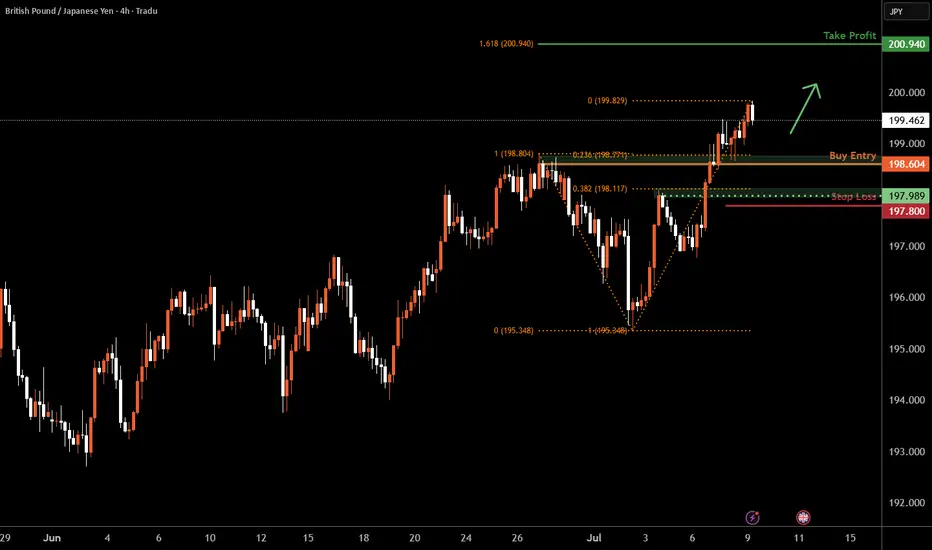
GBP/JPY H4 | Falling toward a pullback supportGBP/JPY is falling towards a pullback support and could potentially bounce off this level to climb higher.
Buy entry is at 198.60 which is a pullback support that aligns with the 23.6% Fibonacci retracement.
Stop loss is at 197.80 which is a level that lies underneath a pullback support and the 38.2% Fibonacci retracement.
Take profit is at 200.94 which is a resistance that aligns with the 161.8% Fibonacci extension.
High Risk Investment Warning
Trading Forex/CFDs on margin carries a high level of risk and may not be suitable for all investors. Leverage can work against you.
Stratos Markets Limited (tradu.com ):
CFDs are complex instruments and come with a high risk of losing money rapidly due to leverage. 63% of retail investor accounts lose money when trading CFDs with this provider. You should consider whether you understand how CFDs work and whether you can afford to take the high risk of losing your money.
Stratos Europe Ltd (tradu.com ):
CFDs are complex instruments and come with a high risk of losing money rapidly due to leverage. 63% of retail investor accounts lose money when trading CFDs with this provider. You should consider whether you understand how CFDs work and whether you can afford to take the high risk of losing your money.
Stratos Global LLC (tradu.com ):
Losses can exceed deposits.
Please be advised that the information presented on TradingView is provided to Tradu (‘Company’, ‘we’) by a third-party provider (‘TFA Global Pte Ltd’). Please be reminded that you are solely responsible for the trading decisions on your account. There is a very high degree of risk involved in trading. Any information and/or content is intended entirely for research, educational and informational purposes only and does not constitute investment or consultation advice or investment strategy. The information is not tailored to the investment needs of any specific person and therefore does not involve a consideration of any of the investment objectives, financial situation or needs of any viewer that may receive it. Kindly also note that past performance is not a reliable indicator of future results. Actual results may differ materially from those anticipated in forward-looking or past performance statements. We assume no liability as to the accuracy or completeness of any of the information and/or content provided herein and the Company cannot be held responsible for any omission, mistake nor for any loss or damage including without limitation to any loss of profit which may arise from reliance on any information supplied by TFA Global Pte Ltd.
The speaker(s) is neither an employee, agent nor representative of Tradu and is therefore acting independently. The opinions given are their own, constitute general market commentary, and do not constitute the opinion or advice of Tradu or any form of personal or investment advice. Tradu neither endorses nor guarantees offerings of third-party speakers, nor is Tradu responsible for the content, veracity or opinions of third-party speakers, presenters or participants.