GBPJPY
🧠 Technical Breakdown:
✅ Clear Break of Structure (BoS) around 198.75
🔁 Price retested the Area of Interest (AOI) at previous support now turned resistance
🔻 Strong rejection wick confirms bearish pressure
📉 Expecting continuation toward 195.01 as next major liquidity zone
GBPJPY trade ideas


GBPJPY bearish expectations
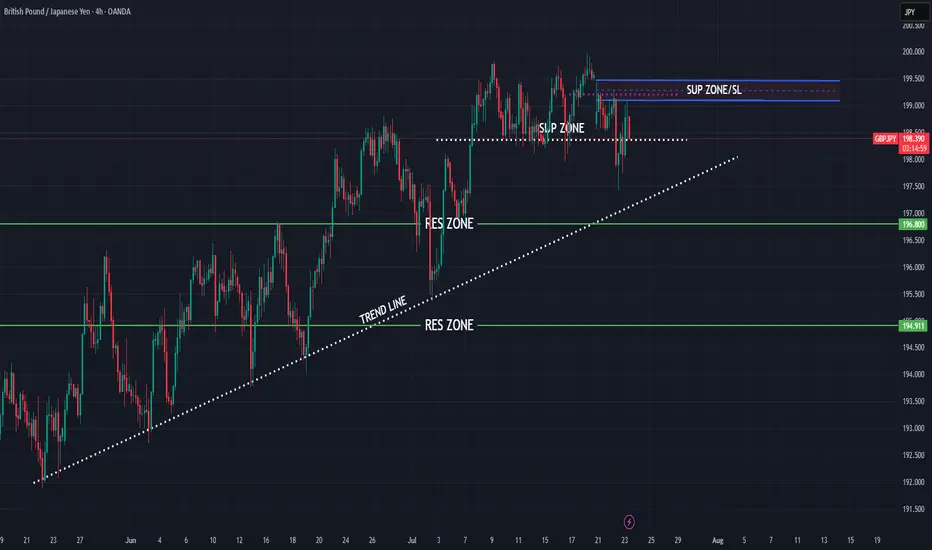
OANDA:GBPJPY long time bullish trend we are have, currently price in zone, changes on this point expecting
SUP zone: 199.100
RES zone: 196.800, 194.900
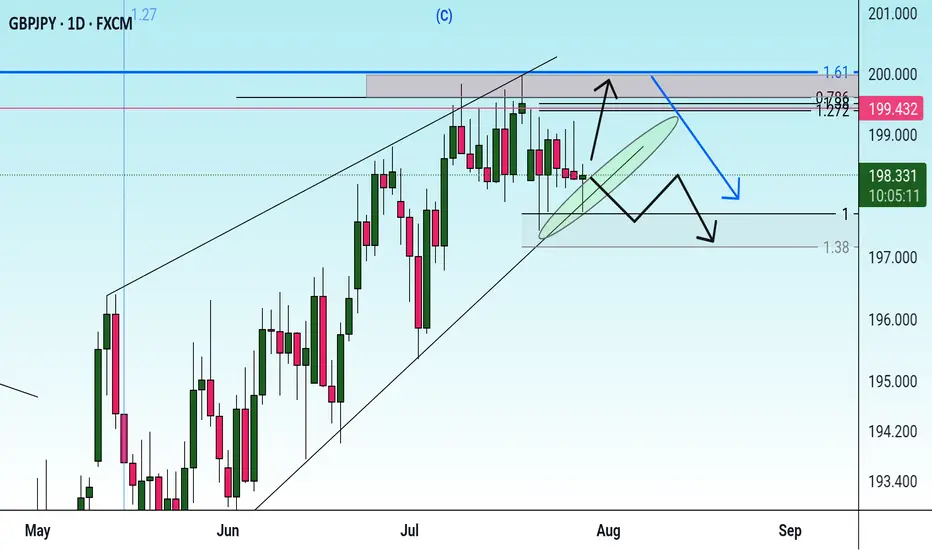
GBPJPY is moving towards a decrease in the parity rate.The predicted direction of movement for this high-margin currency pair seems to me to be more of a corrective one and I have displayed my desired price target on the chart. If it is in line with your analysis, you can use this price target for your profit limit points. Please note that this is a weekly chart.
Thanks
MJ.REZEI

GBPJPY – Bearish pressure returns near ascending channel supportGBPJPY is trading close to the lower trendline of the ascending channel, with the 197.400 zone acting as a key support. A breakdown below this level could trigger stronger bearish momentum.
On the news front, Japan’s CPI remains solid, strengthening the yen. Meanwhile, the British pound is under pressure after recent consumer spending data showed signs of weakness, raising concerns over the UK’s economic outlook.
Strategy: If the price breaks below 197.400 and fails to bounce back, consider SELL setups in line with the bearish trend. If it rebounds, watch the reaction around the 199.100 zone for signs of recovery confirmation.

GBP-JPY Rising Support! Buy!
Hello,Traders!
GBP-JPY is trading in an
Uptrend and the pair made
A retest of the rising support
And we are seeing a local
Bullish rebound and we will
Be expecting a further
Local move up
Buy!
Comment and subscribe to help us grow!
Check out other forecasts below too!
Disclosure: I am part of Trade Nation's Influencer program and receive a monthly fee for using their TradingView charts in my analysis.

GBPJPY SellLIT cycle combined with Daily cycle. Price is overall bearish as it took liquidity on higher time-frames and we should be trading away from the inducement.

Possibility of correction As long as the price fluctuates above the support trend line, the continuation of the uptrend is likely. If the price crosses the support trend line, it will be a confirmation of the downtrend and the start of a downtrend or correction is likely.
GJ SHORT (Scalp)I have a Supply zone lined at 198.345, found on the 15min. It also correlates with previous hourly resistance found towards the end of June.
I don't expect a massive falloff from this point so I'm just targeting at 1:2RR.
If extreme bearish momentum is to be found, I personally would wait for the unfilled gap at 199.500 to be filled first.
However, by the time you could consider a shift to bullish structure.
For now, I'm focusing on my 1:2 short today.

GBPJPY 4HOUR TIME FRAME BUY ANALYSISOn the 4-hour chart, GBP/JPY is showing clear signs of a renewed bullish trend:
Higher-highs & higher-lows
Since mid-July, price has been carving out a staircase of successive peaks and troughs. The latest swing low around 197.30 held firm, and the subsequent rally cleared the June–July consolidation high near 198.40.
Breakout and retest
Price broke above a shallow descending trendline at ~197.65 late yesterday, then pulled back to retest that line as new support. Your entry at 197.902 sits just above that retest, giving a tight buffer to the stop.
Stop-loss placement
The SL at 197.275 undercuts the recent 4H swing low (197.30), so if that level fails it argues the bullish thesis is invalidated.

GBPJPY short Fundamental and Trend line structure analysis
possible 600 pip short position
mid term trend line structure break out

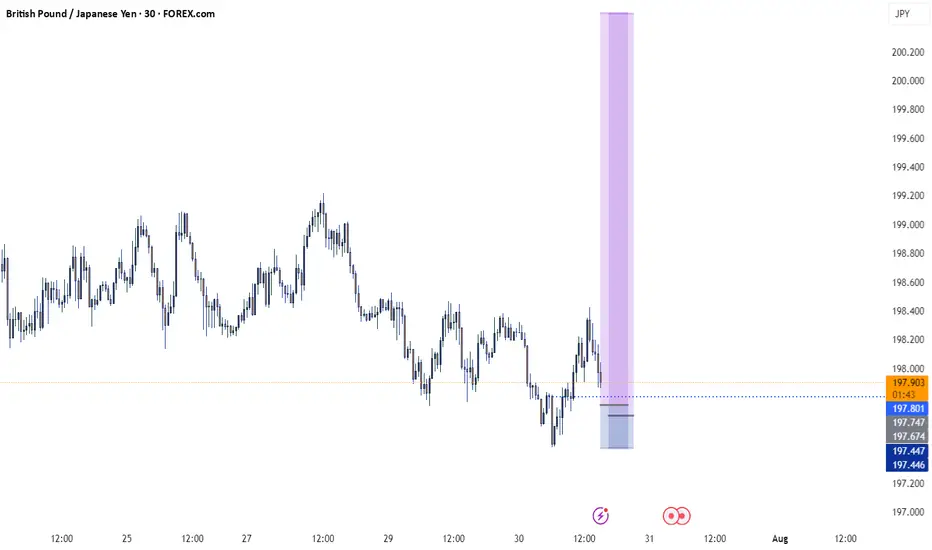
GBPJPY| Bullish Bias - Range Play Before The SweepPair: GBPJPY
Bias: Bullish
HTF Overview (4H):
Structure remains bullish, but price is currently sitting inside a tight top-of-range formation. No clear breakout yet — still waiting on a deeper sell-side liquidity sweep to fuel the next leg. Until then, the focus is on how price dances within mid-range liquidity.
LTF Confirmation (30M):
Still watching for a clean sweep of previous internal lows from last week. 30M OB is refined and marked — once it’s mitigated, I’ll wait for LTF confirmation.
Entry Zone: Will monitor for 5M shift and intent after OB mitigation.
Targets: Initial target = 5M highs; extended = 30M highs depending on price delivery.
Mindset Note: Sitting on hands until Smart Money shows its hand. No rushing range plays. Patience = precision.

GBPJPY LONGHello, as you can see on the GBPJPY chart, there is a very strong support zone that price has not broken. In fact, we can also identify a fake breakout below that level, which reinforces the strength of the support.
My first target (TP1) is set at the next strong resistance zone, which aligns with a previous support turned resistance. The second target (TP2) is the Order Block (OB) at the top, which also aligns with where my strategy predicts the price will move. This setup suggests a potential bullish move from the current levels.

Guppy - Long TradeExpecting a bearish move down and then a strong reversal at the levels displayed!
Happy Trading!

GBPJPY Potential UpsidesHey Traders, in the coming week we are monitoring GBPJPY for a buying opportunity around 197.900 zone, GBPJPY is trading in an uptrend and currently is in a correction phase in which it is approaching the trend at 197.900 support and resistance area.
Trade safe, Joe.

GBPJPY Daily chart analyses
Advanced Price Analysis with Timeframes
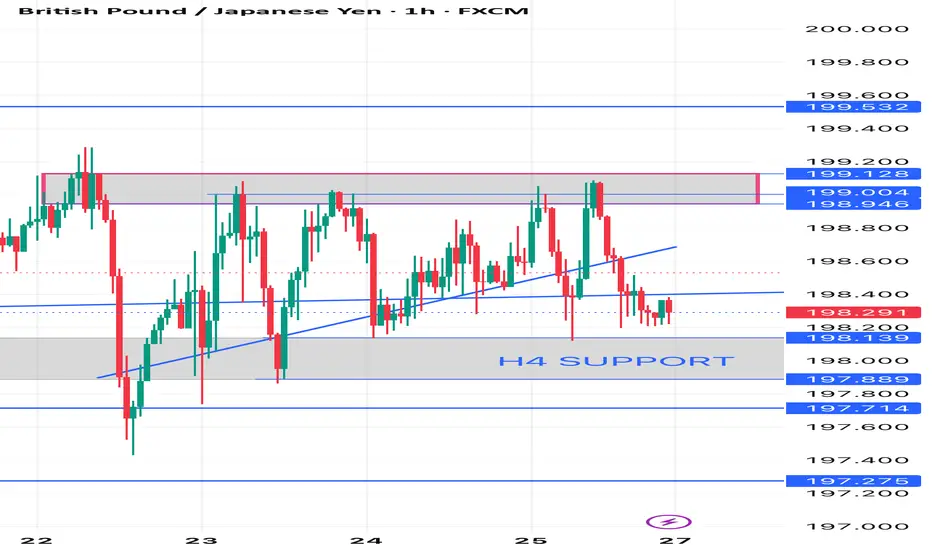
1. Key Observations from the Provided Data (H4 Chart)
Current Price197.800 testing the H4 SUPPORTlevel at 198.000
- Trend Downtrend (Lower Highs & Lower Lows).
- *Recent Structure
- Resistance ~199.600 (rejected multiple times).
- **Support -198.000 (critical level).
- If 198.000 breaks next support is 197.500–197.000
*a) Higher Timeframe (Daily/D1)
- If the **daily trend is bearish**, the H4 downtrend is likely to continue.
- If the **daily trend is bullish**, the H4 drop could be a retracement before a bounce.
- **Key Confirmation Needed**:
- Check if **198.000 aligns with a daily support level** (e.g., Fibonacci, moving averages).
**b) Lower Timeframe (H1/M15)
- **Breakdown Scenario**: If price stays below **198.000** with strong bearish candles, expect a drop to **197.500 → 197.000**.
- **Rebound Scenario**: If price holds **198.000** and forms a bullish reversal pattern (e.g., hammer, double bottom), a bounce to **198.600–199.000** is possible.
---
*3. Key Levels to Watch
| **Level** | **Importance** | **Scenario** |
|-----------------|-------------------------|--------------|
| **199.600** | Strong Resistance | Only break = Trend reversal |
| **198.600** | Minor Resistance | Re-test if bounce occurs |
| **198.000** | **H4 SUPPORT (Critical)** | Hold = Bounce / Break = Drop |
| **197.500** | Next Support | Target if 198 breaks |
| **197.000** | Psychological Support | Strong demand zone |
---
4. Trading Strategy Suggestions**
- **Bearish Bias (Down)**:
- Short if **198.000 breaks** with confirmation (e.g., closing below + high volume).
- Target: **197.500 → 197.000**.
- Stop Loss: **Above 198.300**.
- **Bullish Bias (Up)**:
- Long if **price bounces from 198.000** with a bullish pattern.
- Target: **198.600 → 199.000**.
- Stop Loss: **Below 197.800**.
---
5. Final Verdict**
- **Higher Probability**: **Downside** (unless 198.000 holds strongly).
- **Reversal Signal Needed**: Bullish engulfing, RSI divergence, or volume surge.
**Recommendation**: Wait for **confirmation at 198.000** before taking a trade.
GBPJPY short From what I'm seeing
GBPJPY is not done yet
As buyers have tried to push price higher but pressure from the sellers still keeping price from going any further.
The battle continues
Causing the market to range
Next week tell who wins
For I'm seeing sellers with the upper hand
My thoughts 💭 on GJ 🤔

Understanding Market Structure: GBPJPY Trendline Support 📊 GBPJPY Technical Analysis — 15-Min Chart (As of July 24, 2025)
Trend Structure & Price Action
The chart shows a clear ascending trendline, connecting higher lows across the last sessions.
Multiple Break of Structure (BOS) points confirm bullish market behavior, with price consistently forming higher highs and higher lows.
The most recent BOS and price rejection from the lower boundary of the cloud band indicate bullish intent is still active.
Indicators Used
Custom Cloud Band (EMA Based 20, 1.5 settings):
Price is oscillating within and around the cloud band.
Recent candles are attempting to reclaim the upper band, suggesting building bullish momentum.
Volume Profile (VRVP) shows strong volume support around the 198.200–198.500 range, aligning with the trendline.
Support & Resistance
Support Zone: 198.200 (trendline confluence + volume shelf)
Immediate Resistance: 198.800–199.000
Major Resistance: 199.400 (next psychological level and prior high)
Forecast & Trade Idea (Educational Purpose)
If price continues to respect the ascending trendline and breaks above the recent local high (~198.750), we could see a bullish breakout toward 199.200+.
A bullish flag or small consolidation above the trendline before breakout is likely, as illustrated by the arrow.
Invalidation occurs if price breaks and closes below the trendline and 198.200, which may trigger a short-term correction.
✅ Conclusion
GBPJPY is currently in a bullish market structure with support from both trendline and volume profile. A clean breakout above 198.800 with volume confirmation could fuel continuation toward 199.200 and beyond. Risk management is crucial — watch for false breakouts or a shift in structure below the rising trendline.

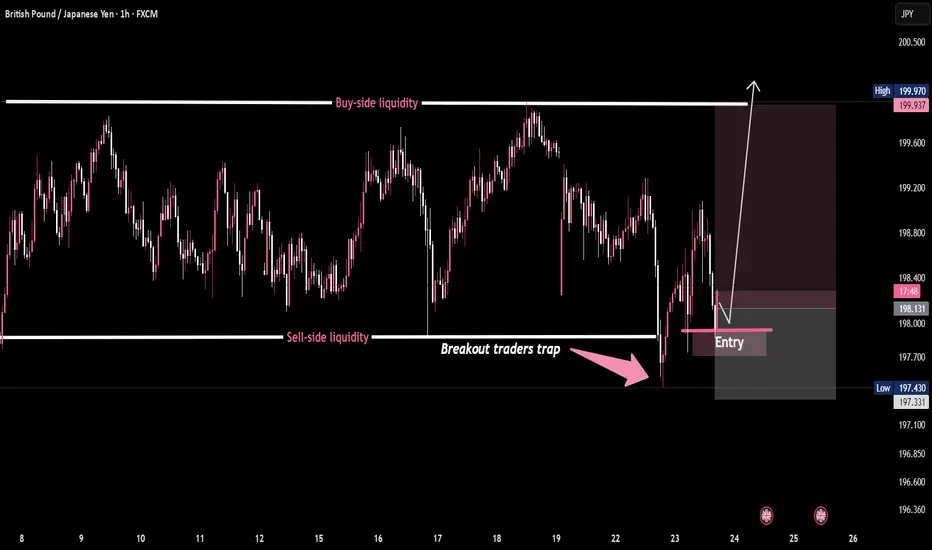
GBP/JPY - Classic Breakout Trap in PlayPrice nuked below range lows to sweep sell-side liquidity, trapping breakout sellers.
Smart money scooped it up. Entry reclaimed — now eyeing buy-side liquidity above 🎯
This is how the game is played:
1️⃣ Liquidity grab
2️⃣ Breakout trap
3️⃣ Reclaim & reverse
4️⃣ Target resting orders up top 🚀
📈 GBP/JPY – Classic Breakout Trap in Play 🧠💥
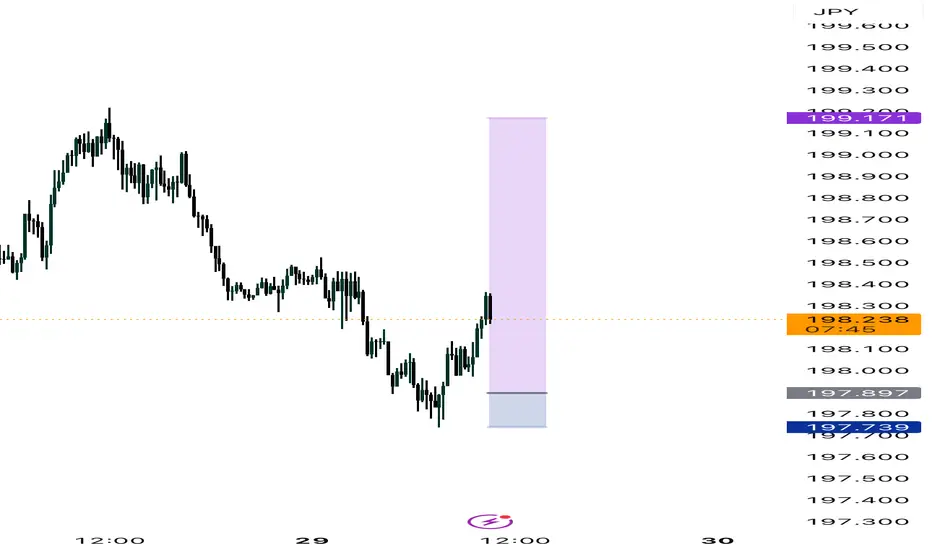
Pound-yen consolidates below critical resistanceWeaker retail data and concerns about fiscal policy which affected the pound negatively and caused it to decline against various other major currencies don’t seem to have had a big impact on GBPJPY. Several recent trade deals between the USA and other countries including Japan have reduced demand for havens like the yen and gold. The big shift recently was a significant decline in expectations for the BoJ to hike at its upcoming meeting on 31 July: a hold at 0.5% now seems much more likely.
¥200 would normally be a strong area of psychological resistance and this seems to be likely based on unsuccessful tests in the fourth quarter of 2024. Above there, the next likely area of resistance might be ¥207 around last summer’s highs. Another attempt to push above ¥200 might be more technically likely to succeed because there’s no longer an overbought signal from the slow stochastic. ATR at new lows though could indicate a retracement lower rather than a new upward wave.
There’s no obvious candidate for short-term static support but dynamic support would probably come from the 50 SMA from Bands. British credit and mortgage data on 29 July might increase intraday volatility somewhat but the next strong catalyst is much more likely to come from news about tariffs and/or the BoJ’s press conference on 31 July.
This is my personal opinion, not the opinion of Exness. This is not a recommendation to trade.

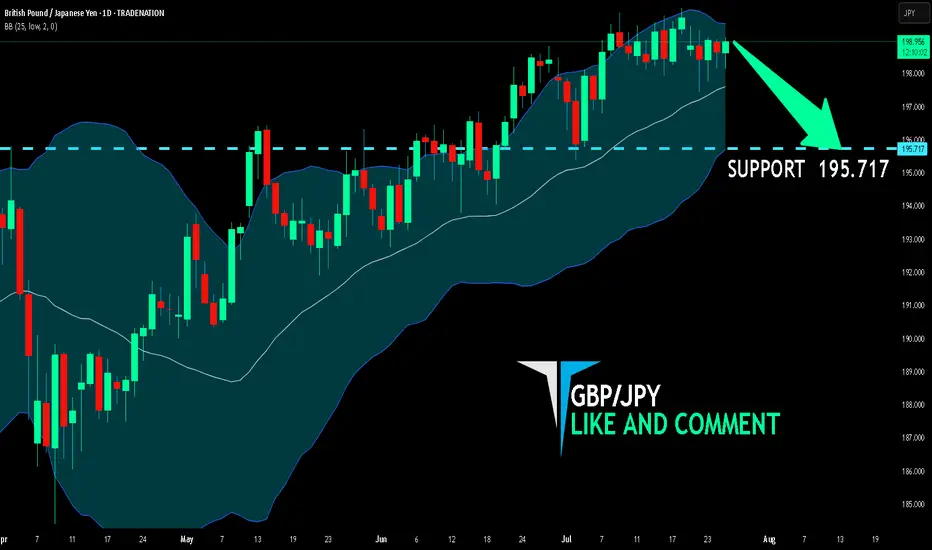
GBP/JPY BEARISH BIAS RIGHT NOW| SHORT
Hello, Friends!
GBP/JPY pair is trading in a local uptrend which we know by looking at the previous 1W candle which is green. On the 1D timeframe the pair is going up too. The pair is overbought because the price is close to the upper band of the BB indicator. So we are looking to sell the pair with the upper BB line acting as resistance. The next target is 195.717 area.
Disclosure: I am part of Trade Nation's Influencer program and receive a monthly fee for using their TradingView charts in my analysis.
✅LIKE AND COMMENT MY IDEAS✅