GBPJPY trade ideas

GBPJPY uptrend co0ntinuation support at 196.75Key Support: 196.75
This level marks the prior consolidation zone and serves as a critical pivot. A corrective pullback toward 196.75 followed by a bullish reversal would validate the uptrend, with upside targets at:
199.20 – Initial resistance and short-term target
199.70 – Minor resistance zone
200.40 – Longer-term breakout objective
However, a daily close below 196.75 would invalidate the bullish scenario, potentially triggering a deeper retracement toward:
195.80 – Near-term support
194.80 – Key downside level in a bearish reversal
Conclusion:
As long as 196.75 holds, the bias remains bullish, favoring continuation toward the 199–200 zone. A confirmed break below this support would shift momentum, opening the door for a broader corrective decline.
This communication is for informational purposes only and should not be viewed as any form of recommendation as to a particular course of action or as investment advice. It is not intended as an offer or solicitation for the purchase or sale of any financial instrument or as an official confirmation of any transaction. Opinions, estimates and assumptions expressed herein are made as of the date of this communication and are subject to change without notice. This communication has been prepared based upon information, including market prices, data and other information, believed to be reliable; however, Trade Nation does not warrant its completeness or accuracy. All market prices and market data contained in or attached to this communication are indicative and subject to change without notice.

GBPJPY: Buy ideaHigh probability of an increase in GBPJPY according to the pattern shown on the chart.

GBPJPY Potential UpsidesHey Traders, in today's trading session we are monitoring GBPJPY for a buying opportunity around 197.700 zone, GBPJPY is trading in an uptrend and currently is in a correction phase in which it is approaching the trend at 197.700 support and resistance area.
Trade safe, Joe.

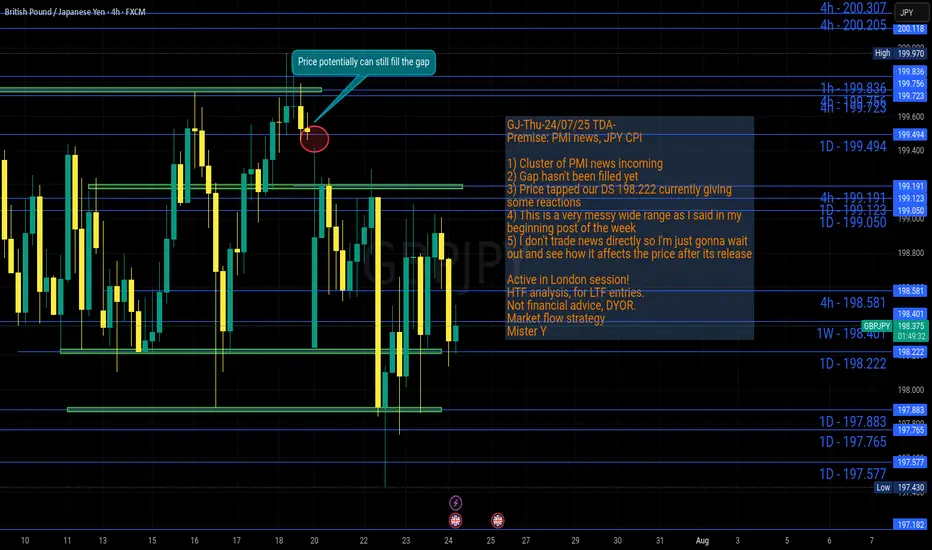
GJ-Thu-24/07/25 TDA-Messy wide range, gap hasn't been filled yetAnalysis done directly on the chart!
Premise:
A simple idea plan (like Tradingview public posts) won't describe everything.
No one can predict how market will move, it's always good to react to how it moves.
It gives an idea of how price might move, but no one come from FUTURE.
So I always encourage people to openly and actively discuss in real time.
I don't give signals blindly, people should learn
and understand the skill.
Following blindly signals you won't know how to
manage the trade, where precisely put sl and tp,
lot size and replicate the move over time.
That's why you need active real time discussions.
Trading is not get rich quick scheme!
Active in London session!
Not financial advice, DYOR.
Market Flow Strategy
Mister Y
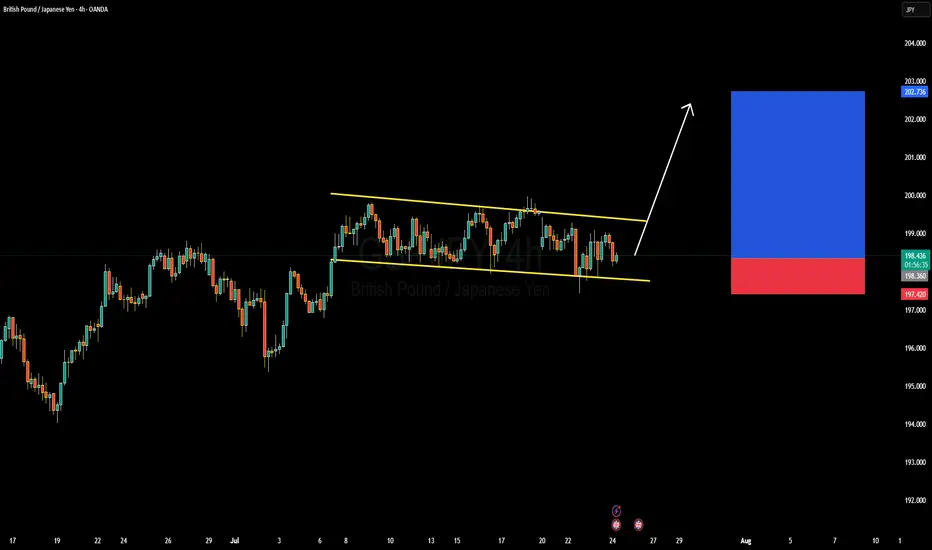
GBPJPY Forming Descending ChannelGBPJPY is currently trading within a well-defined descending channel on the 4H chart, showing signs of building pressure toward an upside breakout. The price has consistently respected both the upper and lower bounds of this channel, creating a controlled correction within a larger bullish trend. With the recent bounce off the lower channel boundary, the pair is now preparing for a potential bullish breakout, aiming for a target zone near 202.700 in the coming sessions.
From a fundamental perspective, the British pound is benefiting from hawkish commentary by the Bank of England, which continues to battle sticky inflation. The latest UK inflation data suggests that price pressures remain elevated, prompting market participants to anticipate further tightening or a prolonged hold in interest rates. On the other hand, the Japanese yen continues to weaken due to the Bank of Japan’s ultra-loose monetary policy, making GBPJPY attractive for long positions amid widening yield differentials.
Technically, the structure remains bullish in the broader context, and this descending channel looks more like a bullish flag—a continuation pattern. If bulls maintain momentum and break above the upper trendline near 199.50, we can expect a strong impulsive move toward the 202–203 zone. The risk remains well-defined below 197.40, which is the recent swing low, giving a healthy risk-to-reward setup for traders.
With strong technical structure and fundamental divergence favoring the British pound over the yen, GBPJPY presents a high-probability long opportunity. I'm looking for confirmation of a breakout on lower timeframes, and once triggered, I expect clean bullish follow-through. Stay ready for the breakout—it’s a textbook setup aligning with macro and technical confluence.
GBPJPY outlook: Potential Sell Setup FormingPrice action has recently broken out of a sustained uptrend and completed a retest of the former trendline support, now acting as resistance. This behavior suggests a potential bearish setup is developing.
📉 Entry Level: ~198.700
🛑 Stop Loss: 199.200
🎯 Take Profit Targets:
• TP1: 196.515
• TP2: 194.521
We’re now watching for confirmation to enter short, anticipating a move toward the stated profit targets should momentum continue to shift in favor of the bears.

GBPJPY – is the end of the range near?After nearly two weeks stuck in the 197.600–200.000 range, GBPJPY has successfully shaken off a bearish fakeout and is now consolidating near the upper FVG zone. The bullish structure remains intact within the rising channel – and this time, the market may not forgive another missed opportunity.
Supporting news:
– UK CPI data released yesterday came in hotter than expected → inflation pressure is back → market expects the BoE to stay hawkish → GBP gains strength.
– Meanwhile, the JPY continues to weaken as the BoJ maintains ultra-low interest rates, setting the stage for this pair to surge.
A breakout above 200.000 could open the door for a push toward the channel top – this could be the ignition point for a major summer rally.

Possible GBY/JPY bullish?I did mark my chart. You can look at it and decipher accordingly! If you have any ideas or mark ups please drop them or tag me in them :)


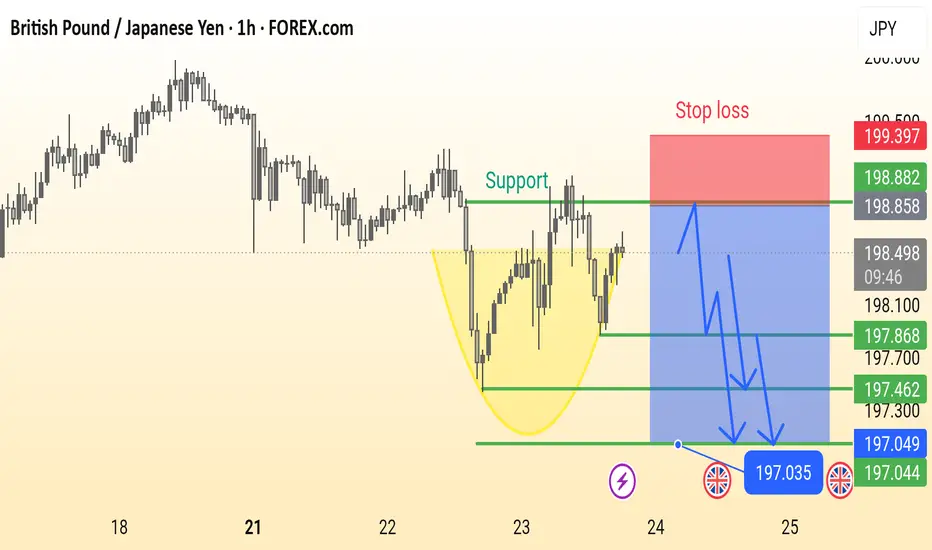
GBP/JPY Analysis is Ready This is a 1-hour chart of the GBP/JPY currency pair showing a potential bearish setup. Key elements include:
Support Zone: Around 198.000, previously tested multiple times.
Bearish Cup Pattern: Highlighted in yellow, suggesting a reversal.
Stop Loss: Marked above 199.397.
Sell Entry Zone: Near the support break at ~198.000.
Bearish Targets: 197.868 → 197.462 → 197.035 (with final support near 197.044).
Bearish Projection Arrows: Indicate expected price movement after breakdown.
This chart suggests a sell setup on breakdown, with well-defined risk and reward levels.
GBP/JPY 4H - Rejection from Supply Zone and Key Fib AreaOverview:
GBP/JPY is trading near 197.91, and recent price action suggests a potential short opportunity. The pair has been rejected from a key Fibonacci resistance zone, and bearish momentum appears to be building beneath a fading ascending channel. Let’s break down why this chart leans more bearish.
Market Structure Breakdown:
* Price action failed to sustain new highs above 199.90 and is now forming lower highs, a potential early sign of trend exhaustion.
* The recent bounce from 197.40 was muted and rejected near the 0.5 and 0.618 retracement levels, indicating strong supply around the 198.68–198.98 zone.
Fibonacci Confluence:
* The rejection occurred right at the 0.618 retracement of the prior downswing — a key Fibonacci level often used by institutional traders to re-enter in the direction of the trend.
* Price is now hovering below the 0.382 (198.38) and 0.5 (198.68) levels, which may now act as resistance.
* If the current rejection holds, downside targets are:
* 0.0 (197.40) – recent low
* -0.27 extension (196.70) – potential bearish continuation target
* -0.618 extension (195.81) – extended downside objective
Trendline & Channel Considerations:
* The ascending channel is losing momentum.
Moving Averages:
* Price is now below the 50 EMA, and testing the 200 EMA, which is at risk of breaking.
* A clear close below both EMAs would confirm bearish momentum.
RSI & Momentum:
* The RSI shows bearish divergence on recent highs and is struggling to break above the midline (50).
* Momentum is tilting to the downside and failing to build higher on bounces.
Key Zones:
* Resistance Zone: 198.60–198.98
* Strong Fibonacci confluence + previous supply
* Support Zone: 197.40
* Prior swing low and 0.0 Fib level
* Bearish Continuation Zone: Below 197.30
* Breakout would confirm downside acceleration toward 196.70 and 195.80
Conclusion:
GBP/JPY is showing signs of bearish pressure beneath key resistance. With the rejection from the 0.618 Fib level and weakening channel structure, the path of least resistance may be to the downside — especially if price breaks and holds below 197.40.
A confirmed breakdown opens the door toward 196.70 and possibly 195.80, as bearish continuation unfolds. Overall we can even see price hitting past historical levels at 189.50

Sell gbpjpyStrong sell expected
Strong resistance respecting but wait to break the trend clearly on daily time frame

GBPJPY 4HOUR TIME FRAME ANALYISOn the 4-hour chart, GBP/JPY has been tracing out a clear up-trend over the past several weeks, marked by a sequence of higher highs and higher lows. Your proposed long entry at 198.632 neatly coincides with two layers of support:
Trendline support: A rising trendline drawn off the last two significant swing lows intercepts right around 198.6, suggesting the pair is catching a bid as it back-tests that line.

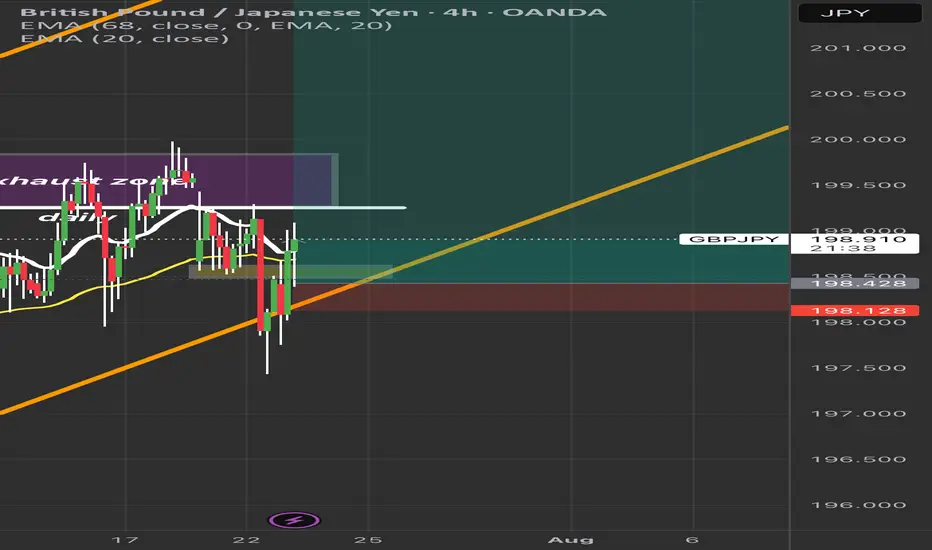
GBPJPY Breakout or Trap? Price in Key Exhaustion Zone | 4H ChannGBPJPY is sitting at a critical point inside an ascending channel. After rejecting the exhaustion zone multiple times, price is trying to reclaim bullish momentum. Key levels to watch:
✅ Bullish Bias: Hold above 198.400 and break past 199.200 for continuation toward 200.000+.
⚠️ Bearish Risk: A break below 198.400 could signal a deeper correction.
The 20 EMA and 68 EMA are converging—expect a strong move soon!
Question: Do you think we break out or fake out? Comment below! 👇
#GBPJPY #ForexTrading #PriceAction #ForexSignals #GBPJPYAnalysis #TradingView #ForexSetup #TechnicalAnalysis #ForexStrategy #SwingTrading #ForexEducation #ForexMarket #DayTrading
GJ-Wed-23/07/25 TDA-Gap hasn't been filled yet!Analysis done directly on the chart!
Premise:
A simple idea plan (like Tradingview public posts) won't describe everything.
No one can predict how market will move, it's always good to react to how it moves.
It gives an idea of how price might move, but no one come from FUTURE.
So I always encourage people to openly and actively discuss in real time.
I don't give signals blindly, people should learn
and understand the skill.
Following blindly signals you won't know how to
manage the trade, where precisely put sl and tp,
lot size and replicate the move over time.
That's why you need active real time discussions.
Trading is not get rich quick scheme!
Active in London session!
Not financial advice, DYOR.
Market Flow Strategy
Mister Y

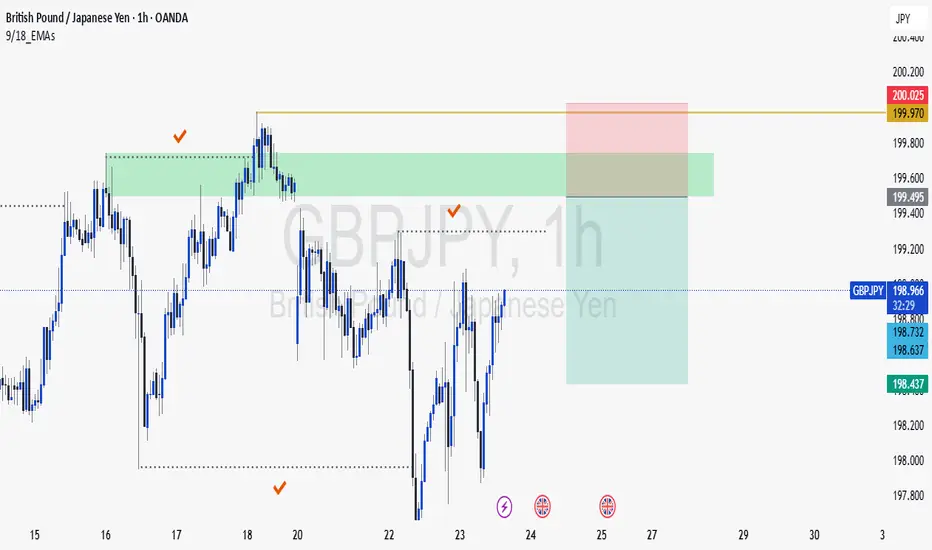
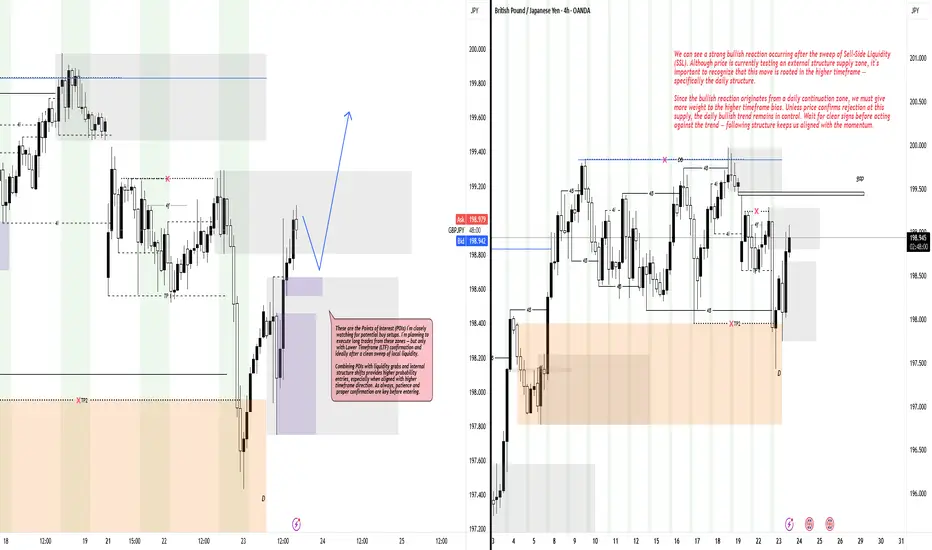
Bullish Continuation Setup: Reacting from Daily StructureHey Traders, hope you’re having a great day! 👋
GBPJPY is making a sharp bullish reaction after sweeping the Sell-Side Liquidity (SSL). Although price is currently at an external structure supply zone, this move originates from the daily structure, so the dominant daily bullish continuation bias remains intact.
I’m watching key Points of Interest (POIs) for potential buy trades, planning to enter only with Lower Timeframe (LTF) confirmation and after a clean liquidity sweep. This method combines smart liquidity hunting with structural alignment, increasing the probability of successful trades.
Patience and proper confirmation will be key to trading this setup effectively.
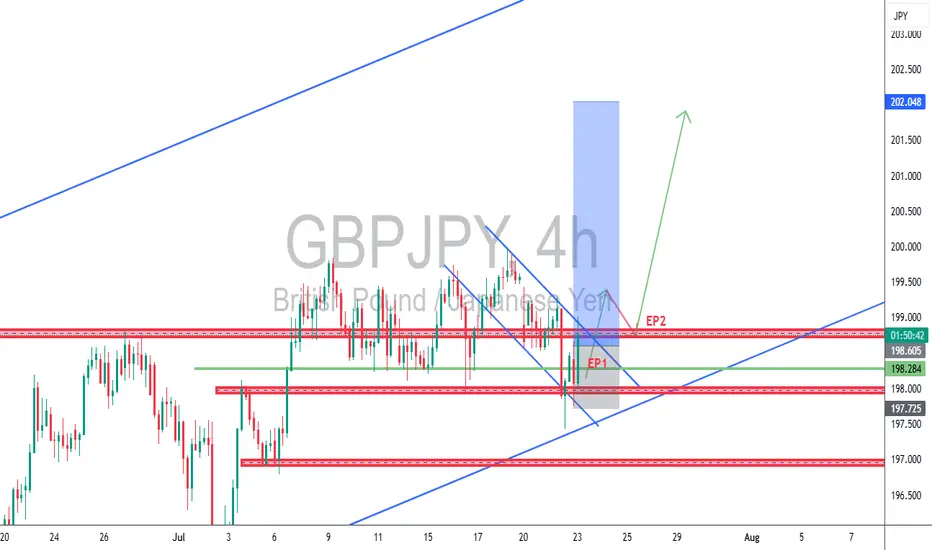
GBPJPY 4H – A+ Setup Using TCB Strategy, Bullish continuation
📈 GBPJPY 4H – A+ Setup Using TCB Strategy 🔥
Bullish continuation setup unfolding with precision.
✅ Trend Phase:
Higher highs and higher lows confirm uptrend
Price bounced from ascending trendline and demand zone
EP1 already triggered on bullish rejection from key support
✅ Countertrend Phase:
Falling wedge (countertrend channel) broken to the upside
Early confirmation for continuation from breakout
✅ Breakout Phase (Pending):
Clean structure at 199.00 acting as resistance
EP2 will be activated after bullish breakout + successful retest of 199.00
Targeting major resistance around 202.000
📍 SL below demand (~197.70)
🎯 TP: 202.000
⚖️ RRR: ~1:3
🧠 Confluences:
Bullish trendline support
Demand zone reaction
Falling wedge breakout
Upcoming key level breakout (199.00)
Price action confirmation
📌 Watch closely for the breakout-retest of 199.00 before engaging EP2.
Manage risk, move SL to breakeven at 1:1.
🔖 Hashtags:
#GBPJPY #ForexSetup #TCBStrategy #TechnicalAnalysis #BreakoutTrade #SwingTrading #SmartMoneyConcepts #FXSignals #TrendTrading #PriceAction #TCBFlow
🗣️ Drop your comment if this setup adds value or aligns with your bias! 👇
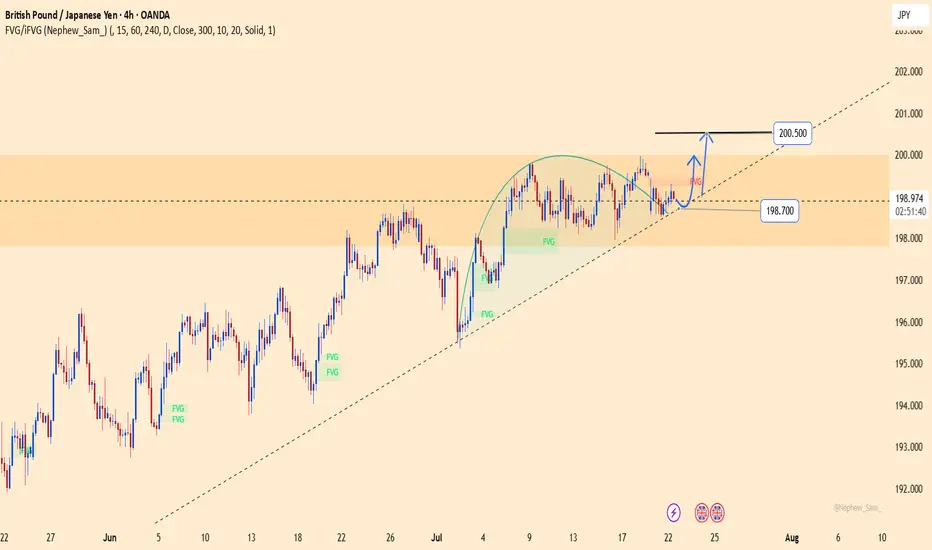
GBPJPY – breakout loading: final leap to 200.500?After days of compression, GBPJPY is flashing clear signs of an explosive breakout.
Price is holding firmly above the ascending trendline and consolidating right at the top of the FVG zone – a strong signal that buyers are preparing to punch through the 200.500 resistance in one decisive move.
Meanwhile, the JPY continues to lose ground as the BoJ shows no clear intention to hike rates, while GBP gains support on expectations that the BoE will maintain its hawkish stance longer due to persistent core inflation.
Trade setup (reference):
Buy limit: 198.900
SL: below 198.500
TP: 200.500
MAJOR MONTHLY SUPPLY ZONE ON GBP/JPY SELLERS INBOUNDRegarding the monthly supply zone, my technical analysis indicates that the price has historically failed to breach this area over several years. I anticipate a potential reversal and recommend waiting for confirmation, such as a double top or harmonic pattern, before initiating a sell position. Furthermore, i will consider selling opportunities upon the .618 Fibonacci level being reached.
Entry: 199.0
Take Profit: 183.3
Overall Price Target: 163.0

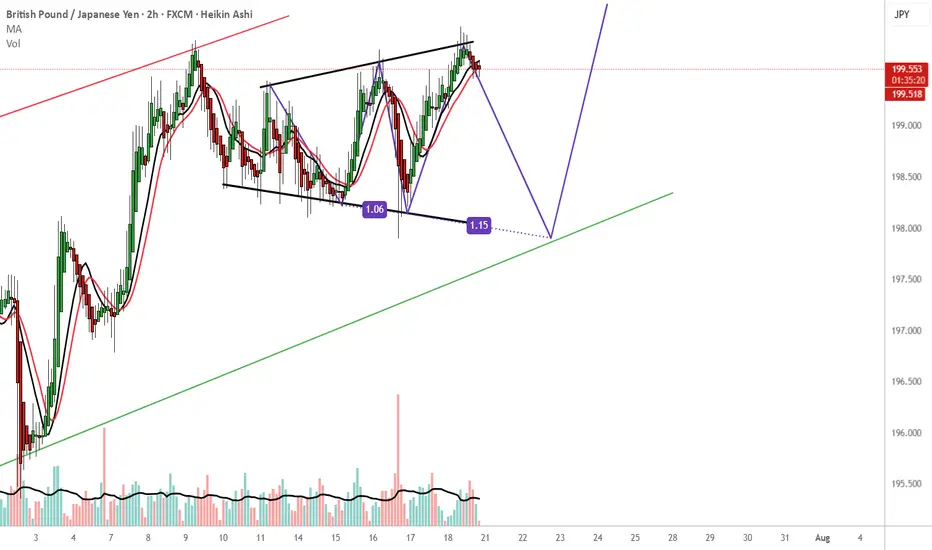
GBPJPY - How i see the market. WHAT DO YOU THINK?A channel within a channel .
Short-term bearish pressure to complete the 3-drives pattern, which ultimately suggests a long bullish setup. I'd only consider this setup if the trend continues to 198.000.
side note
198.000 I'll be looking for buying opportunities to the upside probably until we hit the red channel trendline. That should guarantee approx. 350pips.
You could take advantage of the current bearish move and rejoin when the bulls hit the ground running. Remember use your own trading plan and enjoy the ride . It can go either way but hopefully it respects PA and goes with this flow.