Forecast in, Profits Out: GBPNZD Entry & Target RevealedHello my dear friends,
I’ve prepared an analysis for the GBPNZD pair. I share these insights to help you earn money from the markets.
First and foremost, let’s remember this: as traders, we only forecast market structure. We prepare our analysis and trade based on predictions. But in the end, whatever the whales want—*that’s* what happens. Never forget that.
From time to time, we may be wrong in our analysis, and that’s perfectly okay. What truly matters is that our losses never exceed our gains.
Now, let’s get to the point:
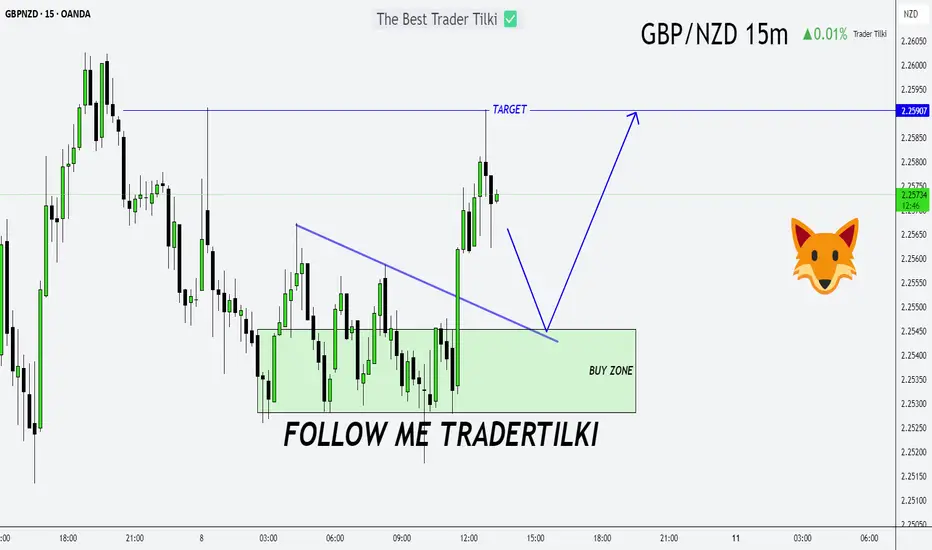
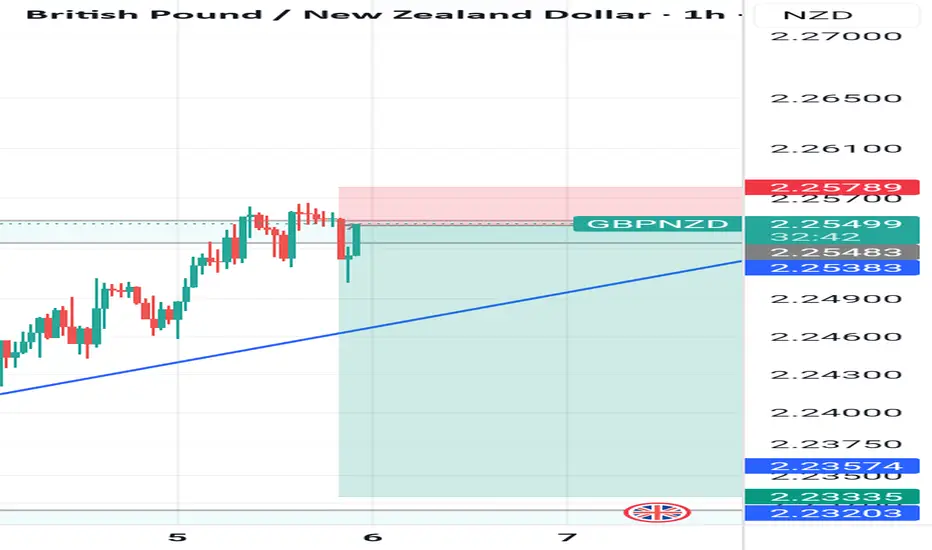
I plan to open a buy position on GBPNZD around the 2.25455 or 2.25282 levels. After entering the trade, my target will be 2.25907.
Every single like you send is my biggest source of motivation to keep sharing these analyses. Thank you so much to everyone who supports me with a like!
GBPNZD trade ideas
GBPNZD Breakout from Consolidation Bullish Momentum BuildingGBPNZD has broken out of its recent consolidation pattern and is showing signs of bullish continuation. Strong GBP fundamentals combined with NZD weakness from global risk-off sentiment and tariffs support this technical move.
Technical Analysis (4H Chart)
Pattern: Breakout from a descending channel with bullish follow-through.
Current Level: 2.2418, trading above the breakout level, confirming momentum shift.
Key Support Levels:
2.2294 – recent breakout support and invalidation point for bulls.
2.2222 – secondary support if a deeper pullback occurs.
Resistance Levels:
2.2500 – near-term resistance and potential target for the breakout.
2.2690 – extended bullish target if momentum continues.
Projection: Likely to continue higher toward 2.2500, with room for 2.2690 if GBP strength persists.
Fundamental Analysis
Bias: Bullish.
Key Fundamentals:
GBP: Supported by BOE’s cautious stance on inflation and the relative resilience of the UK economy.
NZD: Pressured by global tariffs, weaker risk sentiment, and limited domestic growth catalysts.
USD Factor: Fed rate cut expectations indirectly support GBP crosses against risk currencies like NZD.
Risks:
Hawkish surprise from RBNZ could strengthen NZD.
BOE dovish signals could stall GBP upside.
Key Events:
BOE meeting and UK CPI.
RBNZ policy decision.
Risk sentiment trends globally.
Leader/Lagger Dynamics
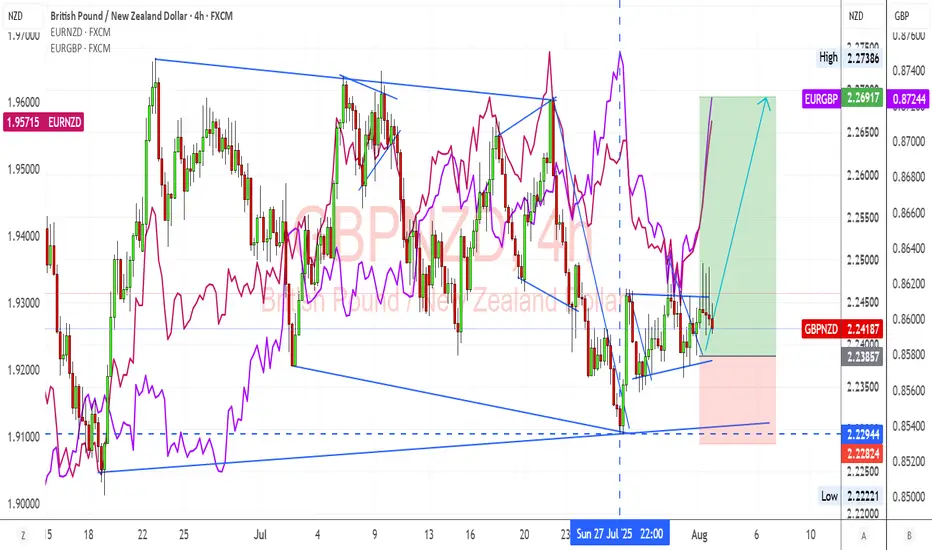
GBP/NZD is a leader among GBP crosses, with GBP strength and NZD weakness driving momentum. It also aligns with EUR/NZD upside moves, reinforcing the bearish NZD outlook.
Summary: Bias and Watchpoints
GBP/NZD is bullish, having broken consolidation with upside targets at 2.2500 and 2.2690. The main drivers are GBP’s policy support, NZD’s risk-off weakness, and global tariff concerns. Watch for BOE and RBNZ updates as potential volatility triggers.
GBPNZD: Another Bullish Wave Coming 🇬🇧🇳🇿
GBPNZD respected a strong rising trend line on a daily.
The price formed a cup & handle pattern on that
and violated its horizontal neckline yesterday.
I think that another up movement is ahead.
Goal - 2.26
❤️Please, support my work with like, thank you!❤️

GBP/NZD Bearish Momentum Building: Wolfe Wave Signals a Drop
---
📉 **GBP/NZD Bearish Momentum Building: Wolfe Wave Signals a Drop**
The GBP/NZD pair has shaped up a compelling **Wolfe Wave pattern**, now tipping toward a bearish continuation. The setup is already in motion, with price action showing signs of aligning with a downward trajectory.
🚨 **Key Technical Highlights**
- ✅ Wolfe Wave structure is fully formed and validated.
- 🔻 A break below the **red zone** signals the start of accelerated selling pressure.
- 🎯 Target: Candlesticks are now aiming to touch the **dashed line between wave 1 and wave 4**—the classical Wolfe Wave destination that often dictates reversal equilibrium.
📊 **Why It Matters**
This isn't just a dip—it’s a structurally supported fall backed by harmonic rhythm and clear pattern mechanics. Traders recognizing this alignment could be preparing for a swift ride down, with high conviction backed by wave theory.
⚠️ **Trade Watch**
If price plunges beneath the key red zone, expect velocity. This kind of setup isn’t one to drift—it’s wired for momentum.
---


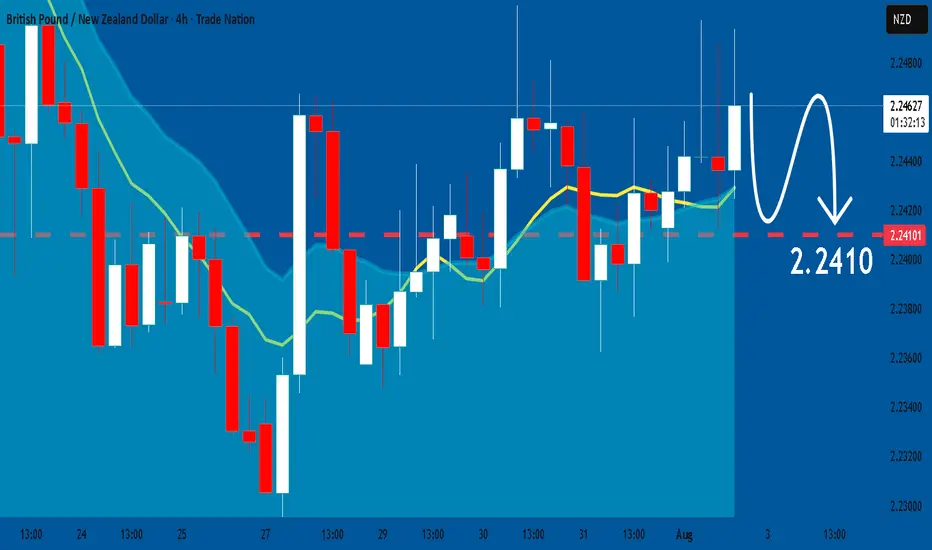
GBPNZD Under Pressure! SELL!
My dear friends,
Please, find my technical outlook for GBPNZD below:
The price is coiling around a solid key level - 2.2531
Bias - Bearish
Technical Indicators: Pivot Points High anticipates a potential price reversal.
Super trend shows a clear sell, giving a perfect indicators' convergence.
Goal - 2.2463
About Used Indicators:
The pivot point itself is simply the average of the high, low and closing prices from the previous trading day.
Disclosure: I am part of Trade Nation's Influencer program and receive a monthly fee for using their TradingView charts in my analysis.
———————————
WISH YOU ALL LUCK

MarketBreakdown | EURCHF, WTI CRUDE OIL, GBPNZD, DXY
Here are the updates & outlook for multiple instruments in my watch list.
1️⃣ #EURCHF daily time frame 🇪🇺🇨🇭
The market is testing a strong supply area
based on a solid falling trend line and a horizontal resistance.
Probabilities will be high that the price will retrace from that.
2️⃣ CRUDE OIL #WTI daily time frame 🛢️
The price is very close to a significant demand zone
based on a horizontal support cluster and a rising trend line.
I will expect a bullish reaction to that.
3️⃣ #GBPJPY daily time frame 🇬🇧🇳🇿
The market is trading within a contracting triangle.
The price nicely respected its support line and goes up steadily.
I think that bullish momentum will remain strong and the market
will go up to the resistance line of a triangle.
4️⃣ DOLLAR INDEX #DXY daily time frame 💵
The market is consolidating on a key daily support cluster.
Probabilities will be high that the price will bounce from that.
Today's fundamental news can be a trigger.
Do you agree with my market breakdown?
❤️Please, support my work with like, thank you!❤️
I am part of Trade Nation's Influencer program and receive a monthly fee for using their TradingView charts in my analysis.

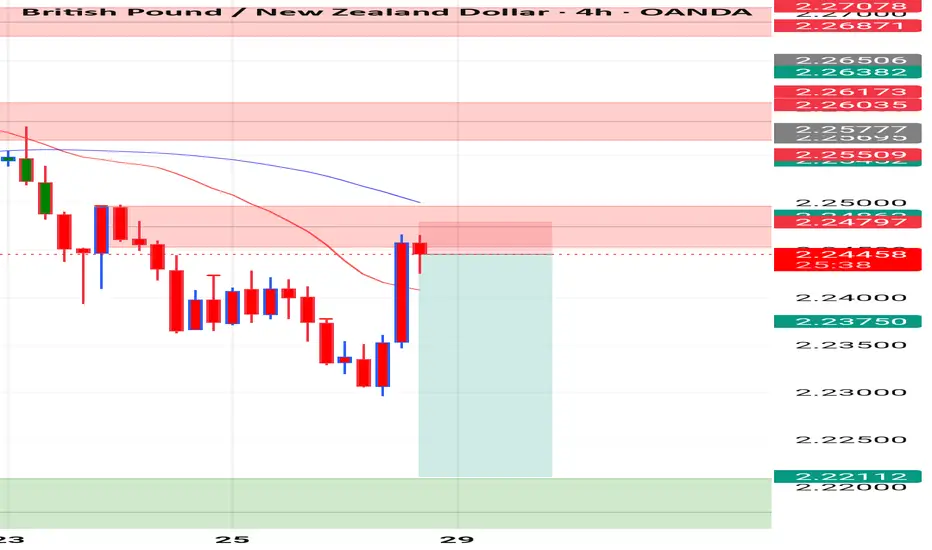
GBP_NZD BULLISH BREAKOUT|LONG|
✅GBP_NZD broke the key structure level of 2.2500
While trading in an local downtrend
Which makes me bearish
And I think that after the retest of the broken level is complete
A rebound and bearish continuation will follow
SHORT🔥
✅Like and subscribe to never miss a new idea!✅

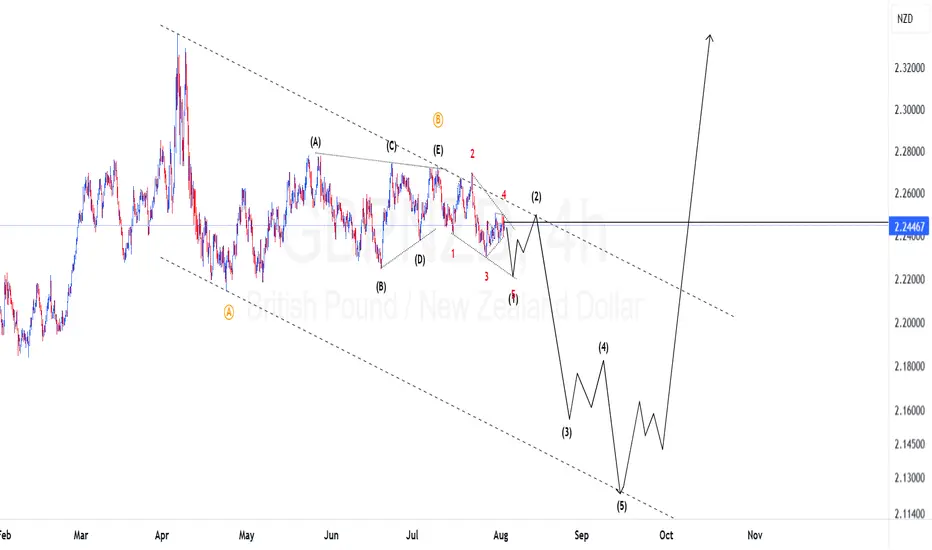
GBPNZD Elliot waves updatePrice is still on the first wave of wave C. Given the current wave structure it looks like we should expect first wave to unfold as a leading diagonal. If we are correct then during the coming week we should expect price to gain momentum to the down side to complete the leading diagonal with the 5th wave. To take advantage of this bearish bias one should find areas of resistance and other confluences to take the trade.
GBPNZD SHORT Market structure bearish at HTFs 3
Entry at both Weekly and Daily AOi
Weekly Rejection at AOi
Weekly Previous Structure Point
Daily Rejection At AOi
Daily EMA retest
Previous Structure point Daily
Around Psychological Level 2.25000
H4 Candlestick rejection
Levels 4.48
Entry 110% GVIBEZ
REMEMBER : Trading is a Game Of Probability
: Manage Your Risk
: Be Patient
: Every Moment Is Unique
: Rinse, Wash, Repeat!
: Christ is King.

Short on gbpnzd Price reach to a resistance and there,we have a some doji and spin candles and then we have a strong red candle,,so i enter....
GBPNZD MARKET ANALYSIS AND PRICE PREDICTIONGBPNZD, has experienced a massive Bullish rejection, this rejection has produced Bearish orders for three times, meaning there is a confirmed Bearish Trend. Price Has retested the order block and there is a successful Liquidity Hunt for the Bearish Trend Continuation. The targets are the two unmitigated order block, Entry is now.
Entry. Stop loss And Take Profits are clearly stated on the chat.
GOOD LUCK GUYS!
DISCLAIMER
Any analysis can fail due to markets uncertainties. take full responsibility of your capital and manage your risk!

GBP_NZD BEARISH BIAS|SHORT|
✅GBP_NZD has retested
A resistance level of 2.2500
And we are seeing a bearish reaction
With the price going down so we are
Bearish biased now and we will be
Expecting the pair to go further down
SHORT🔥
✅Like and subscribe to never miss a new idea!✅
Disclosure: I am part of Trade Nation's Influencer program and receive a monthly fee for using their TradingView charts in my analysis.

GBP/NZD POTENTIONAL SHORT OPPORTUNITYThis is an idea for GBPNZD's potential short opportunity based on what the technicals indicate.
The trend has been emphasising its bullish approach for almost three years.
Price respected almost 11 times due to the strong resistance within 150 days between 2.265 & 2.275 and bounced off bullish OB on the daily chart and FVG on the weekly chart.
An institutional sharp decline on the weekly chart, followed by a clear wedge, can support a further drop once swept by bearish daily OB. A breakout to the micro wedge (orange) within a macro wedge can also help further down move.
Given that a bearish pin bar followed by a bearish doji is a strong warning signal of potential reversal or bearish continuation that appears inside the micro wedge.
TP1 is considered the first support at the bottom, where the daily OB and the weekly FVG meet at around 2.22000 or the area close to the trendline. If the price breaks through the trendline, TP2 and TP3 will be expected to be achieved.
TP2 may be located at the micro accumulation around 2.20000, and TP3 at the following major support around 2.15000-2.17000 that previously acted as both support and resistance.
Good luck and have a great weekend.

GBPNZD BullishAfter exiting a correction, the first impulse (Wave 1) appears. I expect a retracement of at least 50% of the Fibonacci.

GBPNZD: Will Keep Falling! Here is Why:
The charts are full of distraction, disturbance and are a graveyard of fear and greed which shall not cloud our judgement on the current state of affairs in the GBPNZD pair price action which suggests a high likelihood of a coming move down.
Disclosure: I am part of Trade Nation's Influencer program and receive a monthly fee for using their TradingView charts in my analysis.
❤️ Please, support our work with like & comment! ❤️
Short on GBPNZD i'm shorting GBP/NZD due to the liquidity zone below, which suggests a potential downside breakout. The pair is approaching a significant support level where previous buy orders are likely clustered. If price breaks through this zone, stop-loss orders could be triggered, accelerating downward momentum. Additionally, fundamental factors

gbpnzdGBP/NZD – Set to Breakdown. Forex Strategy is Bearish: GBP/NZD is currently at 2.2479 in a range. With this breakout, we are looking for a small pullback ..
sl
down support

GBPNZDI would like to share this complex correction. Here I'm looking to take this to the blue box before a drops

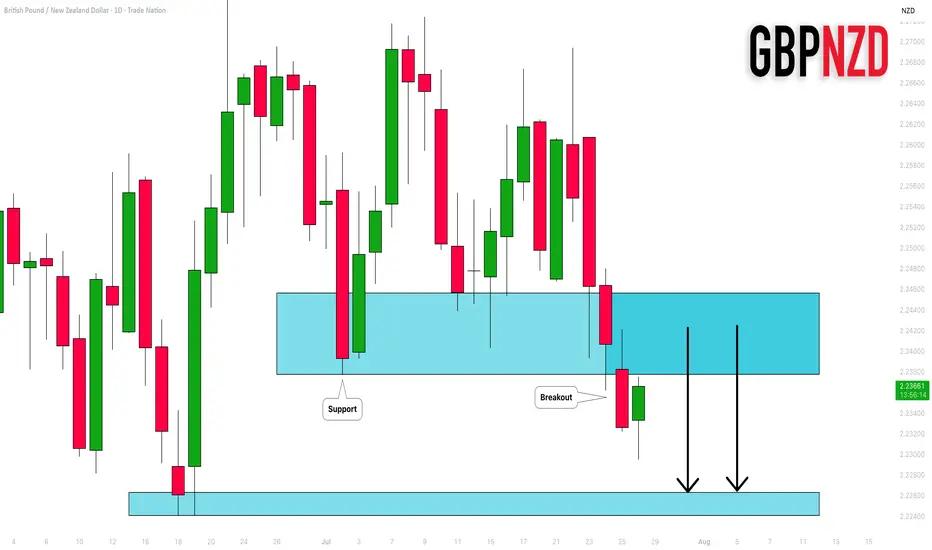
GBPNZD: Important Breakout 🇬🇧🇳🇿
GBPNZD broke and closed below a significant support cluster on a daily.
The broken structure turned into a strong resistance.
I will expect a bearish move from that.
Next support - 2.2264
❤️Please, support my work with like, thank you!❤️
I am part of Trade Nation's Influencer program and receive a monthly fee for using their TradingView charts in my analysis.
BUY GBPNZDGBPNZD is currently forming a bearish flag pattern. This trade idea is based on the assumption that price will retest the resistance trend line once more before plummeting

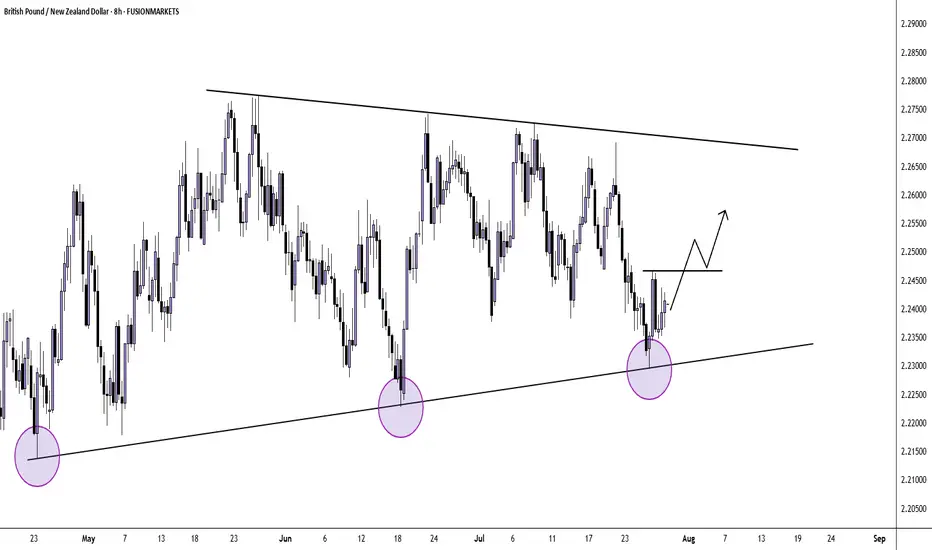
GBP/NZD H8 AnalysisPrice has rejected the support trendline for a third time.
It's possible that we will now see buyers step in but we need to see higher highs and lows form to confirm.
Look for a trade that meets your strategy rules if you agree.