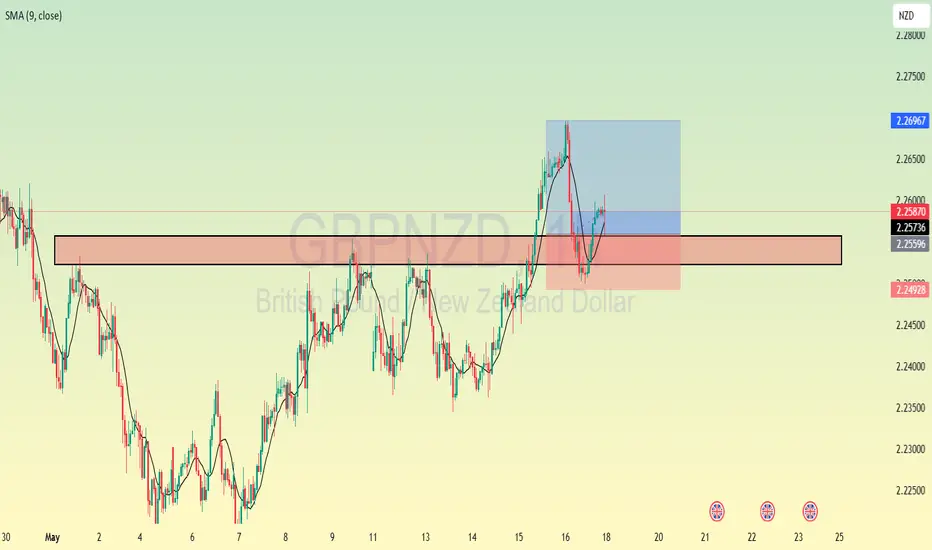
GBPNZD: A NICE OPPORTUNITY TO GO LONG HERE.I'm going long, there's been a sweep of the previous low indicating a grab of liquidity to the downside and a break of structure to the upside indicating a continuation of the bullish trend. Price has created an internal liquidity to take out early buyers while preparing for a take off to the upside.
GBPNZD trade ideas

GBPNZD on BULLISHGBPNZD has been on BULLISH. All setup going, Signal sent on my free group.. Let's make more pips💙

gbpnzd buy signal. Don't forget about stop-loss.
Write in the comments all your questions and instruments analysis of which you want to see.
Friends, push the like button, write a comment, and share with your mates - that would be the best THANK YOU.
P.S. I personally will open entry if the price will show it according to my strategy.
Always make your analysis before a trade

GBPNZD BUY IDEAMkt trend - Downtrend after BOS on Daily
Price forming H&S on daily, First shoulder and head formed with price action going to form second shoulder.
price is approaching a POI/Support area. Lookout for signal at support level for an upside move/short buys

GBPNZD | 19.05.2025SELL 2.26800 | STOP 2.28800 | TAKE 2.24400 | The pound has been showing gains since the opening of this week's trading. In this pair we expect an approach to the strong resistance in the range of 2.26800 - 2.28500 and reversal of the movement down to the local support. We are also oriented on the publication of economic data this week.

GBPNZD: 800+ Pips Possible Buying Opportunity!OANDA:GBPNZD
Price currently at the possible rebound area where we can expect price to reverse from, upcoming weeks expecting GBP to be bullish against NZD. However, first we will have to wait for price to reject and rebound strongly. Based on that you may take entry using accurate risk management. At least eying at 700-800 pips. Good Luck and Trade Safe.
show us some love by liking and commenting the idea. ❤️

GBPNZD: 1100+ PIPs Move, Get Ready For Price To Bounce! Hey there everyone
We’re feeling optimistic about GBPNZD and expecting a bullish move that could take it to its previous yearly high. We’ve set three take profit targets, but feel free to adjust them based on your own analysis.
Good luck and trade safely! We really appreciate your unwavering support! ❤️🚀
If you’d like to lend a hand, here are a few ways you can contribute:
- Give our ideas a like
- Share your thoughts in the comments
- Spread the word about our ideas
Cheers,
Team Setupsfx_

GBP/NZD – 3rd Trendline Touch + 61.8% Fibo + H1 Support🧠 Trading Idea
On the H1 timeframe, GBP/NZD is currently consolidating after a strong prior drop. The price is testing:
a rising trendline (3rd touch),
the 61.8% Fibonacci retracement from the last upward swing,
and a horizontal support zone matching previous structure levels.
This triple confluence suggests an increased chance of a bullish bounce.
🌐 Fundamental Context
GBP is supported by stronger economic data (inflation, retail sales, and PMI).
NZD is under pressure due to weaker outlook and possible dovish tone from the RBNZ.
The fundamental bias currently favors GBP strength over NZD.
📊 Technical Summary
The H1 chart shows sideways consolidation near the trendline, without strong bearish momentum.
A confirmed bounce (e.g., bullish candle, higher low) could provide room for trend continuation.
Watching closely how price reacts at the golden fib ratio zone.
📌 Summary
This idea highlights a potential bullish scenario at the 3rd touch of a trendline, supported by technical confluence and a favorable fundamental backdrop. Confirmation is key, but long bias currently holds higher probability than short.
This analysis is for educational and informational purposes only. It does not constitute financial advice or a trading recommendation. Always conduct your own research and risk management. Trading involves significant risk of loss and is not suitable for all investors.

KIWI stength Hello traders,
Following pairs on watch:
FX:GBPNZD
FX:EURCAD
FX:GBPCAD
FX:NZDUSD
TVC:USOIL
FX:GBPAUD
FX:AUDUSD
CRYPTO:ETHUSD
MEXC:ETHUSDT.P CAPITALCOM:US100

GBP/NZD BEARS ARE GAINING STRENGTH|SHORT
Hello, Friends!
The BB upper band is nearby so GBP-NZD is in the overbought territory. Thus, despite the uptrend on the 1W timeframe I think that we will see a bearish reaction from the resistance line above and a move down towards the target at around 2.225.
Disclosure: I am part of Trade Nation's Influencer program and receive a monthly fee for using their TradingView charts in my analysis.
✅LIKE AND COMMENT MY IDEAS✅

GBPNZD – Bearish Rejection + Fundamental DivergenceGBPNZD is facing strong resistance at 2.2757, where price is showing signs of a double top / lower high formation. This zone aligns with prior rejection highs and is reinforced by bearish price action. Momentum is fading, and sellers are beginning to step in.
A break below 2.2500 confirms downside pressure, targeting:
2.2178 – Structural support
2.2002 – Demand area
2.1810 – Swing base
2.1677 – Final bearish extension zone
Fundamental Overview:
🔻 GBP Headwinds:
UK CPI came in hot recently, but forward guidance shows the Bank of England may not hike further.
Growth concerns and mixed economic signals keep GBP vulnerable, especially with weak retail data and subdued consumer confidence.
Political uncertainty and trade tensions with the EU are also weighing on sentiment.
🟢 NZD Tailwinds:
The RBNZ remains relatively hawkish, with inflation still above target and robust employment holding up.
Strong dairy prices and resilient trade balance support the NZ economy.
Risk appetite has been favorable for commodity-linked currencies like NZD.
Summary:
Bias: Bearish below 2.2757
Trigger: Break & close below 2.2500
Targets: 2.2178 → 2.2002 → 2.1810
Invalidation: Break above 2.2800
Fundamental divergence supports downside: GBP faces policy uncertainty and growth risks, while NZD holds firm on RBNZ stance and stable macro backdrop.

Technical outlook for the GBP/NZD pair!The GBP/NZD pair is trading in a general uptrend on both the daily and 4-hour timeframes, forming higher highs and higher lows.
What is the potential upcoming technical scenario?
After the price recorded a new high above the 2.26939 level, a corrective pullback is expected to test the 2.2565 level, followed by a rise targeting the 2.27013 level.
Maintaining the 2.25001 level without breaking below it and avoiding a lower low supports the continuation of the above bullish scenario. However, a decline and a daily candle close below the 2.25001 level would indicate a shift from a bullish to a bearish trend, thus invalidating the bullish scenario.

GBPNZD- Bearish Wedge Pattern - SHORT SELL GBPNZD ; after series of HH and HL, now is the time for the market to take some reversal. market has formed divergence on 30 M time frame. we can see formation of Bearish Wedge patter which is a strong indication of up-trend getting weaker.
Once, market breaks the LH we can enter into the market. we have got projection on the charts (thanks to wedge pattern)
we have 4 TPs with a R:R of 1:1, 1:2 , 1:3 and 1:4 respectively.
SL is placed slightly above last LH.

GBP/NZD For Bullishwait for pull-back near by entry point and then go long
general trend is up trend
NZD under pressure
have fun :)

GBPNZD - Potential SellHi Traders,
Here is my view on CMCMARKETS:GBPNZD
see the GBPAUD analysis.
GBPNZD is more convincing to me.
good luck

GBPNZD Sell Swing Trade Set upHello Traders,
Another sell swing trade set up.
With this market producing some very large candles, this does have the potential to be a big win and the start of a big move
Best of luck on the charts :)

GBPNZD Technical OverviewGBPNZD main structure on D1 chart is a double bottom. Price has been rapidly growing the past 3 weeks. Currently, we can see a bullish flag pattern which may break from here and rally however, we wish it would retest the trend line just one more time :})- ===:

GBP/NZD BUY NOW 2.2605 to 2.3315I see a chart patterns DOUBLE BOTTOM it's really clearly in daily time frame it will be to be uptrend again to 2.3315 from 2.2607 right now price if its bot break the 2.24 support line in Daily time frame good luck friends

GBPNZD 20/05/2025Weekly:
-Bullish M pattern.
-Liquidity sweep.
Daily:
-Bullish M pattern.
4H:
-Inverse H&S pattern.
-IC.

GBPNZD Pushing itself in a buy directionHello Traders
In This Chart GBPNZD 4 HOURLY Forex Forecast By FOREX PLANET
today GBPNZD analysis 👆
🟢This Chart includes GBPNZD market update)
🟢What is The Next Opportunity on EURNZD Market
🟢how to Enter to the Valid Entry With Assurance Profit
This CHART is For Trader's that Want to Improve Their Technical Analysis Skills and Their Trading By Understanding How To Analyze The Market Using Multiple Timeframes and Understanding The Bigger Picture on the Charts
SELL GBPNZDI am anticipating a 900 pip drop from GBPNZD. Price currently trades at 1,259, and it should break below 1,25 before the end of the day. We can see a bearish flag forming within a bearish channel. Also, a head and shoulders pattern could be used to justify the sells.

GBP_NZD WILL GROW|LONG|
✅GBP_NZD has retested a key support level of 2.2520
And as the pair is already making a bullish rebound
A move up to retest the supply level above at 2.2600 is likely
LONG🚀
✅Like and subscribe to never miss a new idea!✅
Disclosure: I am part of Trade Nation's Influencer program and receive a monthly fee for using their TradingView charts in my analysis.

GBPNZD: Bears Will Push Lower
GBPNZD
- Classic bearish formation
- Our team expects fall
SUGGESTED TRADE:
Swing Trade
Sell GBPNZD
Entry Level - 2.2555
Sl - 2.2624
Tp - 2.2425
Our Risk - 1%
Start protection of your profits from lower levels
Disclosure: I am part of Trade Nation's Influencer program and receive a monthly fee for using their TradingView charts in my analysis.
❤️ Please, support our work with like & comment! ❤️
