GBPNZD trade ideas

gbpnzd xabcd buy/hold exit +300 pips🔸Hello traders, let's review the 40 minute chart for GBPNZD.
Chart looks oversold recently, expecting bounce setup soon.
🔸Speculative XABCD structure defined by point X 2460 point A 2210 point B 2400 point C 2180 point D/PRZ 2530 still pending. C also pending later today.
🔸Advanced BUY/HOLD from point C targeting point D of the sequence. Higher risk trade setup, use protective SL and adjust to BE at +60 pips.
🔸Recommended strategy for GN traders: buy/hold at point C TP1 is +150 pips TP2 +300 pips or point D of the XABCD structure.
🎁Please hit the like button and
🎁Leave a comment to support our team!

GBP_NZD LONG FROM RISING SUPPORT|
✅GBP_NZD is trading along the rising support line
And as the pair is going up now
After the retest of the line
I am expecting the price to keep growing
To retest the supply levels above around 2.2532
LONG🚀
✅Like and subscribe to never miss a new idea!✅
Disclosure: I am part of Trade Nation's Influencer program and receive a monthly fee for using their TradingView charts in my analysis.

GN 2 Longs last week - 2 WinsLast week , we had 2 wins on GN both made pullbacks of +50 pips , making 80% win rate for this month so far

GBPNZD BUY signal. Don't forget about stop-loss.
Write in the comments all your questions and instruments analysis of which you want to see.
Friends, push the like button, write a comment, and share with your mates - that would be the best THANK YOU.
P.S. I personally will open entry if the price will show it according to my strategy.
Always make your analysis before a trade

GBP-NZD Local Long! Buy!
Hello,Traders!
GBP-NZD fell down strongly
Through the first line of
Support but a strong support
Was hit around 2.2160 from
Where a local bullish rebound
Is likely to happen on Monday
So we will be able to enter
A long trade with the Take
Profit of 2.2300 and the
Stop Loss of 2.2123
Buy!
Comment and subscribe to help us grow!
Check out other forecasts below too!
Disclosure: I am part of Trade Nation's Influencer program and receive a monthly fee for using their TradingView charts in my analysis.


GBPNZD Will Go Higher! Buy!
Take a look at our analysis for GBPNZD.
Time Frame: 1D
Current Trend: Bullish
Sentiment: Oversold (based on 7-period RSI)
Forecast: Bullish
The market is on a crucial zone of demand 2.224.
The oversold market condition in a combination with key structure gives us a relatively strong bullish signal with goal 2.266 level.
P.S
We determine oversold/overbought condition with RSI indicator.
When it drops below 30 - the market is considered to be oversold.
When it bounces above 70 - the market is considered to be overbought.
Disclosure: I am part of Trade Nation's Influencer program and receive a monthly fee for using their TradingView charts in my analysis.
Like and subscribe and comment my ideas if you enjoy them!

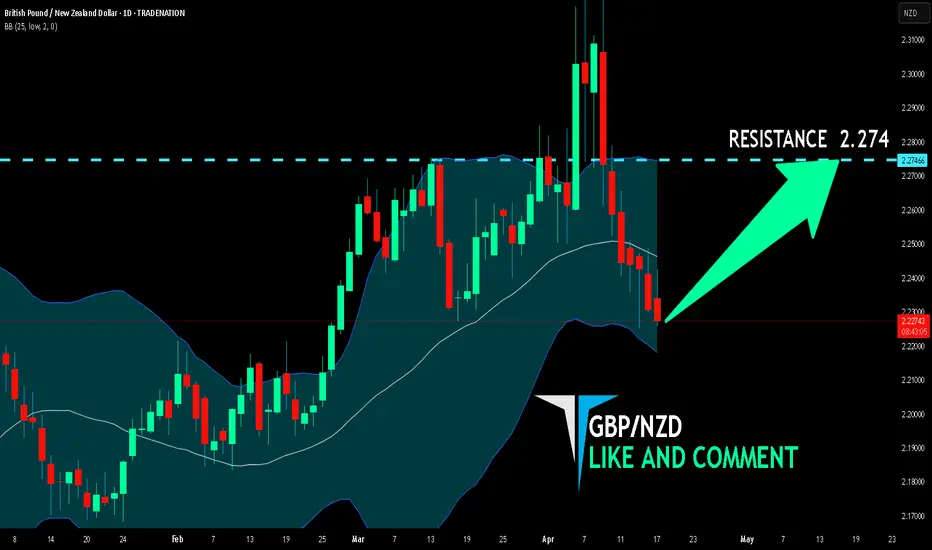
GBP/NZD BULLS ARE STRONG HERE|LONG
Hello, Friends!
GBP/NZD is making a bearish pullback on the 1D TF and is nearing the support line below while we are generally bullish biased on the pair due to our previous 1W candle analysis, thus making a trend-following long a good option for us with the target being the 2.274 level.
Disclosure: I am part of Trade Nation's Influencer program and receive a monthly fee for using their TradingView charts in my analysis.
✅LIKE AND COMMENT MY IDEAS✅
gbpnzd buy signal. Don't forget about stop-loss.
Write in the comments all your questions and instruments analysis of which you want to see.
Friends, push the like button, write a comment, and share with your mates - that would be the best THANK YOU.
P.S. I personally will open entry if the price will show it according to my strategy.
Always make your analysis before a trade

GBPNZD Buyers In Panic! SELL!
My dear friends,
My technical analysis for GBPNZD is below:
The market is trading on 2.2447 pivot level.
Bias - Bearish
Technical Indicators: Both Super Trend & Pivot HL indicate a highly probable Bearish continuation.
Target - 2.2388
About Used Indicators:
A pivot point is a technical analysis indicator, or calculations, used to determine the overall trend of the market over different time frames.
Disclosure: I am part of Trade Nation's Influencer program and receive a monthly fee for using their TradingView charts in my analysis.
———————————
WISH YOU ALL LUCK

GBPNZD Discretionary Analysis: Bounce at 2.18Hello traders.
I'm like what I see on GBPNZD. I'm expecting the momentum to continue. I'm watching that 2.18 zone closely. It's where I'll be looking for a reaction. Could be a solid bounce spot, and if it shows signs, I'm stepping in.
Discretionary Trading: Where Experience Becomes the Edge
Discretionary trading is all about making decisions based on what you see, what you feel, and what you've learned through experience. Unlike systematic strategies that rely on fixed rules or algorithms, discretionary traders use their judgment to read the market in real time. It's a skill that can't be rushed, because it's built on screen time, pattern recognition, and the ability to stay calm under pressure.
There's no shortcut here. You need to see enough market conditions, wins, and losses to build that intuition—the kind that tells you when to pull the trigger or sit on your hands. Charts might look the same, but context changes everything, and that's something only experience can teach you.
At the end of the day, discretionary trading is an art, refined over time, sharpened through mistakes, and driven by instinct. It's not for everyone, but for those who've put in the work, it can be a powerful way to trade.

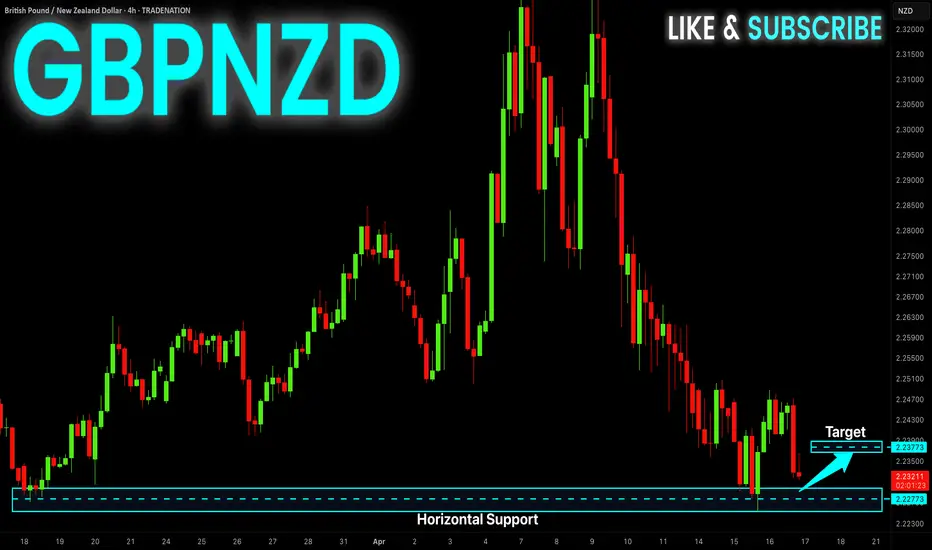
GBP-NZD Local Long! Buy!
Hello,Traders!
GBP-NZD is going down
Again to retest the horizontal
Support level of 2.2253 so
After the price hits the level
A local bullish rebound is
To be expected
Buy!
Comment and subscribe to help us grow!
Check out other forecasts below too!
Disclosure: I am part of Trade Nation's Influencer program and receive a monthly fee for using their TradingView charts in my analysis.

GBPNZD SHORTMarket structure bearish on HTFs 3
Entry at both Daily and Weekly AOi
Weekly Rejection at AOi
previous Weekly Structure Point
Daily Rejection At AOi
Previous Structure point Weekly
Around Psychological Level 2.26500
H4 EMA retest
H4 Candlestick rejection
Rejection from Previous structure
Levels 6.42
Entry 100
REMEMBER : Trading is a Game Of Probability
: Manage Your Risk
: Be Patient
: Every Moment Is Unique
: Rinse, Wash, Repeat!
: Christ is King.

GBPNZD: Classic Bullish SetupAnother pair that appears to be showing bullish signs today is 📈GBPNZD.
The price has broke and closed above a resistance line of a falling wedge pattern after testing a key support level.
Additionally, there is a double bottom formation with a confirmed violation of the neckline. Growth is anticipated, with targets set at 2.2481 and 2.2529.

GBPNZD BUYBuying GBPNZD once it reaches my entry, this market structure always occurs. Precision is what matters. #precision

GBPNZD Technical and Order Flow AnalysisOur analysis is based on multi-timeframe top-down analysis & fundamental analysis.
Based on our view the price will rise to the monthly level.
DISCLAIMER: This analysis can change anytime without notice and is only for assisting traders in making independent investment decisions. Please note that this is a prediction, and I have no reason to act on it, and neither should you.
Please support our analysis with a like or comment!


Potential Sell Opportunity on GBPNZDReasons I think this pair will fall:
-4H trend line broken. Waiting for retest of area of breakout
-Bearish RSI divergence on 4H
-Overbought RSI on 4H
What do you think?

Double Top with bearish divergenceReversal pattern at 1H Time frame.
Most probably it will test it's major support at 2.190

GBPNZDbuying now GBPNZD 2.23818
sl 2.22798
tp 2.27754
1% RISK on EACH trade .
thank you
like an follow for more trades
gbp/nzd trade pre open hours.
