GBPNZD can go longWe can expect a reversal in GBPNZD on Monday. As it has completed AB=CD harmonic Pattern, which may cause a reversal.
GBPNZD trade ideas

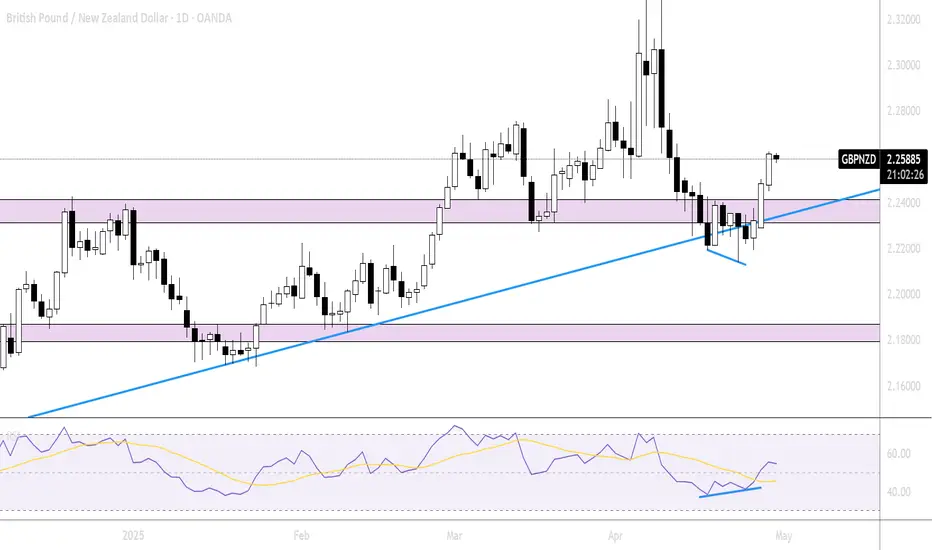
GBPNZD Will Collapse! SELL!
My dear followers,
This is my opinion on the GBPNZD next move:
The asset is approaching an important pivot point 2.2536
Bias - Bearish
Safe Stop Loss - 2.2629
Technical Indicators: Supper Trend generates a clear short signal while Pivot Point HL is currently determining the overall Bearish trend of the market.
Goal - 2.2332
About Used Indicators:
For more efficient signals, super-trend is used in combination with other indicators like Pivot Points.
Disclosure: I am part of Trade Nation's Influencer program and receive a monthly fee for using their TradingView charts in my analysis.
———————————
WISH YOU ALL LUCK

GBPNZD Buy forcastGBPNZD New Forecast👨💻👨💻
This is my personal trade and not in anyway a mandatory setup.
Note:
Follow proper risk management rules. Never risk more then 2% of your total capital. Money management is the key of success in this business...... Set your own SL & TP.
Please support this idea with a Like and COMMENT if you find it useful click "follow" on our profile if you will like these type of trading ideas delivered straight to your email in the future.
Thanks for your continued support!! lemme know your thoughts in the comment sec..

GBP/NZD BEARS ARE STRONG HERE|SHORT
Hello, Friends!
Bearish trend on GBP/NZD, defined by the red colour of the last week candle combined with the fact the pair is overbought based on the BB upper band proximity, makes me expect a bearish rebound from the resistance line above and a retest of the local target below at 2.209.
Disclosure: I am part of Trade Nation's Influencer program and receive a monthly fee for using their TradingView charts in my analysis.
✅LIKE AND COMMENT MY IDEAS✅

GBPNZD Long 4H Timeframe AnalysisHEre is the potential long oppurtunity in GBPNZD, WE can Put the Long Entry Here....

GBP/NZD "Sterling vs Kiwi" Forex Bank Money Heist (Bullish)🌟Hi! Hola! Ola! Bonjour! Hallo! Marhaba!🌟
Dear Money Makers & Robbers, 🤑 💰💸✈️
Based on 🔥Thief Trading style technical and fundamental analysis🔥, here is our master plan to heist the GBP/NZD "Sterling vs Kiwi" Forex Bank Heist. Please adhere to the strategy I've outlined in the chart, which emphasizes long entry. Our aim is to escape near the high-risk ATR Line Zone. It's a Risky level, overbought market, consolidation, trend reversal, trap at the level where traders and bearish robbers are stronger. 🏆💸"Take profit and treat yourself, traders. You deserve it!💪🏆🎉
Entry 📈 : "The heist is on! Wait for the Crossing previous high (2.25500) then make your move - Bullish profits await!"
however I advise to Place Buy stop orders above the Moving average (or) Place buy limit orders within a 15 or 30 minute timeframe most recent or swing, low or high level for Pullback entries.
📌I strongly advise you to set an "alert (Alarm)" on your chart so you can see when the breakout entry occurs.
Stop Loss 🛑: "🔊 Yo, listen up! 🗣️ If you're lookin' to get in on a buy stop order, don't even think about settin' that stop loss till after the breakout 🚀. You feel me? Now, if you're smart, you'll place that stop loss where I told you to 📍, but if you're a rebel, you can put it wherever you like 🤪 - just don't say I didn't warn you ⚠️. You're playin' with fire 🔥, and it's your risk, not mine 👊."
📍 Thief SL placed at the nearest/swing low level Using the 1H timeframe (2.24000) Day trade basis.
📍 SL is based on your risk of the trade, lot size and how many multiple orders you have to take.
🏴☠️Target 🎯: 2.28500
🧲Scalpers, take note 👀 : only scalp on the Long side. If you have a lot of money, you can go straight away; if not, you can join swing traders and carry out the robbery plan. Use trailing SL to safeguard your money 💰.
💰💵💸GBP/NZD "Sterling vs Kiwi" Forex Bank Money Heist is currently experiencing a bullishness,., driven by several key factors. .☝☝☝
📰🗞️Get & Read the Fundamental, Macro Economics, COT Report, Quantitative Analysis, Sentimental Outlook, Intermarket Analysis, Future trend targets with overall score... go ahead to check 👉👉👉🔗🔗🔗
⚠️Trading Alert : News Releases and Position Management 📰🗞️🚫🚏
As a reminder, news releases can have a significant impact on market prices and volatility. To minimize potential losses and protect your running positions,
we recommend the following:
Avoid taking new trades during news releases
Use trailing stop-loss orders to protect your running positions and lock in profits
💖Supporting our robbery plan 💥Hit the Boost Button💥 will enable us to effortlessly make and steal money 💰💵. Boost the strength of our robbery team. Every day in this market make money with ease by using the Thief Trading Style.🏆💪🤝❤️🎉🚀
I'll see you soon with another heist plan, so stay tuned 🤑🐱👤🤗🤩

GBP/NZD Long Setup🔹 GBP/NZD Long Setup
Price tapped into a clear demand zone and showed signs of rejection and potential reversal. I'm anticipating a bullish move toward the next resistance level.
📍 Entry Zone: Around 2.2440
🛑 Stop Loss: 2.2396
🎯 Target (TP): 2.2619
💡 Risk-Reward Ratio: Over 1:4

BULLISH BIAS ON GBPNZD USING TOP DOWN ANALYSIS!!On the 4hr timeframe, price former a wider divergence + a falling wedge right at the key zone all signaling bullish bias and you can see as price broke out from the falling wedge and trendline and continued to push higher!!

BULLISH BIAS ON GBPNZD USING TOP DOWN ANALYSIS!!On the Daily time frame: We established the key weekly zone + momentum loss + tight daily divergence + daily price action candle formation right at the key weekly son all signaling bullish!!
GBPNZD BULLISH BIAS USING TOP DOWN ANALYSIS ON THE WEEKLY TIMEFRAME, Price was is currently in a clear uptrend making higher highs and higher lows. Price created a major weekly resistance turned support + a clear weekly trendline which also lines perfectly with the key zone + clear weekly price action candle that significantly rejected the zone and the trend line all signaling bullish!!

GBPNZD BULLISH BIAS USING TOP DOWN ANALYSIS ON THE MONTHLY TIMEFRAME, It's obvious that price has been very bullish making higher highs and higher lows and forming strong monthly bullish candles.


GBPNZD is ready to push againNo comment needed. All information is in the chart analysis.
Steps to follow:
Analyze yourself.
Take the position with SL and Take Profits.
Wait, it may take a couple of days, so take a break and step away from the screen from time to time, just like I do :)
Get the result.
I will update the trade every day.
Like, comment with your good mood or viewpoint, share with your circle. It’s together that we get stronger!
Good trades, Traders!
The golden bear

GBPNZD Bullish Continuation — Scalps and Swing Buys AheadGBPNZD continues to trend bullish on the 4H, now forming new support at 2.24775 after rejecting 2.23958.
📌 Trade Plan:
If we get another 30M close above 2.24775, we can look to scalp 60 pips to 2.25361
Break of 2.25361 opens the way to first daily target at 2.26228
Additional buy zones at 2.26228 and 2.27286 with final swing target at 2.28114
Pullbacks to 2.23958 can offer further long entries
📊 Bias remains bullish unless structure is broken.
📈 Want real-time updates like this daily?

GBPNZD - Marco Trend Still Up!Hello TradingView Family / Fellow Traders. This is Richard, also known as theSignalyst.
📈GBPNZD has been overall bullish from a macro perspective trading within the rising channels in blue and orange.
Moreover, the green zone is a strong support, structure and demand.
🏹 Thus, the highlighted blue circle is a strong area to look for buy setups as it is the intersection of support and lower orange/blue trendlines acting non-horizontal support.
📚 As per my trading style:
As #GBPNZD approaches the blue circle zone, I will be looking for bullish reversal setups (like a double bottom pattern, trendline break , and so on...)
📚 Always follow your trading plan regarding entry, risk management, and trade management.
Good luck!
All Strategies Are Good; If Managed Properly!
~Rich
Disclosure: I am part of Trade Nation's Influencer program and receive a monthly fee for using their TradingView charts in my analysis.

GBPNZD Wave Analysis – 28 April 2025
- GBPNZD reversed from the support area
- Likely to rise to resistance level 2.2600
GBPNZD currency pair recently reversed from the support area between the support level 2.2220, lower daily Bollinger Band and the 61.8% Fibonacci correction of the upward impulse from January.
The upward reversal from this support area stopped the previous short-term correction A – which belongs to wave (4) from the start of April.
Given the clear daily uptrend and the oversold daily Stochastic, GBPNZD currency pair can be expected to rise toward the next resistance level 2.2600.

GBP-NZD Resistance Ahead! Sell!
Hello,Traders!
GBP-NZD went up sharply
From the support cluster
Below just as I predicted
But now the pair is about
To retest a horizontal resistance
Around 2.2620 from where
A local bearish correction
Will be expected
Sell!
Comment and subscribe to help us grow!
Check out other forecasts below too!
Disclosure: I am part of Trade Nation's Influencer program and receive a monthly fee for using their TradingView charts in my analysis.

GBPNZD LONG day pullback tradewas watching momentum as was coming in and when it faded and I saw a test coming in with volume at the bottom told me now its time

Potentially bullish rise?GBP/NZD has reacted off the support level which is a pullback support and could rise from this level to our take profit.
Entry: 2.2393
Why we like it:
There is a pullback support level.
Stop loss: 2.2190
Why we like it:
There is a pullback support level.
Take profit: 2.2722
Why we like it:
There is a pullback resistance level that aligns with the 50% Fibonacci retracement.
Enjoying your TradingView experience? Review us!
Please be advised that the information presented on TradingView is provided to Vantage (‘Vantage Global Limited’, ‘we’) by a third-party provider (‘Everest Fortune Group’). Please be reminded that you are solely responsible for the trading decisions on your account. There is a very high degree of risk involved in trading. Any information and/or content is intended entirely for research, educational and informational purposes only and does not constitute investment or consultation advice or investment strategy. The information is not tailored to the investment needs of any specific person and therefore does not involve a consideration of any of the investment objectives, financial situation or needs of any viewer that may receive it. Kindly also note that past performance is not a reliable indicator of future results. Actual results may differ materially from those anticipated in forward-looking or past performance statements. We assume no liability as to the accuracy or completeness of any of the information and/or content provided herein and the Company cannot be held responsible for any omission, mistake nor for any loss or damage including without limitation to any loss of profit which may arise from reliance on any information supplied by Everest Fortune Group.

GBPNZD (swing setup)hello everyone, the price is still consolidating, so far no clear break out for now, day tf show the price is corrected, but still no candle break out in htf and still consolidating.. wait for proper pull back before taking a position. either trade from fvg once candle breakout of wait for price to pull back to OB.
The Macd/RSI showing the price is completing the bearish momentum in 4hr tf.
good luck

GBPNZD | 4H | SWING TRADEHey there my dear friends;
SIGNAL ALERT
BUY GBPNZD / 2,23220
🟢TP1: 2,23952
🟢TP2: 2,24909
🟢TP3: 2,27946
🔴SL: 2,20905
Enter low lot because it is high risk 🔽
RR / 2,00
Dear friends, your likes are always my biggest source of motivation for me to share analysis. For this reason, I would like to ask each and every one of my followers; please do not miss your likes.
I sincerely thank everyone who supports me with their likes.

GBPNZD BUY TRADE PLAN
# 🔥 GBPNZD TRADE PLAN 🔥
📅 Date: April 28, 2025
🔖 Plan Type: Intra-Day – Trend Continuation
---
### Trade Plan Overview
|| Type | Direction | Confidence | R:R | Status |
|--------------|-----------|----------------------|----------|-----------|
| Intra-Day | Buy | ⭐⭐⭐⭐ 84% | 3.8:1 | Waiting |
**Guidance**: Prioritize this **Intra-Day Buy Plan** due to 84% confidence from D1 bullish reversal, strong H4 structure shift, and momentum impulse break on H1. Total Portfolio Risk: **0.5%-1%** recommended.
---
# 📈 Primary Trade Plan: Intra-Day – Buy
---
🔰 **Market Bias & Trade Type**
Bias: **Bullish**
Trade Type: **Trend Continuation**
---
🔰 **Confidence Level**
⭐⭐⭐⭐ (84%)
Reason:
- H1 Break of Structure + FVG alignment (30%)
- H4 Trend Shift + Orderblock (30%)
- D1 Bullish Engulfing (24%)
- Sentiment moderately positive (+5/10)
Breakdown: H4 OB 30%, D1 24%, H1 structure 30%.
---
🔰 **Status**
**Waiting** (Price approaching zone for potential entry)
---
# 📍 Entry Zones
🟩 **Primary Buy Zone**: **2.23650 – 2.23150**
(H4 OB + H1 FVG + Fib golden zone 61.8%)
🟧 **Secondary Buy Zone**: **2.23000 – 2.22500**
(H1 Demand + liquidity sweep potential)
---
# ❗ Stop Loss
- **SL**: **2.22000**
(Placed below secondary zone wick and liquidity grab area)
---
# 🎯 Take Profit Targets
🥇 TP1: **2.25000**
(H1 previous swing high)
🥈 TP2: **2.25800**
(H4 liquidity pool zone)
🥉 TP3: **2.27000**
(D1 minor resistance, swing extension target)
---
# 📏 Risk:Reward
- TP1: **2.5:1**
- TP2: **3.8:1**
- TP3: **5.6:1**
---
# 🧠 Management Strategy
- Risk **0.5%** to **1%** of account balance.
- SL to breakeven after TP1 hit.
- Take **50% off** at TP1, **25% at TP2**, and **trail** the remaining 25% to TP3.
- Exit if H1 structure shifts bearish or high-impact news volatility spikes.
---
# ⚠️ Confirmation Criteria
- H1 bullish candle closure inside zone.
- Spike in volume at zone.
- M15 bullish engulfing or FVG reclaim.
- Best timing: **London Session 7AM–10AM GMT** or **New York Early Session**.
- Avoid trading during any major NZD/GBP news spike.
---
# ⏳ Validity
- Valid for 2 Days
---
# ❌ Invalidation
- Price closes below **2.22000** H1 and H4 BOS.
- D1 reversal bearish confirmation.
---
# 🌐 Fundamental & Sentiment Snapshot
- COT Data: GBP moderately bullish; NZD weak neutral.
- DXY: Slight bullishness (risk appetite mixed).
- Retail Sentiment: 63% short GBPNZD.
- Cross-Pair Check: GBPUSD trending up; NZDUSD mixed.
- Cross-Market: Stocks neutral, gold slightly bullish.
- Macro: VIX calm (<18).
Sentiment Score: **+5/10** (bullish bias favoring GBP).
Historical Win Rate for similar setup: **68%**
---
# 📋 Final Trade Summary
Bullish Intra-Day Buy Setup based on multi-timeframe trend alignment and confirmation from OB + FVG. Manage risk tightly and monitor confirmations around entry zone, use full risk protocols and tiered take-profits.

GBP/NZD For Bullishyou can wait for pull-back near by entry point and then go long
general trend is up trend
have fun :)
