GBPNZD trade ideas
GBPNZD Maintains Bullish Momentum - Is 2.27040 the Next Target?OANDA:GBPNZD is trading within a well-defined ascending channel, with price action respecting both the upper and lower boundaries. The recent bounce off the midline suggests buyers are maintaining control, supporting a potential continuation of the uptrend.
As long as the price remains above the support level and the channel's lower boundary holds, the bullish structure remains intact.
A potential upside target is 2.27040, aligning with the upper boundary of the channel. A break and close above this level could signal further bullish momentum.
However, a decisive break below the channel’s lower boundary or the support zone would invalidate the bullish outlook and could signal a shift in market sentiment.
Remember, always confirm your setups and trade with solid risk management.
Best of luck!

GBPNZD Swing trade idea 04/03/2025GBPNZD has been in a strong uptrend since the start of 2024, forming consecutive higher highs and higher lows. We've just hit a new high at 2.26481 and are starting to see rejection. This sets up a high-risk, high-reward swing trade targeting the previous higher high at 2.17900. Nearly 1000 pips of potential! Waiting for further confirmation before entering.

LETS DO IT! GBPNZDThe price has reached the ceiling of the gbpnzd price channel, it looks like we could see a price decline
keep in mind that we are in a bullish channel!

The Bulls Of British PoundGBPNZD - Clear winner on this pair if the trend will continue we can find good buy opportunities this week.
GBP/NZD: let's take profit occur before buying againWith strong bullish momentum, GBP/NZD remains attractive for long positions. Fundamentals favor the GBP over the NZD, while technicals suggest room for further upside.
Fundamentals:
- GBP Strength: Hawkish Bank of England and resilient UK economy.
- NZD Weakness: Recession in New Zealand and dovish RBNZ policy weigh on the NZD.
Trade Idea
- Buy Zone: 2.1945-2.2200. This level corrispond to 0.5 Fibo and also 4h demand.
- Targets: 2.2440, then 2.2800.
- Stop Loss: Below 2.1800.
Important: enter just in case of rejection! it means that price will need to go in the buy zone area and then have a strong upside (CHOC, COS on lower TF).
If you follow me, you will receive updates so you know when and where I enter, close, TP.

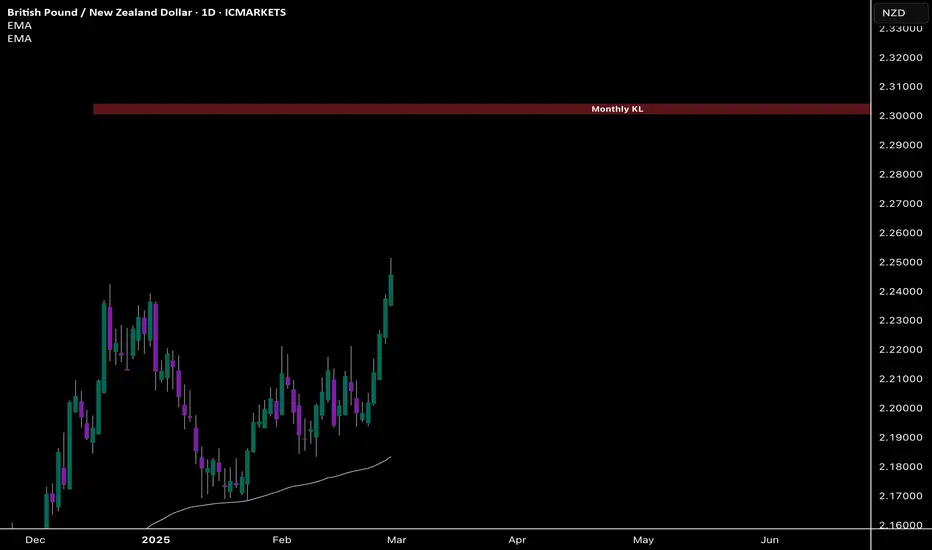
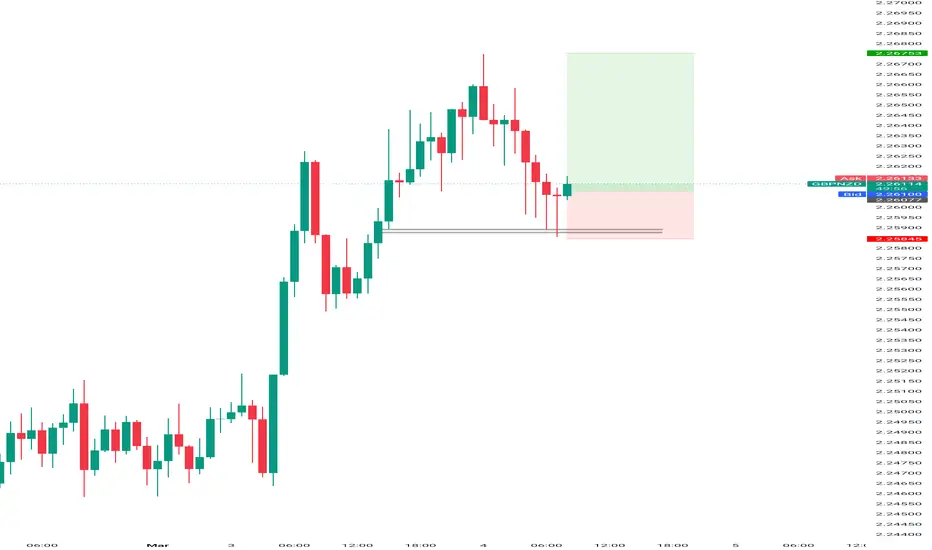
GBPNZD – ready to go long again ... the week of 03 Mar Monthly – bullish
Weekly – bullish
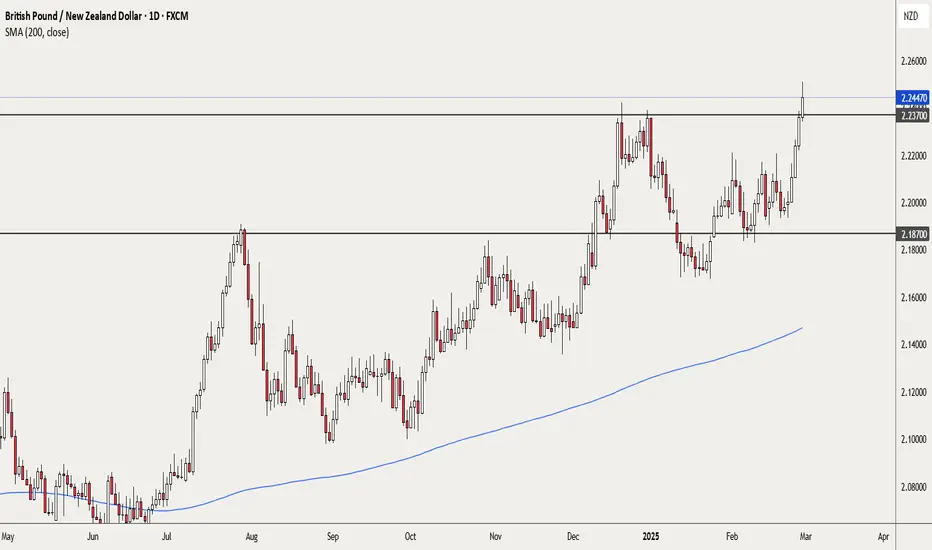
Daily – bullish, broke above previous highs already. Price above 200sma.
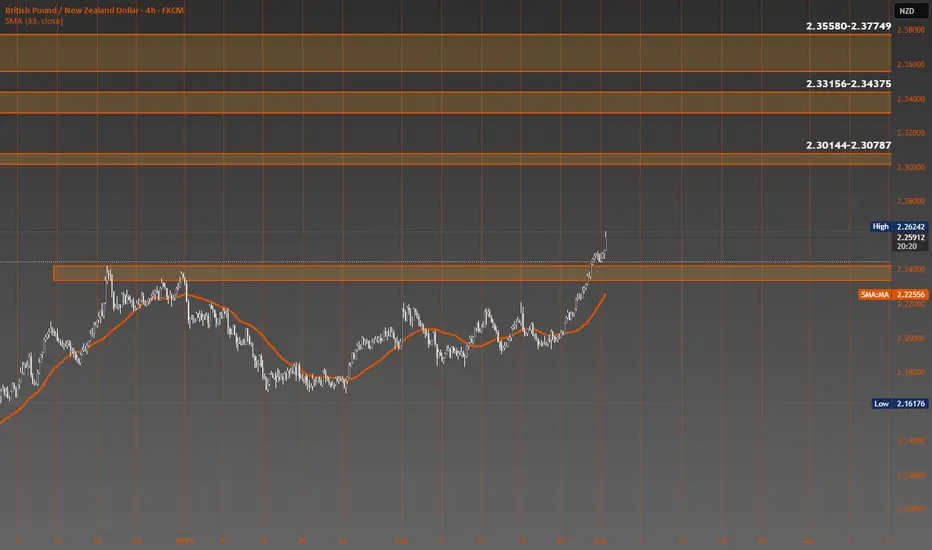
H4 – After the break out, price is pulling back. We have no idea where the pullback may terminate, but the support located around 2.2370 or preferably, the zone marked between 2.2212 – 2.21520 (or any other point in between) may hold price.
If there is no further pullback, I will not be interested in trading this pair for now. However, if price action develops as I anticipate, I will be looking for signs of a bullish continuation. My stop would be below the recent swing low and I will at first, target 2.2700 with the potential to extend much higher.
This is not a trade recommendation, merely my own analysis. Trading carries a high level of risk, so only trade with money you can afford to lose and carefully manage your capital and risk. If you like my idea, please give a “boost” and follow me to get even more. Please comment and share your thoughts too!!
It’s not whether you are right or wrong, but how much money you make when you are right and how much you lose when you are wrong – George Soros
GBPNZDWhy Stay Long?
📌 UK Strength:
GDP growth remains stable, showing resilience in economic activity.
Inflation concerns could keep the Bank of England from easing too soon, supporting GBP.
Industrial production and business sentiment remain positive.
📌 NZ Weakness:
Retail spending has been declining, signaling weaker consumer confidence.
Business PMI remains in contraction territory, showing economic slowdown.
The RBNZ's cautious stance suggests limited upside for NZD.
With these factors still in play, I’m holding the position and managing risk accordingly. Watching key resistance levels for an exit.
#Forex #GBPNZD #SwingTrading

pound quant zones thursday and possibly fridaypound's macro factors are bearish into march despite flow into pound due to being tariff neutral
already in hedge zone for momentum breakdown shorts, same for gbpcad, gbpusd, gbpaud
wicked tops for shorting
Check out our socials for some nice insights.
Let us know if there're any pair you like to see or if this is something you like.
Do ask if you have any question
Not as refined as our direct trade setups. More for advanced active traders.
information created and published doesn't constitute investment advice!
NOT financial advice

GBP/NDZ | down channel or trend line breakdown before 22.1k? on📉 GBP/NZD Price Forecast – Potential Reversal Ahead! 🚀
The GBP/NZD pair is currently moving within a down channel reversal pattern, signaling a potential shift in momentum. However traders should wait for a confirmed trendline breakdown before entering trades A breakdown before the 22,000 – 22,100 zone could provide a strong selling opportunity.
Key Levels to Watch:
✅ Entry Zone: 2.2000 – 2.2100
🎯 Target Points:
First Target: 2.1700
Second Target: 2.1500
Technical Analysis:
📊 The 50 EMA (Exponential Moving Average) is a crucial indicator in this setup. If the price continues to respect this dynamic resistance and breaks below the key trendline it could trigger a sharp downward move.
Trading Strategy & Risk Management:
⚠ Patience is key! Enter only when the trendline breaks and confirms bearish momentum.
📈 Set stop losses wisely to manage risk and protect capital.
🔍 Always analyze market conditions before making a trade.
🚀 Stay ahead of the market – Like Comment & Follow for real-time trade alerts, expert insights and more profitable setups!

GBP/NZD BEARISH BIAS RIGHT NOW| SHORT
Hello, Friends!
GBP/NZD pair is in the uptrend because previous week’s candle is green, while the price is obviously rising on the 3H timeframe. And after the retest of the resistance line above I believe we will see a move down towards the target below at 2.210 because the pair overbought due to its proximity to the upper BB band and a bearish correction is likely.
✅LIKE AND COMMENT MY IDEAS✅

GBPNZD: Bullish Pattern & Breakout 🇬🇧🇳🇿
GBPNZD formed a bullish accumulation pattern on a daily.
Its neckline was broken with a high momentum bullish candle yesterday.
The next strong resistance is 2.236.
It will most likely be the next goal for the buyers.
❤️Please, support my work with like, thank you!❤️

GBPNZD: Bullish Trend ContinuesThe violation of a significant daily resistance level has created additional upward potential for 📈GBPNZD on a daily basis.
Following a prolonged period of bullish accumulation within an ascending triangle pattern, the price rebounded yesterday and closed the daily candle above its neckline.
I believe that the market could soon reach the 2.2400 level.

gbpnzd analysis elliot. Don't forget about stop-loss.
Write in the comments all your questions and instruments analysis of which you want to see.
Friends, push the like button, write a comment, and share with your mates - that would be the best THANK YOU.
P.S. I personally will open entry if the price will show it according to my strategy.
Always make your analysis before a trade

BUY GBPNZD - Simple and logical Price Action!!Trader Tom, a technical analyst with over 16 years’ experience, explains his trade idea using price action and a top down approach. This is one of many trades so if you would like to see more then please follow us and hit the boost button.
We are proud to be an OFFICIAL Trading View partner so please support the channel by using the link below and unleash the power of trading view today!
www.tradingview.com

GBPNZD Is Bearish! Short!
Here is our detailed technical review for GBPNZD.
Time Frame: 2h
Current Trend: Bearish
Sentiment: Overbought (based on 7-period RSI)
Forecast: Bearish
The market is approaching a significant resistance area 2.217.
Due to the fact that we see a positive bearish reaction from the underlined area, I strongly believe that sellers will manage to push the price all the way down to 2.209 level.
P.S
Please, note that an oversold/overbought condition can last for a long time, and therefore being oversold/overbought doesn't mean a price rally will come soon, or at all.
Like and subscribe and comment my ideas if you enjoy them!

GBPNZD BUY SETUP📊 Execution Plan & Trade Strategy
📌 Ideal Trade Plan (If Price Retraces)
✅ Entry Zone: 2.2000 - 2.2020/30 (Bullish Order Block + Fair Value Gap)
✅ Stop Loss (SL): Below 2.1980 (Safe institutional level, avoiding stop hunts)
✅ Take Profits (TPs):
TP1: 2.2150 (Liquidity zone)
TP2: 2.2200 (Key Psychological level)
TP3: 2.2250 (Final BSL target)
✅ Trade Type: Intra-day / Trend Continuation
✅ Confidence Level: Medium to High – Strong confluences, but a retrace would be ideal for entry.

GBP-NZD Short From Resistance! Sell!
Hello,Traders!
GBP-NZD keeps growing
Just as I predicted in my
Previous analysis but the
Pair will soon hit a horizontal
Resistance of 2.222 from where
We will be expecting a local
Bearish correction
Buy!
Comment and subscribe to help us grow!
Check out other forecasts below too!

GBP/NZD’s Bullish Rounding Breakout: Targeting 2.2144 & 2.2202The pair appears to be forming a rounded bottom, suggesting a potential bullish continuation. After basing near the 2.1900–2.1950 zone, price has reclaimed key Fibonacci levels (38.2% and 50% retracements), indicating strong buying interest. A sustained break above the 0.786 Fib around 2.2039 sets the stage for an advance toward Expect Level 1 (2.2144) and eventually Expect Level 2 (2.2202). If buyers hold above these Fib supports, the bullish momentum is likely to continue, reinforcing the upside targets on the chart.

GBPNZD: Bearish Forecast & Bearish Scenario
The recent price action on the GBPNZD pair was keeping me on the fence, however, my bias is slowly but surely changing into the bearish one and I think we will see the price go down.
❤️ Please, support our work with like & comment! ❤️

GBP/NZD - Bullish flag and Ascending Channel formulating.Hi guys we are looking into GBP/NZD - You can see the chart the previous analysis that we did last week which was posted privetely in our community reaching its target, now we are looking into a possible bullish trend. Analysis did on 1H time frame.
As of February 24, 2025, the GBPNZD currency pair is exhibiting bullish momentum, with the current exchange rate at 2.20095 NZD, reflecting a 0.18% increase over the past 24 hours.
Technical Indicators Supporting Bullish Outlook:
Moving Averages: The pair is trading above key moving averages, including the 200-period EMA, indicating a strong uptrend.
Chart Patterns: An inverted cup and handle pattern has been identified on the hourly chart, suggesting potential upward movement.
Ichimoku Cloud: The Ichimoku Kinko Hyo Cloud analysis reveals an upward-moving cloud, adding to the long-term bullish sentiment
Entry: 2.20030
Target: 2.20950
SL: 2.19450

GBPNZD BUY SIGNALS ANALYSIS FROM MONTHLYTF TIL H4I tried breaking down this FX:GBPNZD buy setups from monthlytf till h4,
pls just take your time to watch the video so that you may understand what I'm up to.
Pls support my by boosting this post. Support me by doing the following as well. Thank you.
