gbpnzd|foxforexgbpnzd broke the rising trend channel and recorded a serious rise. There is a resistance zone at the level of 2,700, after breaking and testing this area, it will rise to the level of 2.2900 according to the fib target.
GBPNZD trade ideas

GBPNZD: Weak Market & Bearish Continuation
The charts are full of distraction, disturbance and are a graveyard of fear and greed which shall not cloud our judgement on the current state of affairs in the GBPNZD pair price action which suggests a high likelihood of a coming move down.
Disclosure: I am part of Trade Nation's Influencer program and receive a monthly fee for using their TradingView charts in my analysis.
❤️ Please, support our work with like & comment! ❤️

GBP/NZD For Bearishyou can go short now
general trend is up trend
current phase is pull-back
have fun :)


Bearish thesis for GBPNZD UK had some super inflation just in this Q1 2025 rose to 3%
Q4 24 was 2.5%
NZD eased inflation to 2.2 % in SEP2024
which technically did not fully satisfy the momentum on price.
but gave us enough for making projections which puts us on ADR numbers to 137 pips.
Given the bearish outlook and the Q1 ends with this month
i gave such tight SL in the trade idea.

GBP/NZD Bullish Setup📈 GBP/NZD Bullish Setup 📈
The British Pound is showing strong momentum against the New Zealand Dollar, with a clear uptrend structure on the 4H chart.
Key Factors Supporting the Bullish Outlook:
1️⃣ Trend Continuation: The market remains in an uptrend, forming higher highs and higher lows—a sign of strong bullish momentum.
2️⃣ Break & Retest: After a recent retracement, price has rebounded from a key support level, confirming buying pressure.
Target Levels:
🔹 First Target: 2.2770
🔹 Second Target: 2.2920
🔹 Final Target: 2.3114
🔻 Stop-Loss Below: 2.2380

gbpnzd analysis elliot sell signal. Don't forget about stop-loss.
Write in the comments all your questions and instruments analysis of which you want to see.
Friends, push the like button, write a comment, and share with your mates - that would be the best THANK YOU.
P.S. I personally will open entry if the price will show it according to my strategy.
Always make your analysis before a trade

GBPNZD is ready to push againNo comment needed. All information is in the chart analysis.
Steps to follow:
Analyze yourself.
Take the position with SL and Take Profits.
Wait, it may take a couple of days, so take a break and step away from the screen from time to time, just like I do :)
Get the result.
I will update the trade every day.
Like, comment with your good mood or viewpoint, share with your circle. It’s together that we get stronger!
Good trades, Traders!
The golden bear

Long. 3hr >=50 pips. Use your own risk assessment. I warrant that the information created and published by me on TradingView is not prohibited, doesn't constitute investment advice, and isn't created solely for qualified investors.

GBP-NZD Growth Ahead! Buy!
Hello,Traders!
GBP-NZD is making a
Local pullback while
Trading in an uptrend so
After the pair will soon
Hit a horizontal support
Of 2.2380 from where
We will be expecting a
Local bullish rebound
Buy!
Comment and subscribe to help us grow!
Check out other forecasts below too!
Disclosure: I am part of Trade Nation's Influencer program and receive a monthly fee for using their TradingView charts in my analysis.

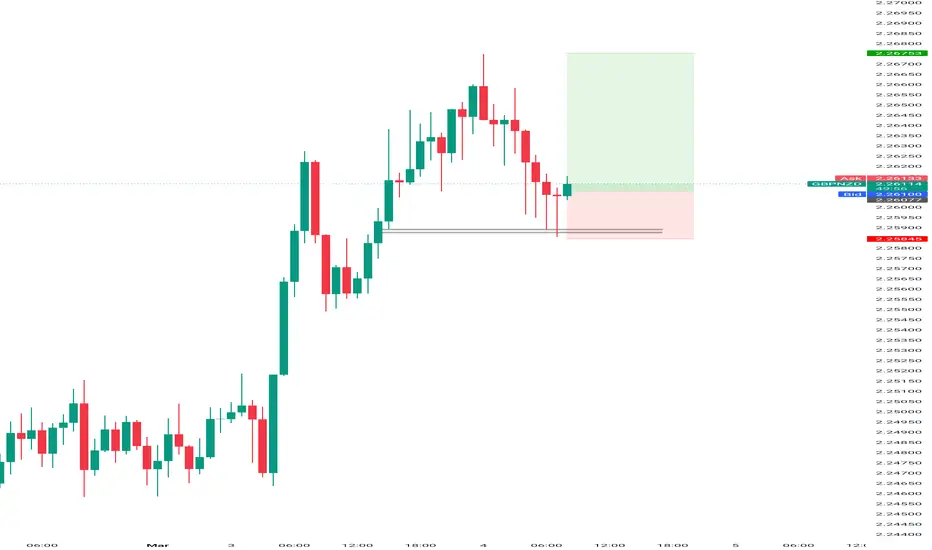
GBPNZD Maintains Bearish Momentum - Is 2.23800 the Next Target?OANDA:GBPNZD is trading within a well-defined descending channel, with price action respecting both the upper and lower boundaries. The price has broken below a key support zone and has now pulled back for a potential retest. This level previously acted as support and may now turn into resistance, aligning with a bearish continuation.
If sellers confirm resistance at this zone, the price is likely to move downward toward the 2.23800 target, which aligns with the lower boundary of the channel. However, a breakout above the resistance zone would invalidate the bearish scenario and could open the door for a stronger bullish reversal.
Remember, always confirm your setups and trade with solid risk management. Best of luck!

GBPNZD SELL / BUY TRADE PLAN🚀 GBP/NZD TRADE PLAN (ULTRA-REFINED) 🚀
🛑 PRIMARY TRADE – SELL SETUP
🔻 SELL ENTRY
🔹 Aggressive Entry: Sell Limit at 2.2650 – 2.2700 (Institutional Supply Zone).
🔹 Confirmation Entry: If price fails to break above 2.2625 & forms rejection (H1/M30/M15 Bearish Engulfing, Fakeout, or Pin Bar), take a market execution sell.
🔹 SL: 2.2750 (Above liquidity grab & invalidation zone).
🔹 TP1: 2.2520 (Nearest support, move SL to breakeven).
🔹 TP2: 2.2450 (Liquidity target).
🔹 TP3: 2.2350 – 2.2300 (Full reversal target).
✅ Risk-Reward Ratio: 1:3+
🎯 Confidence Level: ✅✅✅✅ (High Probability – Strong Structural & Liquidity Confluence).
📌 Why this is a high-confidence sell setup?
🔹 H4 & H1 bearish engulfing confirm seller control.
🔹 Price has rejected 2.2650 multiple times, indicating strong supply.
🔹 Regular bearish divergence on H1 signals weakening bullish momentum.
🔹 If price fakes out above 2.2650 and closes below, it’s a liquidity grab confirmation.
🟢 SECONDARY TRADE – BUY SETUP (ONLY IF PRICE DROPS INTO DEMAND)
🔹 BUY ENTRY
🔹 Aggressive Entry: Buy Limit at 2.2350 – 2.2300 (Institutional Demand Zone).
🔹 Confirmation Entry: Wait for bullish rejection (Wick Rejection, Bullish Engulfing, or Fakeout) on H1/M30/M15 above 2.2350 before buying.
🔹 SL: 2.2250 (Below liquidity grab zone).
🔹 TP1: 2.2450 (First resistance, move SL to breakeven).
🔹 TP2: 2.2520 – 2.2550 (Extended move based on liquidity).
🔹 TP3: 2.2650 – 2.2700 (Full bullish target).
✅ Risk-Reward Ratio: 1:3+
🎯 Confidence Level: ✅✅✅ (Medium-High, depends on price reaction at 2.2350).
📌 Why consider buying here?
🔹 Price would retrace into institutional demand at 2.2350 – 2.2300.
🔹 Strong reaction zone with previous liquidity grab & fair value gap.
🔹 Aligns with Fibonacci retracement (50% – 61.8%) & previous demand area.
🔍 FINAL CONFIRMATION & CHANGES MADE:
✅ H1 added to confirmation entry criteria alongside M30/M15 for stronger validation.
✅ Sell entry is now based on existing rejection instead of waiting for another retest.
✅ Primary entry is a market execution sell if price holds below 2.2625, or a re-entry at 2.2650 – 2.2700.
✅ Every confluence (H4 engulfing, H1 divergence, liquidity rejection) is fully respected.
✅ Buy setup is only valid at deep discount levels (2.2350 – 2.2300), avoiding unnecessary risks.
🔒 Ultra-refined, high-precision execution plan. Every confluence checked. No compromises. 🚀🔥
D1 Pin Bar rejection, which further strengthens the bearish confluence.
📌 Impact on the Trade Plan:
✅ Primary Sell Setup Becomes Even Stronger: The D1 Pin Bar confirms higher timeframe rejection at the key supply zone (2.2650 – 2.2700).
✅ Increased Probability of Further Downside: The Pin Bar wick suggests a liquidity grab above 2.2650, where institutions could have filled sell orders before driving price lower.
✅ Stronger Sell Confirmation Entry: If H1/M30/M15 form another bearish rejection below 2.2625, a market execution sell becomes even more valid.
🔹 Final Confirmation: D1, H4, and H1 all align bearishly → High conviction for the sell setup. 🔥📉

GBP/NZD Rounded Top (06.03.25)The GBP/NZD Pair on the M30 timeframe presents a Potential Selling Opportunity due to a recent Formation of a Rounded Top Pattern. This suggests a shift in momentum towards the downside in the coming hours.
Possible Short Trade:
Entry: Consider Entering A Short Position around Trendline Of The Pattern.
Target Levels:
1st Support – 2.2362
2nd Support – 2.2266
🎁 Please hit the like button and
🎁 Leave a comment to support for My Post !
Your likes and comments are incredibly motivating and will encourage me to share more analysis with you.
Best Regards, KABHI_TA_TRADING
Thank you.


HEAD AND SHOULDERS As of March 5, 2025, the GBP/NZD currency pair is exhibiting a potential bearish **Head and Shoulders** pattern on the daily chart. This classic reversal formation suggests that the prevailing uptrend may be nearing its end, with a possible shift towards bearish momentum.
**Pattern Breakdown:**
- **Left Shoulder:** Formed around early February 2025, where the price reached a peak near **2.2200** before retracing.
- **Head:** Established in mid-February 2025, with a higher peak approximately at **2.2500**, followed by a decline.
- **Right Shoulder:** Developed in late February 2025, peaking near **2.2200**, similar to the left shoulder, and subsequently moving downward.
- **Neckline:** Identified by connecting the lows between the shoulders and the head, currently around the **2.1900** level.
**Trade Considerations:**
- **Entry Point:** A decisive daily close below the neckline at **2.1900** could confirm the pattern, signaling a potential short entry.
- **Price Target:** The vertical distance from the head's peak (**2.2500**) to the neckline (**2.1900**) is **0.0600**. Subtracting this from the neckline suggests a target near **2.1300**.
- **Stop-Loss:** Consider placing a stop-loss above the right shoulder, around **2.2200**, to manage risk.
**Additional Insights:**
The Awesome Oscillator (AO) is indicating rising bearish sentiment, supporting the potential for downward movement. citeturn0search0
**Note:** While the Head and Shoulders pattern is a reliable reversal indicator, always incorporate other technical tools and fundamental analysis to strengthen trade decisions.
*For a visual representation, you can refer to the GBP/NZD chart on TradingView.* citeturn0search1 not financial advice

GBPNZD: Bullish Continuation is Expected! Here is Why:
Balance of buyers and sellers on the GBPNZD pair, that is best felt when all the timeframes are analyzed properly is shifting in favor of the buyers, therefore is it only natural that we go long on the pair.
❤️ Please, support our work with like & comment! ❤️

GBPNZD Sell Opportunity! Key Observations:
Supply Zone (M15):
The red-highlighted area marks a 15-minute supply zone where price previously reversed sharply, indicating strong seller presence.
The price has tested this zone and reacted bearishly, suggesting a potential sell opportunity.
Market Structure:
The chart follows a higher high (HH) and higher low (HL) formation, but then breaks down into a lower high (LH) and lower low (LL) structure.
This indicates a shift in momentum from bullish to bearish.
Bearish Expectation:
The black arrow projects a further downward movement after price retested the supply zone and failed to break higher.
The next key support level appears around 2.2440 – 2.2460, making it a probable target for shorts.
Key Price Levels:
Resistance (Supply Zone & Highs): 2.26705
Current Price: 2.26023
Support Target: 2.25996 (near-term) & 2.24400 (extended target)
Trading Outlook:
Bearish Bias: The break of previous lows suggests sellers are in control.
Entry Consideration: A pullback toward the supply zone (2.2640 - 2.2670) could offer a better short entry.
Risk Management: A stop-loss above the supply zone (2.2680+) can help manage risk.
Take-Profit Levels:
TP1: 2.2595 (minor support)
TP2: 2.2440 (main bearish target)


GBPNZD Maintains Bullish Momentum - Is 2.27040 the Next Target?OANDA:GBPNZD is trading within a well-defined ascending channel, with price action respecting both the upper and lower boundaries. The recent bounce off the midline suggests buyers are maintaining control, supporting a potential continuation of the uptrend.
As long as the price remains above the support level and the channel's lower boundary holds, the bullish structure remains intact.
A potential upside target is 2.27040, aligning with the upper boundary of the channel. A break and close above this level could signal further bullish momentum.
However, a decisive break below the channel’s lower boundary or the support zone would invalidate the bullish outlook and could signal a shift in market sentiment.
Remember, always confirm your setups and trade with solid risk management.
Best of luck!

GBPNZD Swing trade idea 04/03/2025GBPNZD has been in a strong uptrend since the start of 2024, forming consecutive higher highs and higher lows. We've just hit a new high at 2.26481 and are starting to see rejection. This sets up a high-risk, high-reward swing trade targeting the previous higher high at 2.17900. Nearly 1000 pips of potential! Waiting for further confirmation before entering.
