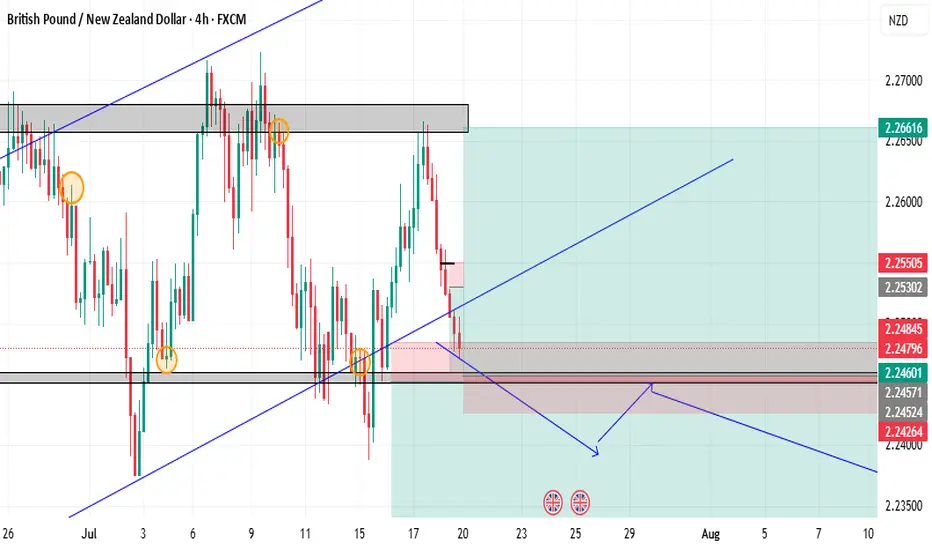
GBPNZD SELL IDEAPrice is currently forming an Ascending channel on the Daily chart.
Current trend - Downtrend with price approaching a major support after recently forming a lower high. A break and close of the candle below the support level on the daily chart and retest on lower Tfs would be confirmation of a downtrend, formation of a lower low, and entry for a sell.
Meanwhile, if the support is respected, I'll be on the lookout for a double bottom and formation of a higher low for entries to the next resistance.
GBPNZD trade ideas

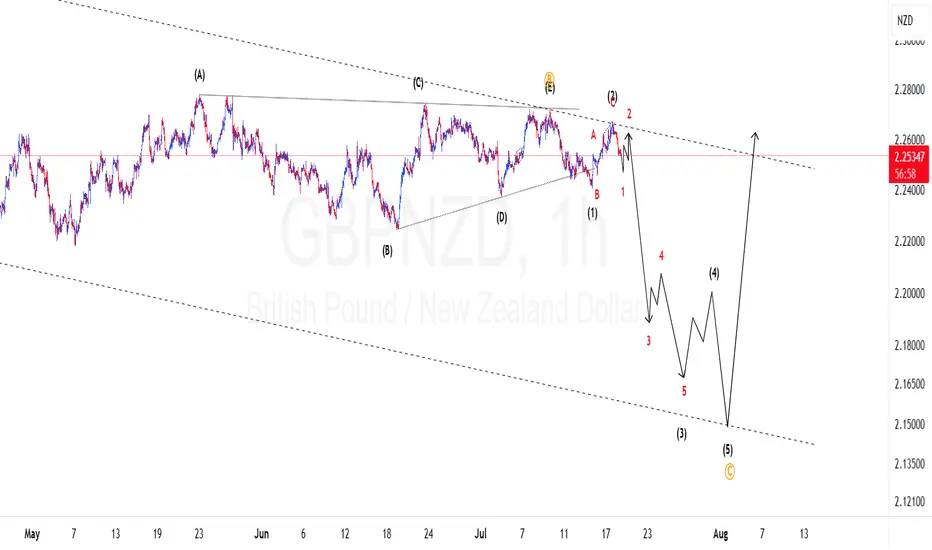
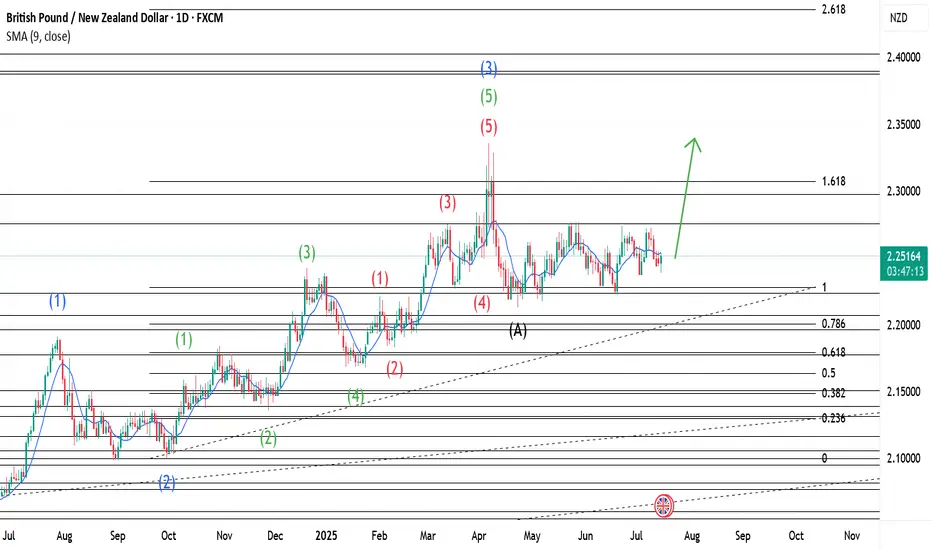
GBPNZD Elliotwaves update: Are Bears still on control?We have been on this in the past two weeks and now we can see clear signs of bears controlling the price. We had a triangle correction completed and made an impulsive wave to the downside which confirmed our bias. Now are are on the first wave of wave 3 and we should anticipate momentum to the downside to increase. To take advantage of the drop one should find areas where price might find resistance and other confluences like Fibonacci to take a trade.
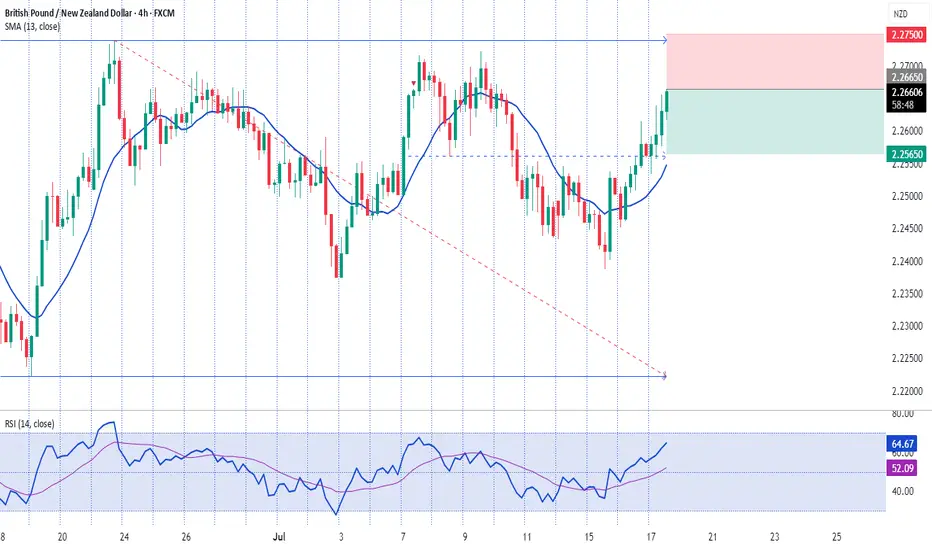
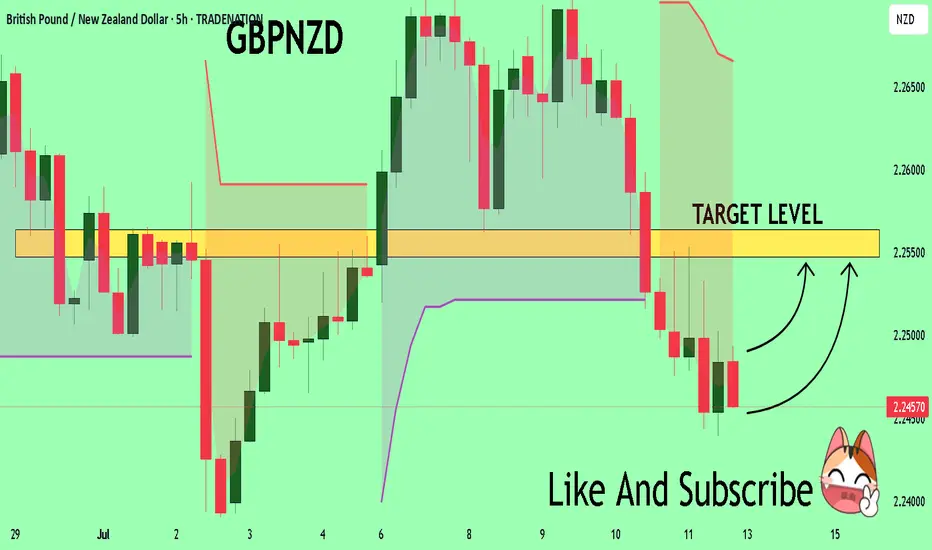
GBPNZD Is Bullish! Buy!
Here is our detailed technical review for GBPNZD.
Time Frame: 2h
Current Trend: Bullish
Sentiment: Oversold (based on 7-period RSI)
Forecast: Bullish
The market is approaching a significant support area 2.254.
The underlined horizontal cluster clearly indicates a highly probable bullish movement with target 2.262 level.
P.S
We determine oversold/overbought condition with RSI indicator.
When it drops below 30 - the market is considered to be oversold.
When it bounces above 70 - the market is considered to be overbought.
Disclosure: I am part of Trade Nation's Influencer program and receive a monthly fee for using their TradingView charts in my analysis.
Like and subscribe and comment my ideas if you enjoy them!

GBPNZD TRADE Gbpnzd trade tapped us in and has moved... We seem to want to finally move to the target

GBP/NZD Made Inverted H&S Pattern ,Time To Buy And Get 150 PipsHere is my 4H Chart On GBP/NZD , The price created a very clear reversal pattern ( inverted head and shoulders pattern ) and the price closed above neckline so the pattern confirmed and we can buy it and targeting from 100: 200 pips , if we have a daily closure above 2.25600 it will be a great confirmation telling us the price will continue to upside .

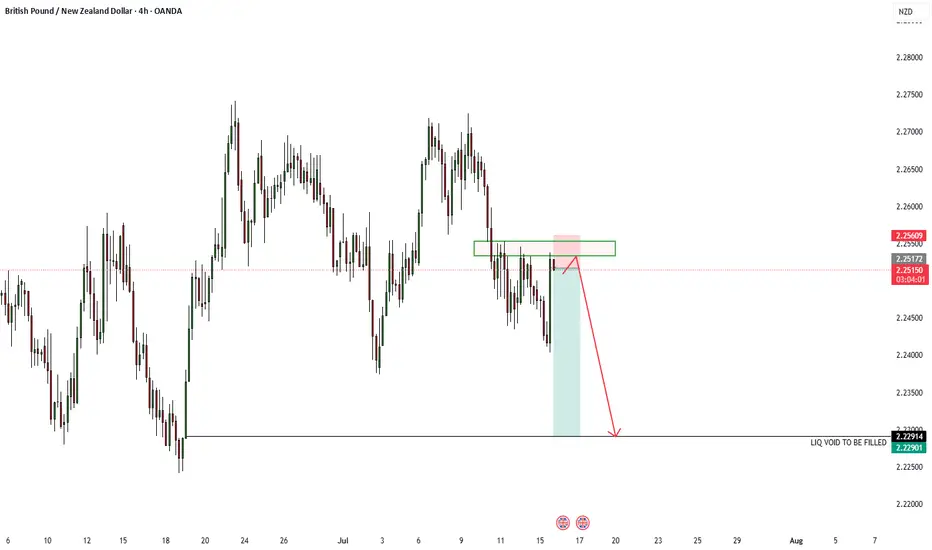
GBPNZD 1:5 R Trade Idea - ICT1:5 R GBPNZD - Bearish on the pair, entry off the 4HR fvg to aim for the fill of the liq void.
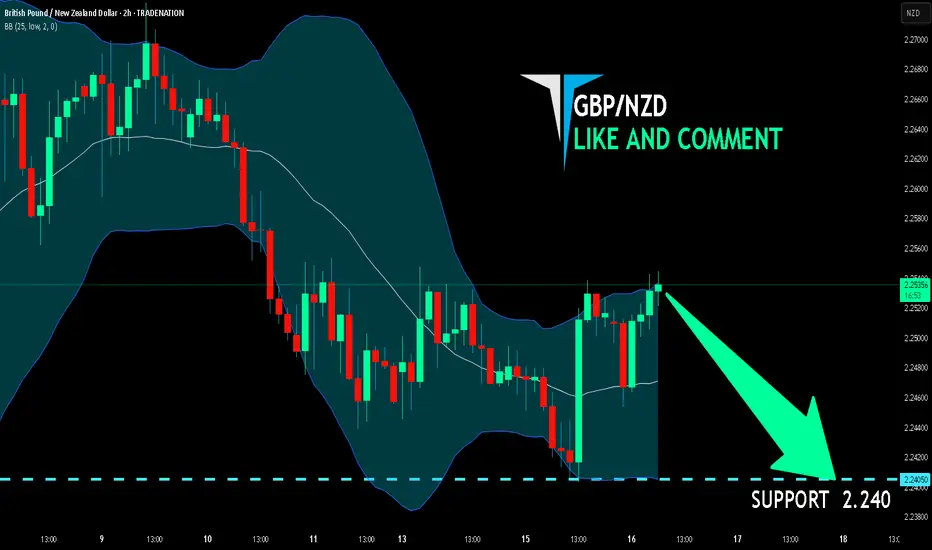
GBP/NZD BEST PLACE TO SELL FROM|SHORT
Hello, Friends!
It makes sense for us to go short on GBP/NZD right now from the resistance line above with the target of 2.240 because of the confluence of the two strong factors which are the general downtrend on the previous 1W candle and the overbought situation on the lower TF determined by it’s proximity to the upper BB band.
Disclosure: I am part of Trade Nation's Influencer program and receive a monthly fee for using their TradingView charts in my analysis.
✅LIKE AND COMMENT MY IDEAS✅
16.07.25 Morning ForecastPairs on Watch -
FX:GBPJPY
FX:GBPNZD
FX:USDJPY
A short overview of the instruments I am looking at for today, multi-timeframe analysis down to what I will be looking at for an entry. Enjoy!

GBPNZD and Elliott Wave PrinciplesWave 2(Blue) was a Zigzag and we should expect a Flat for Wave 4(Blue). After Wave 3(Blue) completes, a lunge to the downside occurs and this is our Wave A of the Flat. We are on the Wave B(Black) of a Flat as Wave A(Black) has already completed. Our Wave B(Black) should go beyond the end of Wave 3(Blue) since it is a Flat.
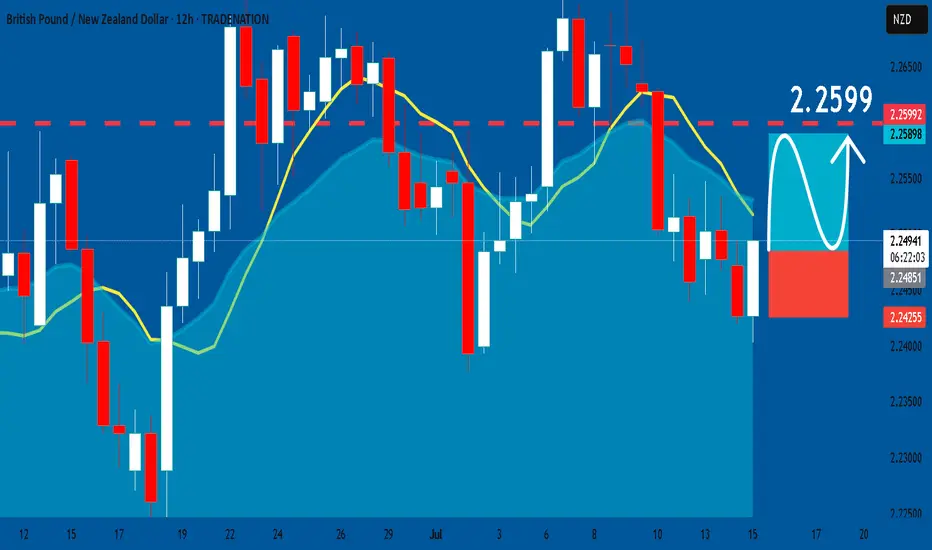
GBPNZD: Long Trade Explained
GBPNZD
- Classic bullish formation
- Our team expects pullback
SUGGESTED TRADE:
Swing Trade
Long GBPNZD
Entry - 2.2484
Sl - 2.2425
Tp - 2.2599
Our Risk - 1%
Start protection of your profits from lower levels
Disclosure: I am part of Trade Nation's Influencer program and receive a monthly fee for using their TradingView charts in my analysis.
❤️ Please, support our work with like & comment! ❤️
BUY GBPNZDFalling channel pattern at play here on GBPNZD. Two main target areas at 2,253 and 2,258.
Let us see if it would break further up

GBPNZD What Next? BUY!
My dear friends,
My technical analysis for GBPNZDis below:
The market is trading on 2.2457 pivot level.
Bias - Bullish
Technical Indicators: Both Super Trend & Pivot HL indicate a highly probable Bullish continuation.
Target - 2.2547
About Used Indicators:
A pivot point is a technical analysis indicator, or calculations, used to determine the overall trend of the market over different time frames.
Disclosure: I am part of Trade Nation's Influencer program and receive a monthly fee for using their TradingView charts in my analysis.
———————————
WISH YOU ALL LUCK
GBPNZD – Waiting for Price to Reach the ZoneWe’re currently waiting for price to reach our key level.
Once it does, and we see a valid buy signal, we’ll enter a long position.
🔄 All scenarios remain active.
Those who follow my analyses regularly already know the flow —
so no need to repeat the full breakdown.
As always, we don’t predict – we react to price.
We’re not here to guess what the market will do,
we’re here to manage our risk and trade what we see.

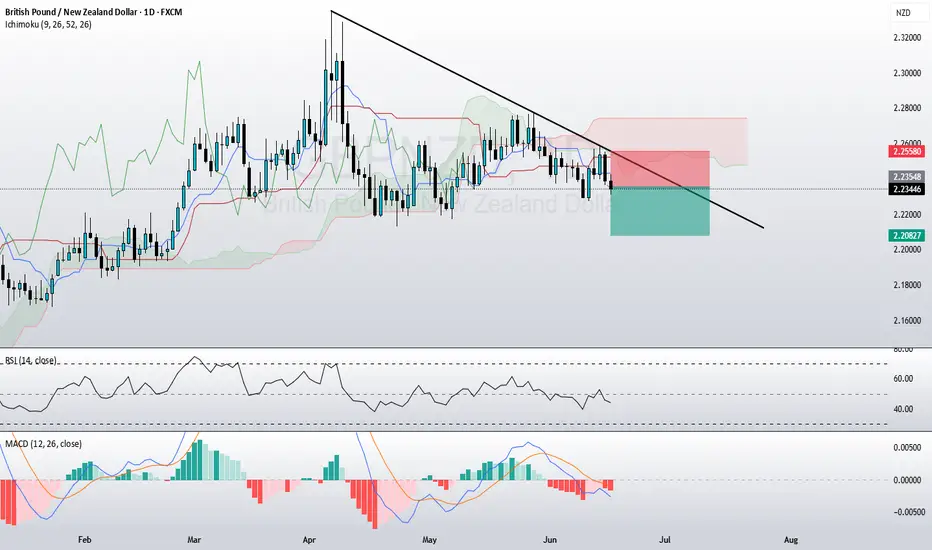
GBPNZD SHORT (swing idea)This is a very good short trade setup. The price is trading below the Ichimoku cloud, as well as the 50-day and 100-day moving averages. The bearish momentum is confirmed by the downward trendline, the MACD being below zero (indicating bearish sentiment), and the RSI, which is also below 50.
Long gbpnzdIn my previous analysis, we longed Gbpnzd but after 50pips in profits, it retraced and it hit sl. I belive daily candle will end as bullish today. We can buy with today's low as sl

GBP/NZD: The Great Liquidity Grab? (Long Trade Plan)"🏦💰 GBP/NZD BANK VAULT RAID: Bullish Heist in Progress! (Long Setup) 💰🏦
🚨 Overbought Trap? Or Trend Continuation? Here’s How to Loot Pips Safely! 🚨
🦸♂️ GREETINGS, MARKET MARAUDERS!
To all the Profit Pirates & Risk-Takers! 🌍💸
Using our 🔥Thief Trading Tactics🔥 (a ruthless combo of price action + liquidity grabs + macro triggers), we’re executing a bullish heist on GBP/NZD ("Sterling vs Kiwi")—this is not advice, just a strategic raid blueprint for those who trade like outlaws.
📈 THE HEIST PLAN (LONG ENTRY FOCUS)
🎯 Profit Zone: 2.28700 (or escape earlier if momentum stalls)
💥 High-Stakes Play: Overbought but squeezing higher—trap for bears.
🕵️♂️ Trap Spot: Where sellers get liquidated.
🔑 ENTRY RULES:
"The Vault’s Open!" – Swipe bullish loot on pullbacks (15-30min TF).
Buy Limit Orders near swing lows for better risk/reward.
Aggressive? Enter at market—but tighter stops.
📌 SET ALERTS! Don’t miss the breakout retest.
🛑 STOP LOSS (Escape Route):
Thief SL at recent swing low (2H timeframe).
⚠️ Warning: "Ignore this SL? Enjoy donating to the market."
🎯 TARGETS:
Main Take-Profit: 2.28700 (or trail partials).
Scalpers: Ride long waves only. Trailing SL = VIP exit pass.
📡 FUNDAMENTAL BACKUP (Why This Heist Works)
Before raiding, check:
✅ COT Data (Are funds long GBP/short NZD?)
✅ Rate Spreads (GBP vs NZD yield shifts)
✅ Commodity Correlations (Dairy prices? Risk mood?)
✅ Sentiment Extreme (Retail over-shorting?)
🚨 NEWS RISK ALERT
Avoid new trades during RBNZ/BOE speeches (unless you like volatility casinos).
Trailing stops = your bulletproof vest.
💣 BOOST THIS HEIST!
👍 Smash Like to fuel our next raid!
🔁 Share to recruit more trading bandits!
🤑 See you at the target, rebels!
⚖️ DISCLAIMER: Hypothetical scenario. Trade at your own risk.
#Forex #GBPNZD #TradingView #LiquidityGrab #TrendContinuation #ThiefTrading
💬 COMMENT: "Long already—or waiting for a deeper pullback?" 👇🔥

GBPNZD SELL IDEA- Weekly chart - Ranging market with price forming a double top before falling from the resistance.
- Daily chart - Ranging market with strong bearish fall. Price didn't respect the bullish trendline as well.
- H4 chart - Price is forming a series of LHs and LLs and currently testing a minor support level for further fall.
Entry would be close below the minor support level on H4 and retest on H1 and M30. This pair runs like thieves, so be observant, or you'd miss out on this clean trade

GN will go down to value area lowBeen missed out trade on this one. I can only sell whenever retraces, target at value area low

GBPNZD TRADE Based on trade management techniques/systems put in place, you still get to follow the move to the upside and then avoid any losses. Incase something like this occurs.
A similar thing also occurred on GBPAUD.

GBPNZD Is Bearish! Sell!
Please, check our technical outlook for GBPNZD.
Time Frame: 1h
Current Trend: Bearish
Sentiment: Overbought (based on 7-period RSI)
Forecast: Bearish
The market is approaching a key horizontal level 2.248.
Considering the today's price action, probabilities will be high to see a movement to 2.241.
P.S
Overbought describes a period of time where there has been a significant and consistent upward move in price over a period of time without much pullback.
Disclosure: I am part of Trade Nation's Influencer program and receive a monthly fee for using their TradingView charts in my analysis.
Like and subscribe and comment my ideas if you enjoy them!

GBP/NZD – Bearish Continuation Setup in Play
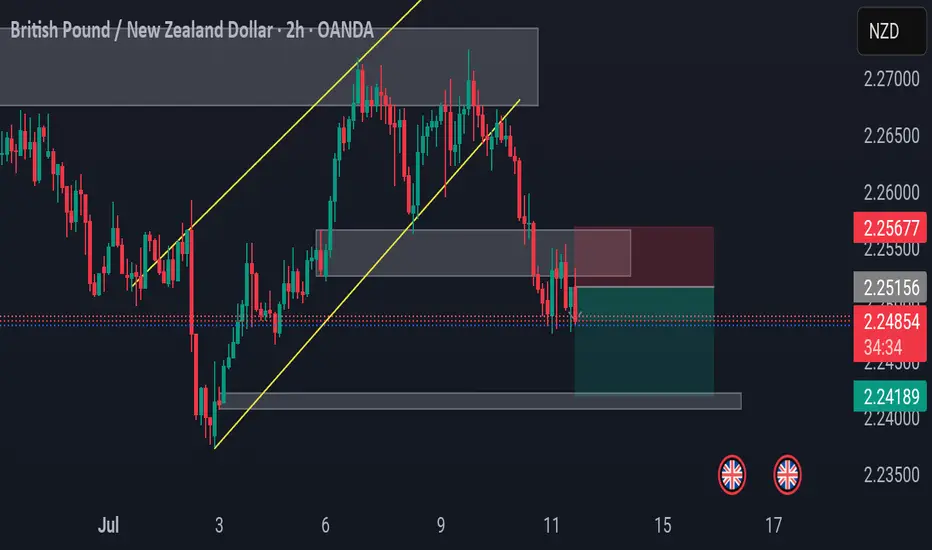
🔹 2H Chart Analysis by PULSETRADESFX
The recent structure break on GBP/NZD confirms bearish momentum, with price decisively rejecting the prior bullish channel (marked in yellow). After retesting the broken support zone (now acting as resistance), a clean supply zone formed around 2.25156 – 2.25677, where price has started to stall.
📌 Trade Setup:
Entry: 2.24902
SL: 2.25677 (Above supply)
TP: 2.24189 (Next demand zone)
This aligns with the overall trend shift as buyers failed to hold the previous structure. Expecting further downside toward the next demand zone unless bulls reclaim above 2.25677 with strong momentum.
---
✅ Confluence Highlights:
Break and retest of bullish channel
Supply zone confirmation
Bearish engulfing structure at resistance
Favorable risk-to-reward setup
📅 July 11, 2025
📊 Executed on: TradingView | OANDA Feed
#GBPNZD #Forex #PriceAction #SupplyDemand #BearishSetup #TradingView