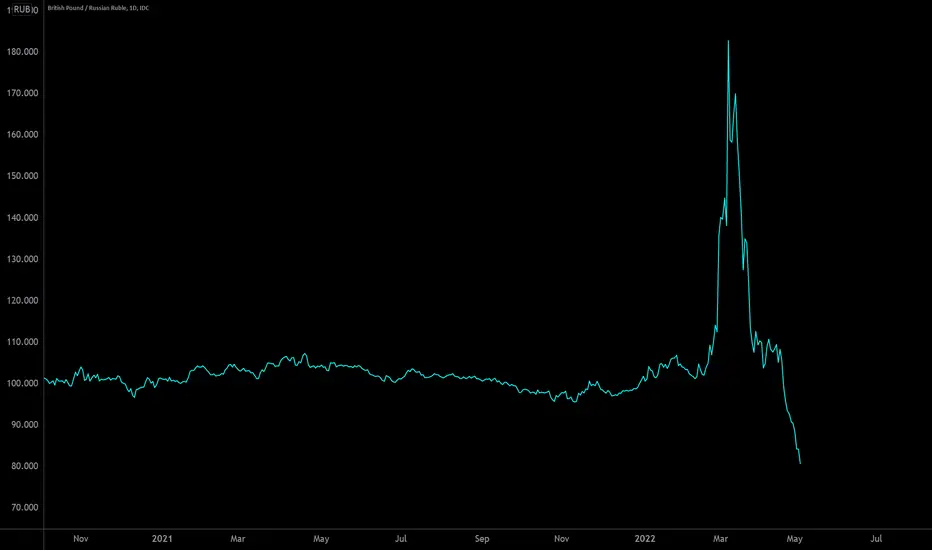
Who is winning?Or better: Who is really getting punished by the sanctions imposed on Russia? If there is a more dramatic picture about the self-destructive effect the measures have, let me know.
GBPRUB trade ideas


RidetheMacro| GBPRUB More Upside Growth !Trade Analysis Based on Fundamentals and Price Action.
With Risk Management you Will Never loss.
All Comments and Ideas will Appreciated.
Thank You

RidetheMacro| GBPRUB Russia on Track Again!A "no-deal" Brexit could be three times more costly to Britain's economy in the long term than the coronavirus outbreak, a new study published Tuesday warned.the political and economic effects of the pandemic were likely to mitigate or hide that of failing to secure a trade agreement with the EU.
📌 But in the short term, the lack of a new formal trading relationship with Brussels would be bad news for economic recovery and larger than the health crisis in the long term.The think-tank, which collaborated with the London School of Economics, said Brexit would hit growth in the coming years more than if the UK had opted to remain in the bloc.
📍 "The claim that the economic impacts of Covid-19 dwarf those of Brexit is almost certainly correct in the short term," its authors wrote.
"Not even the most pessimistic scenarios suggest that a no-deal Brexit would lead to a fall in output comparable to that seen in the second quarter of 2020.
📍 "However -- assuming a reasonably strong recovery, and that government policies succeed in avoiding persistent mass unemployment -- in the long run, Brexit is likely to be more significant.
🔑 the UK’s recovery from the Covid-19 lockdown was losing momentum even before the announcement of new restrictions to control the spread of the virus, the latest snapshot of the economy has found.
📍 The closely watched monthly estimates from Cips/Markit found the level of activity at its lowest since June, the outlook for business at its weakest since May and jobs being shed at a rapid rate.
The Cips/Markit report flash estimate of the service and manufacturing sectors dipped from 59.1 in August to 55.7 in September. but the survey was conducted before the introduction of fresh curbs across the UK this week.
The marked dip in the PMI prompted speculation among City analysts that the UK could be heading for a tough end to 2020.
📍 The study estimated that the negative impact on gross domestic product would be 5.7 percent over the next 15 years compared with the current level, while GDP was forecast to take a 2.1-percent hit from Covid-19.
The projections come despite a lack of clarity about the overall repercussions from the pandemic, and as a second wave of infections hits Europe.
📌 For RUB
🔑 The Salary growth numbers for July (this data comes with additional lag) significantly outperformed expectations, posting a 2.3% YoY jump in real terms after a 0.6% YoY increase in June. Though this data is more relevant to the larger businesses and state sector, and the situation in the SME sector could be different, other sources of income were likely supportive as well: the budget fulfillment data for 8M20 point at continued acceleration of spending on pensions and social security.
🔑 the earlier estimates for retail trade for April-July have been improved by 0.6-0.7ppt YoY, including from -2.6% YoY to -1.9% YoY in July, suggesting that the drop in smaller businesses was not as deep as expected.
Until the Next Time.🙏
Ridethemacro


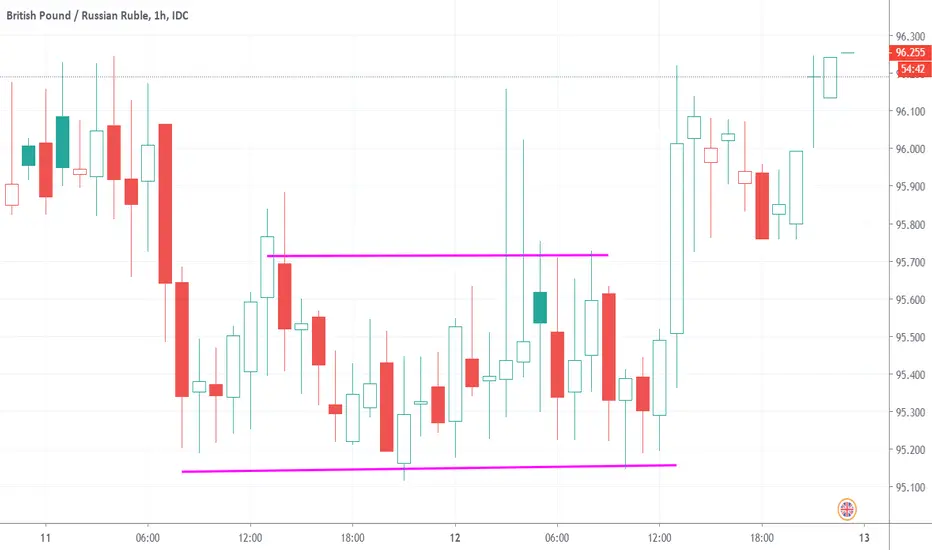
GBPRUB, Rectangle Bottom (bullish)STATUS = Confirmed
CURRENT CONFIDENCE = 5%
TARGET (EXIT) PRICE = 96.239253 RUB
BREAKOUT (ENTRY) PRICE = 95.780055 RUB
DISTANCE TO TARGET PRICE = 0.02% (2.2 pips)
EMERGED ON Aug 12, 06:00 AM (UTC)
CONFIRMED ON Aug 12, 01:14 PM (UTC)
WITH CONFIDENCE LEVEL = 73%
I found this pattern at tickeron website with the following data:
The Rectangle Bottom pattern forms when the price of a pair is stuck in a range bound motion. Two horizontal lines (1, 3, 5) and (2, 4) form the pattern as the pair bounces up and down between support and resistance levels. Depending on who gives up first buyers or sellers the price can breakout in either direction.
This pattern is commonly associated with directionless markets. Usually the pattern performs better when there is a strong downtrend leading into the formation.
Trade idea
If the price breaks out from the top pattern boundary, day traders and swing traders should trade with an UP trend. Consider buying a pair or a call option at the breakout price level. To identify an exit, compute the target price level by adding the pattern height (which is the distance between the horizontal lines) to the breakout price.
To limit potential loss when price suddenly goes in the wrong direction, consider placing a stop order to sell at or below the breakout price.
GBPRUB, Triple Bottoms (bullish)STATUS = Confirmed
CURRENT CONFIDENCE = 63%
TARGET (EXIT) PRICE = 90.449193 RUB
BREAKOUT (ENTRY) PRICE = 90.079150 RUB
DISTANCE TO TARGET PRICE = 0.18% (16.0 pips)
EMERGED ON Jul 17, 12:00 PM (UTC)
CONFIRMED ON Jul 17, 02:51 PM (UTC)
WITH CONFIDENCE LEVEL = 70%
Tickeron AI shows that the Triple Bottom pattern appears when there are three distinct low points (1, 3, 5) that represent a consistent support level. The pair tests the support level over time but eventually breaks resistance and makes a strong move to the upside.
This type of formation happens when sellers can not break the support price, and market participants eventually pour in.
Trade idea
Once the price breaks out from the top pattern boundary, day traders and swing traders should trade with an UP trend. Consider buying a pair or a call option at the breakout price level. To identify an exit, compute the target price by adding the pattern’s height (highest price minus the bottom price support level) to the breakout level the highest high. When trading, wait for the confirmation move, which is when the price rises above the breakout level.
To limit potential loss when price suddenly goes in the wrong direction, consider placing a stop order to sell at or below the breakout pricet

GBPRUB's in Uptrend: MACD Histogram crosses above signal lineThis is a Bullish indicator signaling GBPRUB's price could rise. Traders may explore going long on the ticker or buying call options. Tickeron AI shows that
in 58 of 83 cases where GBPRUB's MACD histogram became positive, the price rose further within the following month. The odds of a continued Uptrend are 70%.

GBPRUB D1The British economy, after a long Brexit procedure and a drop in the value of the currency, began a successful recovery. A number of productive measures have yielded good results. The Russian economy, after a successful last year, made a huge collapse. This was influenced by a series of events related to new sanctions, a change in power and constitution, the corono virus and a drop in oil prices. Recently, the Russian ruble has fallen significantly in price, but this is not the limit. The combination of negative factors will lead the ruble to even greater decline.

#GBPRUBYellow zones are important and strong
The green areas are Target
Time range specified
Support and resistance are identified
Look at trend lines and patterns

GBPRUB - 240 - Wait for the breakThe chart is pretty much straight forward.
Please see the levels and targets.
Don't forget your stop-loss.

GBPJPY will increase (68% to increase)It will increase because it went up for 3 times and as i looked at it before it went up more than 4 times in a row so i guess that it will go up a bit and go back down after


It will go down.It will go down because it cant go 2 times up in 12 hours + to the max so because of that it will eventually go down.

Move to the upside...The GBPRUB is really easy trading. Basically if it goes down max, like if u think that it goes down to the max that means that it will definitely will go upside but... but it can also go down because u need to always look at 30-1 min and understand which way it will go. About this trade I will say that it will go up because it was at same place for more then 24+ hours and it can't go down... maybe it will but it have small chances to go down... I am not sure... But still it will probably go up... Yeah...

GBPRUB - 240 - Short-term ideaTrade Alert
Keep a close eye on the potential breakout area at around 85.39. If the pair makes a run for it and we see that break, this may clear the path towards slightly higher levels. Because the RUB had already a good run against its top world rivals, we can see that the pair struggled to drop below the support area around the 84.80 mark.
Ignore the idea, if the rate falls below the 84.80 hurdle.
Please see the chart for levels.
Don't forget your stop-loss.


USDRUB - 240 - Time to pop?Trade Alert
Potentially building up for a pop.
If the 82.90 breaks and we get a close above that level on the 240-minute chart, then we could be on to something here, where we could aim for the 83.85 zone, as the next potential area of resistance.
Alternatively, if this reverses back down and moves below the tentative upside support line, then we can leave this idea for now.
Always have your SL in place.

GBPRUB - Daily - Is this flagging out or what?Trade Alert.
This pair is currently forming something from textbook, that is called a flag. Now, theoretically, we could see a move to the upside later on, once it breaks the flag's upper side. Certainly, for us to consider this potential move to the upside, we need to see the break first.
Alternatively, GBPRUB could really extend the flag, by dragging itself lower towards that upwards moving support line.
Potential good trade is building up, so don't forget your stops!

