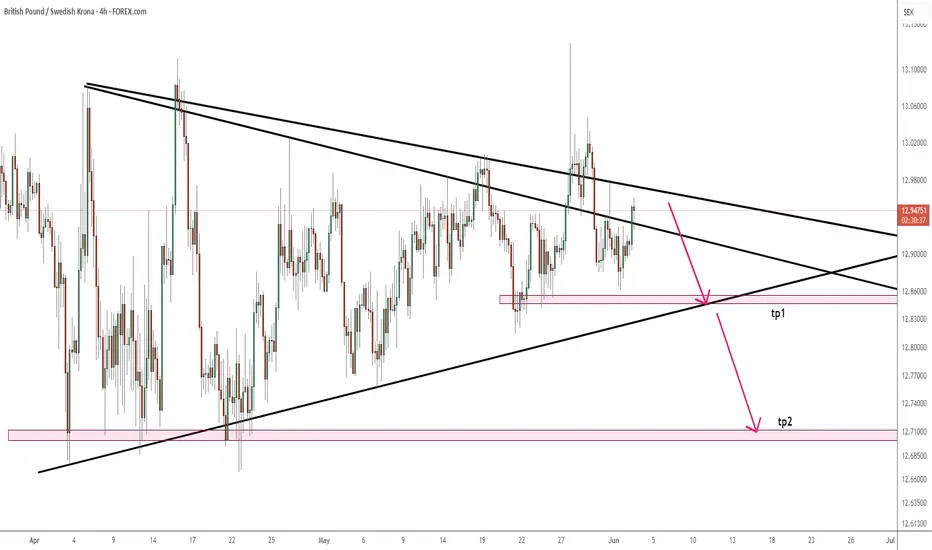
GBPSEK is bearishthe pair is in a triangle and we anticipate to hit both tps
this pattern is a price action pattern in which a double top is being seen
lets see what would happen
GBPSEK trade ideas
GBPSEK LongGBPSEK is now net long the regression break.
I am considering this trade and what EA to use.
buy position on GBPSEKthe pair reacted to support level and will go upward toward fibo level
we proposed this position with RRR>3 based on price action pattern and ichimikou tenkensen
lets see the result

GBPSEK ShortGBPSEK is not net-short on the regression break into strong support.
I will not take this trade.

GbpSek is bearishthe pair made head and shoulder pattern at the end of bullish move and tried to continue its upward move but after a fake break starting heading south .this is a price action pattern confirming bearish setup .
please see what would happen

Forex: Why and How to Use TradingView
Dear readers, I am Trader Andrea Russo and today I want to talk to you about the reason why I use TradingView.
The Forex (Foreign Exchange) market is one of the largest and most dynamic in the world, with over 6 trillion dollars traded every day.
TradingView is one of the most popular platforms for technical analysis and chart viewing, particularly appreciated by Forex traders. In this guide, we will explore how to use TradingView to trade Forex, taking advantage of the tools and features offered by the platform.
What is TradingView?
TradingView is a technical analysis platform that offers advanced charts, drawing tools, customizable indicators, and an active community of traders. Among its main features:
Real-time charts on any timeframe, from 1 minute to daily or weekly.
Technical indicators such as RSI, MACD, moving averages, and much more.
Social trading to share ideas with other traders and learn from their analysis.
Drawing tools to plot trends, channels, and Fibonacci.
With its user-friendly interface, TradingView is ideal for beginner traders and those looking for advanced analysis.
How to Trade Forex with TradingView
1. Choose a Currency Pair
The first step to start trading Forex is to choose a currency pair to analyze, such as EUR/USD or GBP/JPY. Each pair represents the value relationship between two currencies. For example, in the case of EUR/USD, the base currency is the Euro and the counter currency is the US Dollar.
2. Use Charts
TradingView offers several views:
Candlestick Chart: Shows price movements in specific time frames. It is the most used chart in Forex.
Line Chart: Shows only closing prices, useful for observing general trends.
Bar Chart: Shows the open, close, high and low for each period.
These visualizations help you better understand the market trend.
3. Set Indicators
Indicators are essential tools in technical trading. On TradingView, you can use:
RSI (Relative Strength Index): Shows whether a currency pair is overbought or oversold (levels above 70 indicate overbought, below 30 oversold).
MACD (Moving Average Convergence Divergence): Provides trend reversal signals and can be used to confirm the market direction.
Moving Averages (MA): Helps identify the market direction and filter trading signals.
4. Customize Drawing Tools
TradingView offers powerful drawing tools such as:
Trend Lines: To plot support and resistance levels.
Fibonacci Retracement: To identify key price reversal levels.
Channels: To analyze price movements within a defined range.
These tools allow you to precisely track market entry and exit points.
5. Create Alerts
TradingView allows you to set custom alerts. You can receive notifications via email or directly on the platform when the price reaches certain levels. This is particularly useful for not missing important trading opportunities.
Forex Trading Strategies
1. Trend Trading
One of the most common strategies is trend following. When the market is in an uptrend (bullish trend), buy; when it is in a downtrend (bearish trend), sell. Use moving averages or the MACD indicator to identify the direction of the trend.
2. Retracement Trading
Retracements are corrective movements within a trend. You can use Fibonacci Retracement to identify support and resistance levels, and wait for the price to retrace before entering the market in the direction of the main trend.
3. Scalping
Scalping is a short-term strategy that aims to make small profits from rapid price movements. Use short timeframes (for example 1 minute or 5 minutes) and take advantage of spikes in volatility.
4. Breakout Trading
Breakout trading is based on breaking key support or resistance levels. When the price breaks these levels, a strong move in one direction is expected. Indicators such as ATR (Average True Range) help you monitor volatility and choose the right times to enter the market.
Forex Trading Tips
Risk Management: Forex is a highly leveraged market, so protecting your capital is key. Use stop losses and take profits to limit losses and protect gains.
Conclusions
TradingView is an excellent tool for Forex trading, thanks to its wide range of advanced features, ease of use and the ability to analyze charts accurately.


Trading Signal for GBPSEK - Direction: SellDear Traders,
We have identified a trading opportunity on the GBPSEK currency pair using the EASY Quantum Ai Strategy. Below are the specifics for the trade setup:
Direction: Sell
Enter Price: 13.56943
Take Profit: 13.52924333
Stop Loss: 13.60879333
Rationale:
Our prediction for a sell movement in GBPSEK is based on multiple factors identified by the EASY Quantum Ai Strategy:
1. Technical Indicators: Several key technical indicators are suggesting a bearish trend. The Relative Strength Index (RSI) shows that the currency pair is in an overbought condition, indicating potential downside movement. Additionally, the Moving Average Convergence Divergence (MACD) reflects a bearish crossover, further supporting the sell direction.
2. Market Sentiment: Recent economic data releases from the UK show weaker-than-expected results, creating a bearish sentiment around the GBP. On the other hand, improvements in Sweden’s economic outlook lend strength to SEK, making the sell direction more probable.
3. Chart Patterns: The GBPSEK chart has formed a head and shoulders pattern, which is a classic reversal sign. This pattern suggests a shift from a bullish to a bearish trend, aligning perfectly with our sell prediction.
Please ensure you manage your risk appropriately, using the predefined Stop Loss and Take Profit levels to protect your capital.
Happy Trading!
Best Regards,
EASY Quantum Ai Strategy Team


GBPSEK Trading Signal: Sell OpportunityDear Traders,
We have identified a promising sell opportunity for the GBPSEK currency pair. Below are the details of the trade signal:
Direction: Sell
Enter Price: 13.92352
Take Profit: 13.87498333
Stop Loss: 13.97728333
Justification for the Signal:
Our forecast and trading signal have been generated using the EASY Quantum Ai strategy. Several key factors have influenced our prediction of a downward movement:
1. Technical Indicators: Recent technical analysis suggests a downtrend. Important resistance levels have been tested without a successful break, signaling potential further downside movement.
2. Market Sentiment: Current market sentiment analysis points towards bearish momentum due to global economic factors affecting GBP more adversely compared to SEK.
3. Economic Data: Recent economic data releases have shown weaker performance for the UK economy relative to Sweden, increasing pressure on GBP.
Please ensure you follow risk management protocols, and adjust your trade size accordingly. Happy trading!
Best regards,
Your Trading Team
Disclaimer: This trading signal is for informational purposes only and does not constitute financial advice. Always perform your own analysis before making any trading decisions.

GBPSEK Roadmap February 2023GBP is the ultimate risk on currency so it could be foreshadowing the soft SPX scenario into summer

GBPSEK Short SignalHey guys its your girl forex potatoe with another daily Forex analysis for GBPSEK.
I trade any pair as long as the price action is textbook great to trade. Here is my analysis for GBPSEK i have actually been following this pair for some time as well.
I just noticed i like to take reversal trades anyway lets get to business.
This is a textbook break and retest strategy, as you can see with GBPSEK there was a head and shoulder reversal pattern and now price retraced to test the resistance as well as the trendline which makes it a strong signal to sell.
I will enter this trade after a bearish engulfing candlestick as been formed but you can enter right here if you like to enter from the beginning or wait for more entry confirmations if you wish.
Kindly leave a follow and boost if you like my ideas and leave a comment as i try to post weekly depending on the market conditions .Gracias!

GBPSEK LONG WEEKLY OUTLOOK 3/8 TRAPlooks like price is moving up. my alert went off and considered to execute a trade for potential big gains on weekly chart for longer term position.

GBPSEK LongGBPSEK Long Pitchfork and MACD with SR; targets set at fib 1.618 (also near TL reversal) and second target at historic SR

long gbp sek 15 minhey all and happy weekend next week am gonna lock to buy first to resistence level in 4h after for sure sell
long tp=12.6400
short entry 12.6700 tp12.2320
goodluck all
dont forget to leave your idea in comment plz


LONG GBP/SEKHello Traders, I have went long on GBP/SEK purely based on price action. Looking at our daily chart we can see a bullish flag forming as well as some 4hr divergence for extra confluence. Also looking at our 4 hr timeframe we see price is broken the downtrend and I believe it's already setting up for a temporary reversal to the upside. And looking for double confluence, looking at the weekly chart, we see a beautiful bulling flag forming. Looking at price, I see a potiential double top forming so I have set TP to previous highs.
TP: 12.56704
SL: 12.34012

GBPSEK $GBPSEK Short ScalpGBPSEK $GBPSEK Short Scalp. TP and SL on chart. Move SL on TP. After TP2, trail with 0.5ATR step and 1.5ATR offset.


GBPSEK! Looks like a bearish corrective wave, which is a sign of more selling.
Low risk entry setup.
Trade with care use a stop loss.

GBP/SEKBullish breakout :
Entry price 12.44420
Take Profit 12.59933
Stop Loss 12.35326
Bearish breakout :
Entry price 12.14642
Take Profit 11.98415
Stop Loss 12.23022

GBPSEK!We anticipate a slight retracement then the rush upside.
But the setup, can be changed, for us, we see the buy probability than that sell possibility.
It has a high risk entry.
Trade with care use a stop loss.

Good Momentum Overall Average Signal from all our indicators suggests a Long. Entry is at market open and exit is shortly before market close or whenever you are okay with profits. I have a bit of a doubt with this one so be careful with this one.
