GBPSEK SHORT LIVE Analysis ON GBPSEK
GBPSEK is currently in a Weekly Supply nested inside Monthly Supply, although it isnt fresh sells are considered on lower timeframes with confirmation.
Reasons of taking the Trade :
- Broke Trendline
- Imbalance departure away from zone
- Broke mini opposing demand level
GBPSEK trade ideas

GBPSEK!We see a bearish structure that indicates, bearish momentum.
The bearish trade is the longterm trade so its wise to hang on the entry.
Trade with care use a stop loss.

GBPSEK Horizontal Support LevelsGBPSEK
Trend: Up
Level: Horizontal Support Level, EMA 10 Support Level, EMA 20 Support Level, Fibonacci Retracement Support Level
Signal: Rejection Candlestick

GBPSEK - long - Overall trend is bullish. The market is consistently making higher highs and lows. Expecting the trend to continue. The 50 EMA is supporting the market.There is also an ascending triangle formation on the 1hr tf.

GBPSEK - long an inverse head and shoulders has formed. I'm looking for a break and retest of the neckline before entry. there's a huge momentum candle going into the neckline, so I'm biased for the push through. market is also supporting the 50 EMA.


Trade using EMA, Pin Bars, Trend Lines, Higher Highs Higher LowsPin Bar Is Present On The H2, H3, and H4 Chart. This is a strong indication of a bull market. When this chart pattern occurs, look to enter long positions.
Trend: Up
Level: EMA 10 Level, EMA 20 Level, Horizontal Level
Signal: Pin Bar
Trade with multiple factors in your favor. In a bull market, look for pin bars, rejection candlesticks, EMA 10 above EMA 20, up trend, and higher highs higher lows.


GBPSEK BUY update📌📌TP 1 SMASHED
Hey guys
PRICE as finally gotten to our take profit one which is the first flag
You can either hold till price gets to our second tp or close partials.
And most important, don't forget to put ur SL to ENTRY.👌

GBPSEK BUYSA high probability trade with very low risk.
🔺 Disclaimer! The content of this analysis is subject to change at any time without notice.
🔺 It is provided for the sole purpose of assisting traders to make independent investment decisions.
🔺 You must do your own research to create your own trading plan for the market

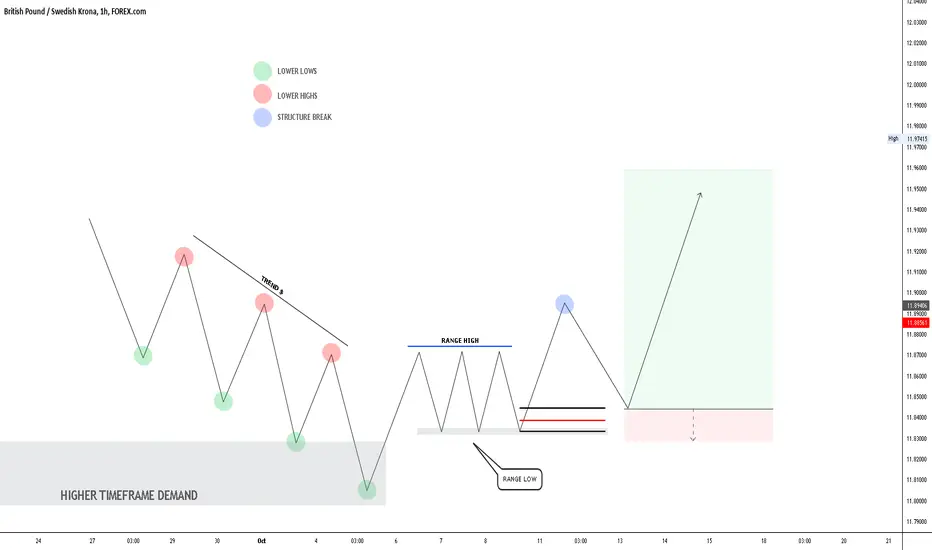
What is a RANGE?Hello Traders,
Here is the most simple & easy explanation about a Range.
In this Lesson I will Show you how to Identify & Trade a RANGE!
These patterns are seen daily in Stocks, Forex and different markets across the Globe.
I hope you will find this information educational & informative.
Your support is appreciated with a follow, like & Comment
Lets dive Right Into it!!
What Is a Range?
Range refers to the difference between the low and high pricesover a specific time period. Range defines the difference between the highest and lowest prices traded for a defined period, such as 4H, day, Week & month. The range is marked on charts, for a single trading period, as the high and low points on a candlestick or bar.
The top of the trading range often provides price resistance, while the bottom of the trading range typically offers price support.
Understanding Trading Ranges
When the Market breaks through or falls below its trading range, it usually means there is momentum (positive or negative) building. A breakout occurs when the price of the Market breaks above a trading range, while a breakdown happens when the price falls below a trading range. Typically, breakouts and breakdowns are more reliable when they are accompanied by a large volume, which suggests widespread participation by traders and investors.
Many traders look at the duration of a trading range. Large trending moves often follow extended range-bound periods. Day traders frequently use the trading range of the first half-hour of the trading session as a reference point for their intraday strategies. For example, a trader might buy a stock if it breaks above its opening trading range.
Ranges and Volatility
Since price volatility is seen as equivalent to risk, a Markets trading range is a good indicator of relative riskiness.
A conservative Trader prefers a Market with smaller price fluctuations compared to Market that are susceptible to significant gyrations. Such an trader may prefer to Trade in more stable Market rather than in more unstable Market.
Trading Range Strategies
Range-bound trading is a trading strategy that seeks to identify and capitalize on a Market trading within price channels. After finding major support and resistance levels and connecting them with horizontal trendlines, a trader can buy a at the lower trendline support (bottom of the channel) and sell it at the upper trendline resistance (top of the channel).
Support and Resistance
If the Market is in a well-established trading range, traders can buy when the price approaches its support and sell when it reaches the level of resistance. Technical indicators, such as the relative strength index (RSI), stochastic oscillator, and the commodity channel index (CCI), can be used to confirm overbought and oversold conditions when price oscillates within a trading range.
For example, a trader could enter a long position when the price is trading at support, and the RSI gives an oversold reading below 30. Alternatively, the trader may decide to open a short position when the RSI moves into overbought territory above 70. A stop-loss order should be placed just outside of the trading range to minimize risk.
Breakouts and Breakdowns
Traders can enter in the direction of a breakout or breakdown from a trading range. To confirm the move is valid, traders should use price action & Structure Break.
For instance, there should be a significant increase in volume on the initial breakout or breakdown as well as several closes outside the trading range ( Structure Break). Instead of chasing the price, traders may want to wait for a retracement / Correction before entering a trade. For example, a buy limit order could be placed just above the top of the trading range, which now acts as a support level.
Thanks for Reading this article, I hope that it was informative and educational As always, If you have any questions / Comment or Concern Please feel free to leave them below.
Thanks to @TradingView for this lovely platform to educate and grow together :)
Hope to see you in the next Educational Post!
Global Fx Education
GBPSEK!The up move could either be a reversal or a slight pullback before more selling.
A high probability trade with low risk.
Trade with care use a stop loss.

GBPSEK Target Price 11.96054GBPSEK Entry Price 12.00221
Entry after pin bar closes on the H4 Time Frame
Daily Time Frame
H2 Time Frame


GBPSEK!Structure looks ready to fall.
The risk on this is about high.
Trade with care use a stop loss.


GBPSEK!So far, 3 entries have been squashed.
For us we trade what we see and anticipate the next move based on the corrective pattern, we see a drop to come.
Trade with care use a stop loss.

GBPSEK tested the 0.5 FIB 🦐GBPSEK on the 4h chart after the bullish impulse retraced at the 0.5 Fibonacci level.
The price created a double bottom over the support and now is testing the resistance area.
According to Plancton's strategy if the market will break above we will set a nice long order.
–––––
Follow the Shrimp 🦐
Keep in mind.
• 🟣 Purple structure -> Monthly structure.
• 🔴 Red structure -> Weekly structure.
• 🔵 Blue structure -> Daily structure.
• 🟡 Yellow structure -> 4h structure.
• ⚫️ Black structure -> >4h structure.
Here is the Plancton0618 technical analysis , please comment below if you have any question.
The ENTRY in the market will be taken only if the condition of the Plancton0618 strategy will trigger.


