GBPSGD trade ideas

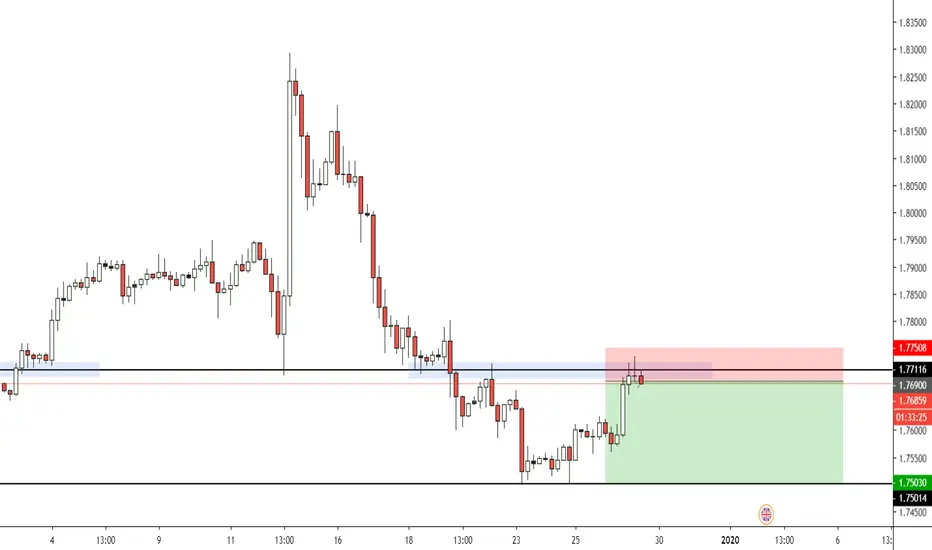
GBPSGD SHORT TRADE. REJECTION OFF OF RESISTANCEHi, even though it's the holidays there are still opportunities so don't believe the rumors that the market slows down for the holidays. Money never sleeps. Anyway, I'm shorting the GBPSGD pair after price is rejecting it current resistance level which is also a level on the Daily chart. I will be targeting previous support.
GBP/SGDTrade Idea, Please do not take this as your trade guidance we hold positions longer term and also hedge against the positions.

GBPSGD, The best place for Sell..The price is near 9-Months High 1.80965.
It can bounce down after the false breakout.
Push like if you think this is a useful idea!
Before to trade my ideas make your own analyze.
Write your comments and questions here!
Thanks for your support!

GBPSGD ShortWe are now reaching the end of our up wave
Waiting for bearish set up to confirm downside

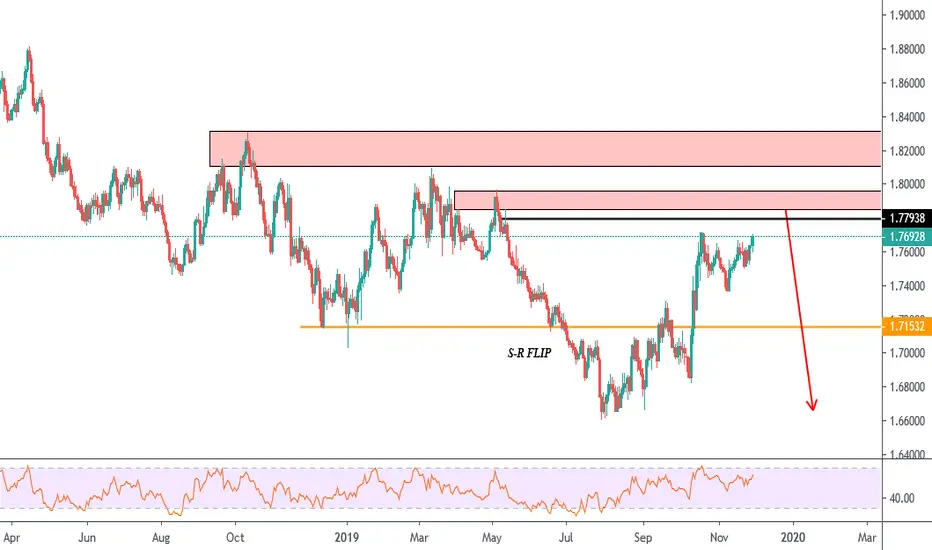
GBPSGD Bearish ResistanceDaily chart in congestion price at previous resistance.
4H weakening of bullish strength, MACD Divergence.
Bearish Opportunity but GBP is very unpredictable. Odds are favouring a short. Good luck.

GBPSGDWatching this move Double Top. Highs are not taken out yet waiting on that move before some selling to the low area

ANALYSIS OF GBPSGD 2.12.2019The price above 200 MA, indicating a growing trend.
The MACD histogram is above the zero lines.
The oscillator Force Index is above the zero lines.
If the level of resistance is broken, you should follow the recommendations below:
• Timeframe: H4
• Recommendation: Long Position
• Entry Level: Long Position 1.7710
• Take Profit Level: 1.7850 (140 pips)
If the price rebound from resistance level, you should follow the recommendations below:
• Timeframe: H4
• Recommendation: Short Position
• Entry Level: Short Position 1.7535
• Take Profit Level: 1.7485 (50 pips)
USDJPY
A possible long position at the breakout of the level 109.70
GOLD
A possible short position in the breakdown of the level 1452.00
USDCHF
A possible long position at the breakout of the level 1.0010
EURUSD
A possible long position at the breakout of the level 1.1030
WHY TRADE WITH PAXFOREX?
We are one of the fastest growing Forex Brokers in the Market. Trade with PaxForex to get the full Forex Trading experience which is based on...
Top Effective Educational Tools For All Types Of Traders
The Reliability in all assets in the market
Live Multi-language Online Support 24/5

GBPSGD: Optimal Buy entry.The pair is trading within a 2 year 1M Bearish Megaphone pattern that is currently testing its Lower High trend line (hence the neutral RSI = 48.838, ADX = 27.266, Highs/Lows = 0.0000).
What's really interesting is the fact that this pattern is symmetrical to the 2016/2017 rise. Based on that if the price rebounds now above 1.7200, there are high chances to break the pattern aggressively to the upside. In our opinion it is safer to buy when/ if the Golden Cross (MA50 crossing over the MA200) takes place. The target is entirely up to you but 1.8700 can be a good benchmark.
** If you like our free content follow our profile (www.tradingview.com) to get more daily ideas. **
Comments and likes are greatly appreciated.

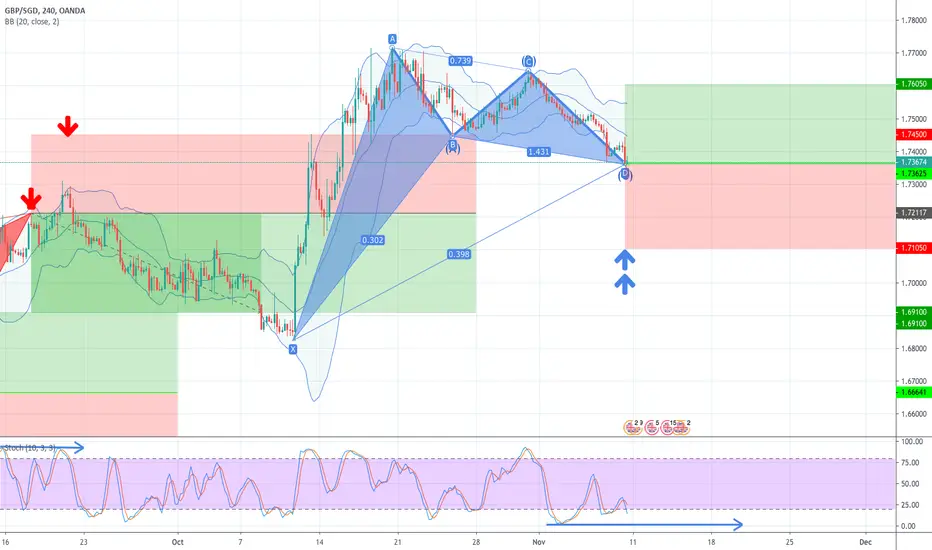
GBPSGD LongDue the to price breaking the previous (A) top the pattern has now become a Bullish Expanded B wave Flat
Have a Bullish outlook in the short term
Still believe we will have a 5 wave down breaking previous bottom on the Daily but will have to monitor chart
If it breaks the top of wave (2) on the Daily then pattern and Forecast will have to be updated


GBPSGD can continue falling down..The price has broke Support/Resistance Zone and can continue falling down
to the Mirror Level 1.74437.
The best entry will be after the pullback to zone.
Before to trade my ideas make your own analyze.
Write your comments and questions here!
No need to write it in PM.
Thanks for your support!


GBPSGD ShortFrom last analysis we are anticipating a down wave to finish off bearish move on the larger time frame
We now have a Bearish Running Flat/ Expanded Flat formation
Watching price on lower time frame


38.2% & POSSIBLE 61.8% Retracement LONG GWAVE38.2% & POSSIBLE 61.8% Retracement LONG GWAVE.
FIB Retracement Percentage is calculated in a Higher Cartesian and or Euclidean Dimension.
PLEASE ALWAYS WAIT FOR STOCHASTIC CONFIRMATION!!! THANKS