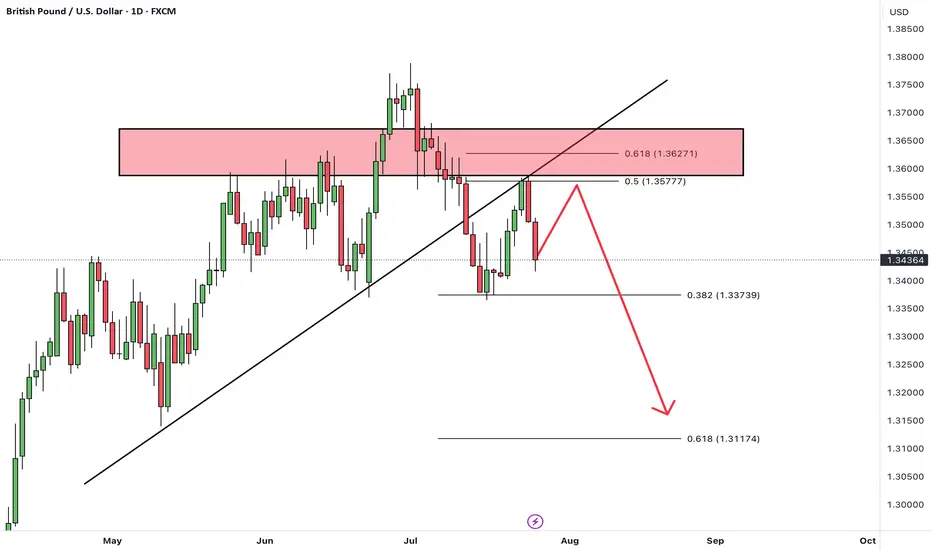
GBPUSDHello Traders! 👋
What are your thoughts on GBPUSD?
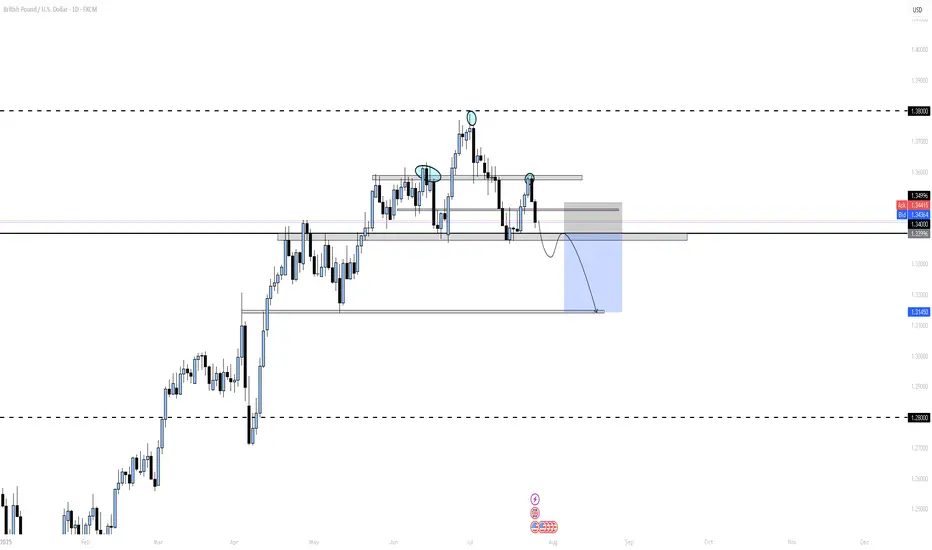
GBP/USD has broken below a trendline and has completed a retest (pullback) to the broken level.
The pair is now positioned for a potential downward move.
After some short-term consolidation, we expect price to drop at least toward the next identified support level.
As long as GBP/USD stays below the broken trendline, the bearish bias remains valid, and further downside is likely.
Don’t forget to like and share your thoughts in the comments! ❤️
GBPUSD trade ideas
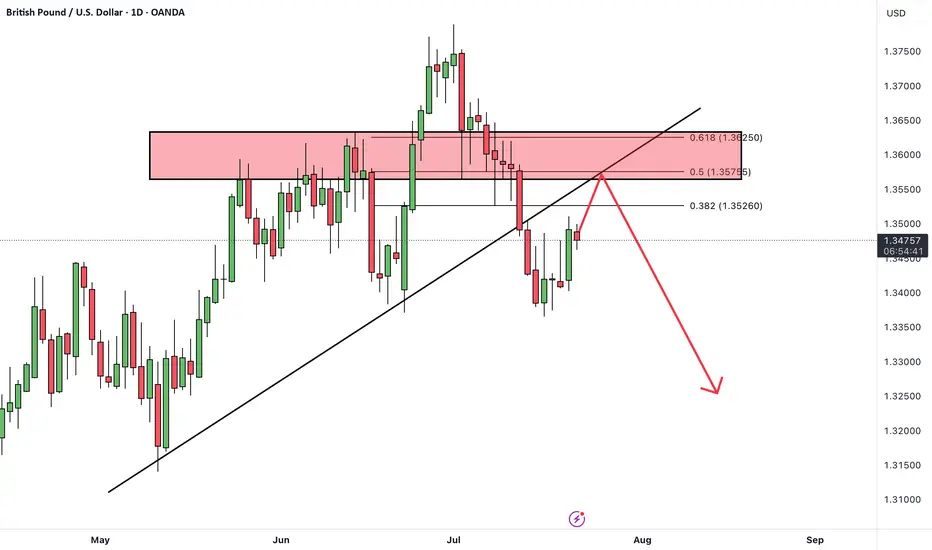
GBPUSDHello Traders! 👋
What are your thoughts on GBPUSD?
GBP/USD has broken support zone and its ascending trendline, indicating a shift in momentum.
The pair is currently in a pullback phase, retesting the broken support zone, which now acts as resistance.
Once the pullback is complete, we expect further downside toward the next identified support level.
As long as the price remains below the broken zone, the bearish outlook remains valid, and rallies may offer sell opportunities.
Don’t forget to like and share your thoughts in the comments! ❤️
#GBPUSD: Going As Expected, Strong Move AheadHey Everyone,
We have a good opportunity coming up on gbpusd; since our last update on gbpusd, price went as expected. We will see huge increase in price in coming days. Good luck and take care!!
If you like our work then please like and comment.

GBPUSD Traders Beware: A Major Drop Could Be ComingThe classic rule says what doesn’t go up must come down. After a failed breakout at 1.3439, GBPUSD is struggling. With longs sitting on big gains from January’s low, a drop toward 1.3361 or even lower looks likely. Watch this key level now.
This content is not directed to residents of the EU or UK. Any opinions, news, research, analyses, prices or other information contained on this website is provided as general market commentary and does not constitute investment advice. ThinkMarkets will not accept liability for any loss or damage including, without limitation, to any loss of profit which may arise directly or indirectly from use of or reliance on such information.

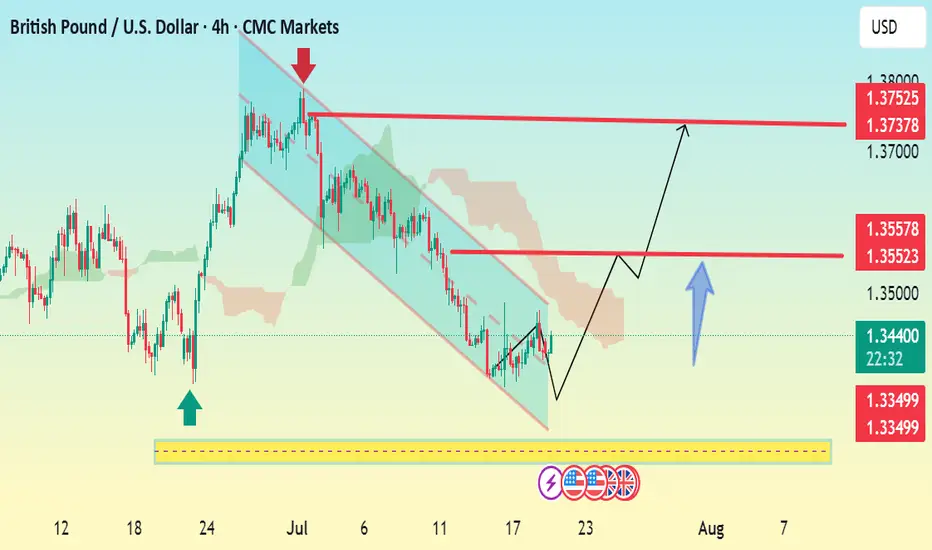
GBP/USD 4H Bullish Reversal Setup Analysis:The chart shows GBP/USD breaking out of a descending channel, signaling a potential bullish reversal.
Price has bounced from a strong support zone (highlighted in yellow), with bullish momentum building.
The breakout is backed by a higher low structure, which often precedes an uptrend continuation.
Key Levels:
Support: 1.3349
First Resistance / TP1: 1.3552–1.3557
Final Target / TP2: 1.3737–1.3752
Outlook:
If price holds above 1.3439 and breaks 1.3552 with volume, the next leg toward 1.3750 is likely.
Watch for retests of the breakout level for confirmation before entering long.
📈 Bias: Bullish above 1.3439
🕐 Timeframe: 4H chart
Let me know if you want SL (stop loss) and entry suggestions too.
GBP/USD 4H Bearish Reversal Setup. GBP/USD 4H Chart Analysis (July 24, 2025):
Price is rejecting resistance near 1.35709, forming a bearish setup. A short position is highlighted with entry around 1.35067, stop loss above resistance, and target near the 1.33786 support zone. Bears aim for continuation toward 1.33745.

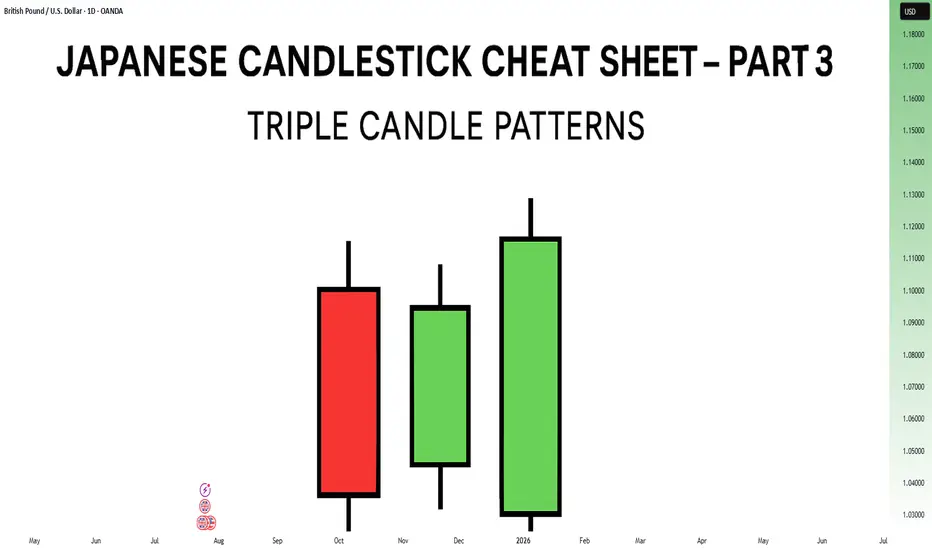
Japanese Candlestick Cheat Sheet – Part Three- 3 candle patternsSo far in this series, we've broken down single candle formations ( Part 1 ) and explored double candle signals ( Part 2 ) — the kind of patterns that give you quick, often powerful hints about the market’s mood.
But now it’s time to go a step further.
👉 In Part 3, we dive into triple candlestick formations — patterns that take more time to form, but often offer stronger confirmation and a more reliable narrative.
They’re like reading three full sentences from the market instead of just one or two words.
If you’re ready to spot momentum shifts (not noise), this lesson is for you.
Let’s decode the story behind formations like Morning Star, Three White Soldiers, and so on.
MORNING STAR
Bias: Bullish
What is the Morning Star pattern?
The Morning Star pattern consists of a bearish candle, a small-bodied middle candle, and a bullish candle, forming at the end of a downtrend to signal potential reversal. This pattern reflects a shift from seller dominance to buyer strength, as the middle candle marks a pause before a reversal. The Morning Star is a reliable signal that buyer interest is reemerging.
Understanding Morning Stars helps traders anticipate shifts in momentum, providing valuable entry points for new uptrends.
Meaning:
Found in downtrends; signals potential bullish reversal as buyers gain control, with strength confirmed by the third candle closing above the first.
BULLISH ABANDONED BABY
Bias: Bullish
What is the Bullish Abandoned Baby pattern?
The Bullish Abandoned Baby is a rare but powerful reversal pattern that consists of a bearish candle, a gapped doji, and a bullish candle. The middle doji reflects indecision, while the third bullish candle confirms the reversal. This pattern highlights a dramatic shift in sentiment, showing that buyers are prepared to take control.
Recognizing the Bullish Abandoned Baby can offer traders insights into pivotal market shifts.
Meaning:
Appears in downtrends; suggests a strong bullish reversal, as the middle doji shows indecision, with confirmation by a strong bullish move.
THREE WHITE SOLDIERS
What is the Three White Soldiers pattern?
The Three White Soldiers pattern consists of three consecutive bullish candles, each closing higher than the last, often appearing in downtrends to signal a potential bullish reversal. This pattern reflects sustained buying pressure, indicating that buyer sentiment is strong. Psychologically, it shows that buyers are steadily gaining confidence, pushing prices upward.
For traders, Three White Soldiers provide a clear signal of momentum, ideal for capturing emerging trends.
Meaning:
Found in downtrends; signals potential trend reversal, showing sustained buying strength, often signaling the start of a bullish trend.
MORNING DOJI STAR
What is the Morning Doji Star pattern?
The Morning Doji Star pattern is similar to the Morning Star, but with a doji as the middle candle, indicating greater indecision before a reversal. This pattern consists of a bearish candle, a doji, and a bullish candle, highlighting a transition from bearish to bullish sentiment. The doji reflects a moment when market sentiment is balanced, but the third candle confirms a bullish shift.
Interpreting Morning Doji Stars can help traders identify turning points in downtrends, providing valuable entry opportunities.
Meaning:
Appears in downtrends; signals potential bullish reversal, with indecision from the doji and confirmation by a strong bullish candle.
EVENING STAR
What is the Evening Star pattern?
The Evening Star is a three-candle pattern that appears at the top of an uptrend, signaling a potential bearish reversal. It consists of a bullish candle, a small-bodied middle candle, and a bearish candle, showing a transition from buyer control to seller strength. This pattern often appears at market peaks, where optimism is giving way to caution.
Understanding the Evening Star pattern helps traders anticipate downtrend formations, allowing them to time their exits.
Meaning:
Found in uptrends; signals potential bearish reversal as sellers gain control, confirmed if the third candle closes below the first.
BEARISH ABANDONED BABY
What is the Bearish Abandoned Baby pattern?
The Bearish Abandoned Baby is the bearish counterpart to the Bullish Abandoned Baby and consists of a bullish candle, a gapped doji, and a bearish candle. This pattern reveals a dramatic shift in sentiment from bullish to bearish, highlighting a sudden reversal at the top of an uptrend.
Recognizing the Bearish Abandoned Baby can offer traders insight into market tops and impending trend changes.
Meaning:
Appears in uptrends; indicates strong bearish reversal, as indecision in the doji is followed by selling strength.
THREE BLACK CROWS
What is the Three Black Crows pattern?
The Three Black Crows pattern consists of three consecutive bearish candles, each closing lower than the last, appearing in uptrends to signal potential reversal. This pattern reflects sustained selling pressure, indicating that sellers are gaining control. The Three Black Crows highlight a moment when buyer confidence wanes, marking the beginning of downward momentum.
For traders, this pattern provides a clear signal to avoid buying into weakening trends or even entering short trades.
Meaning:
Found in uptrends; signals potential bearish reversal, with sustained selling pressure often marking the start of a downtrend.
EVENING DOJI STAR
What is the Evening Doji Star pattern?
The Evening Doji Star is similar to the Evening Star, but with a doji as the middle candle, highlighting greater indecision. This pattern consists of a bullish candle, a doji, and a bearish candle, indicating a shift from bullish to bearish sentiment. The doji suggests that buyers are losing control, with sellers prepared to reverse the trend.
Understanding Evening Doji Stars allows traders to recognize market tops, helping them avoid overextended trends.
Meaning:
Appears in uptrends; signals potential bearish reversal, as the doji suggests indecision, confirmed by strong selling on the third candle.
GBPUSD Breakout from descending channel bullish strong now 📊GBPUSD Bullish Forecast
4H Timeframe Analysis
GBPUSD has successfully broken out of the descending channel and is now turning bullish from the key demand zone at 1.33700 ✅
Momentum shift confirmed — buyers in control 📈
🎯 Next Target Zones:
🔹1.36000 – First Supply Zone
🔹1.37500 – Major Supply Zone
Outlook:
As long as price holds above 1.33700, we expect bullish continuation toward the supply zones.
Clean breakout structure supports further upside 🔍
📢 Like 👍 | Follow 🔔 | Comment 💬 | Join Us 📲
For more setups, insights, and real-time forecasts!
#GBPUSD

GBPUSD → Retest of previously broken resistance...FX:GBPUSD has entered a correction phase after breaking through the local downtrend. If the price remains in the 1.3450–1.346 zone, this will confirm the formation of a new trading range...
The market is entering a correction phase due to the dollar. A countertrend retest of the support zone is forming. Earlier, the currency pair broke the local trend and is entering a flat phase. The retest of support may end with a recovery. If, within the local movement and after a false breakout of the 1.345 - 1.3467 zone, the bulls keep the price above the buying zone, then in the short and medium term, we can expect growth to continue.
Support levels: 1.3467, 1.345
Resistance levels: 1.35, 1.3584
A false breakdown of support at 1.3467 will confirm a change in the local trend (correction). The market may return to the recovery phase of the global trend.
Best regards, R. Linda!

GBPUSD Potential UpsidesHey traders, in today's trading session we are monitoring GBPUSD for a buying opportunity around 1.35100 zone, GBPUSD is trading in an uptrend and currently is in a correction phase in which it is approaching the trend at 1.35100 support and resistance area.
Trade safe, Joe.

Short Opportunity on GBPUSD – Technical & Fundamentals AlignToday I want to look at the Short position opportunity in GBPUSD ( FX:GBPUSD ). So let's take a look at the GBPUSD pair from a fundamental and technical perspective.
Fundamental Analysis:
The British Pound remains under pressure due to growing expectations of a 25–50 bps rate cut by the Bank of England in early August. Markets are increasingly leaning toward easing as UK inflation hit 3.6% in June, the highest in over a year, while economic growth weakened and consumer confidence dropped to its lowest since early 2024
Ongoing fiscal concerns, including potential tax hikes and budget instability, continue to weigh on the pound. In contrast, the US Dollar( TVC:DXY ) remains relatively robust—supported by strong economic data and a safe-haven preference amid global uncertainty
Summary:
BoE easing becomes more likely due to weak UK data and inflation.
Fiscal risks and low consumer sentiment add downward pressure on GBP.
USD strength from solid data and safe-haven demand supports further GBPUSD downside.
-------------------------
In terms of technical analysis , in the 1-hour timeframe , GBPUSD is approaching the Resistance zone($1.356-$1.350) , the Potential Reversal Zone(PRZ) , and the 50_SMA(Daily) . Meanwhile, this return to Important Support lines could act as a pullback to these lines. Important support lines and 50_SMA(Daily) were broken last week.
In terms of Elliott Wave theory , GBPUSD appears to be completing a main wave 4 . Main wave 4 is likely to have a Zigzag Correction(ABC/5-3-5) .
I expect GBPUSD to start declining from the Potential Reversal Zone(PRZ) and reach the targets I have marked on the chart.
Note: Stop Loss(SL): 1.3575USD = Worst Stop Loss(SL)
Please respect each other's ideas and express them politely if you agree or disagree.
British Pound / U.S Dollar Analysis (GBPUSD), 1-hour time frame.
Be sure to follow the updated ideas.
Do not forget to put a Stop loss for your positions (For every position you want to open).
Please follow your strategy and updates; this is just my Idea, and I will gladly see your ideas in this post.
Please do not forget the ✅' like '✅ button 🙏😊 & Share it with your friends; thanks, and Trade safe.

GBPUSD: Sellers Are Taking ControlWelcome back to the Weekly Forex Forecast for the week of July 28 - Aug 1st
In this video, we will analyze the following FX market:
GBPUSD
GBP is weak vs USD. GU is heading lower with a bit of steam.
The Monthly and the Weekly are still bullish, but the Daily and 4H indicate weakness. I would not entertain longs until I see a bullish BOS.
Look for the CISD on the 4H in the beginning of the week, confirming sells are the way to go.
Enjoy!
May profits be upon you.
Leave any questions or comments in the comment section.
I appreciate any feedback from my viewers!
Like and/or subscribe if you want more accurate analysis.
Thank you so much!
Disclaimer:
I do not provide personal investment advice and I am not a qualified licensed investment advisor.
All information found here, including any ideas, opinions, views, predictions, forecasts, commentaries, suggestions, expressed or implied herein, are for informational, entertainment or educational purposes only and should not be construed as personal investment advice. While the information provided is believed to be accurate, it may include errors or inaccuracies.
I will not and cannot be held liable for any actions you take as a result of anything you read here.
Conduct your own due diligence, or consult a licensed financial advisor or broker before making any and all investment decisions. Any investments, trades, speculations, or decisions made on the basis of any information found on this channel, expressed or implied herein, are committed at your own risk, financial or otherwise.

Bearish reversal off overlap resistance?The Cable (GBP/USD) is rising towards the pivot, which acts as an overlap resistance and could reverse to the 1st support.
Pivot: 1.3611
1st Support: 1.3469
1st Resistance: 1.3693
Risk Warning:
Trading Forex and CFDs carries a high level of risk to your capital and you should only trade with money you can afford to lose. Trading Forex and CFDs may not be suitable for all investors, so please ensure that you fully understand the risks involved and seek independent advice if necessary.
Disclaimer:
The above opinions given constitute general market commentary, and do not constitute the opinion or advice of IC Markets or any form of personal or investment advice.
Any opinions, news, research, analyses, prices, other information, or links to third-party sites contained on this website are provided on an "as-is" basis, are intended only to be informative, is not an advice nor a recommendation, nor research, or a record of our trading prices, or an offer of, or solicitation for a transaction in any financial instrument and thus should not be treated as such. The information provided does not involve any specific investment objectives, financial situation and needs of any specific person who may receive it. Please be aware, that past performance is not a reliable indicator of future performance and/or results. Past Performance or Forward-looking scenarios based upon the reasonable beliefs of the third-party provider are not a guarantee of future performance. Actual results may differ materially from those anticipated in forward-looking or past performance statements. IC Markets makes no representation or warranty and assumes no liability as to the accuracy or completeness of the information provided, nor any loss arising from any investment based on a recommendation, forecast or any information supplied by any third-party.

POUND DOLLAR LONG CONTINUATIONMarket Outlook: GBP/USD
25th July 2025.
The Pound-Dollar pair continues to maintain a bullish market structure, and our approach remains aligned with the prevailing trend. Recently, the price traded above a key 4-hour high, triggering a deeper pullback into discount pricing within the currently active H4 demand zone.
We are now observing price action closely, as this H4 demand level holds potential to serve as the launch point for the next bullish swing. As long as the structure remains intact, we remain buyers from this zone — anticipating a continuation of the upward momentum.

GBP/USD Short Bias – Bearish Fundamentals + Smart Money StructurThe macro environment continues to favor USD strength and GBP weakness, setting up a clean short scenario both fundamentally and technically.
Fundamentals First:
Bank of England is expected to cut rates in the coming months as inflation falls and growth slows. June CPI came in lower than expected, and consumer spending remains weak.
UK GDP growth is flatlining, and PMI data continues to signal contraction in services and manufacturing.
IMF has warned the UK about fiscal imbalances and productivity issues, adding bearish pressure to GBP outlook.
Meanwhile, the Fed remains on hold, with strong U.S. labor data, robust consumer spending, and persistent core inflation — supporting the USD.
Institutional Outlook:
JPMorgan and Citi see GBP/USD downside risks as BoE policy shifts from restrictive to accommodative.
ING and BofA have noted bearish positioning building in GBP against the USD.
Technical Setup:
On the 4H chart, we’re watching a clean Head & Shoulders structure
A break and retest of the neckline confirms downside continuation.
Setup is backed by:
Institutional sentiment
Macro data divergence (UK vs U.S.)
Smart money structure + liquidity zones
Buy zone for GBP USDEasy buy on GBP_ Very good entry point after a massive rally,,, pull back zone.. and its a careful buy point

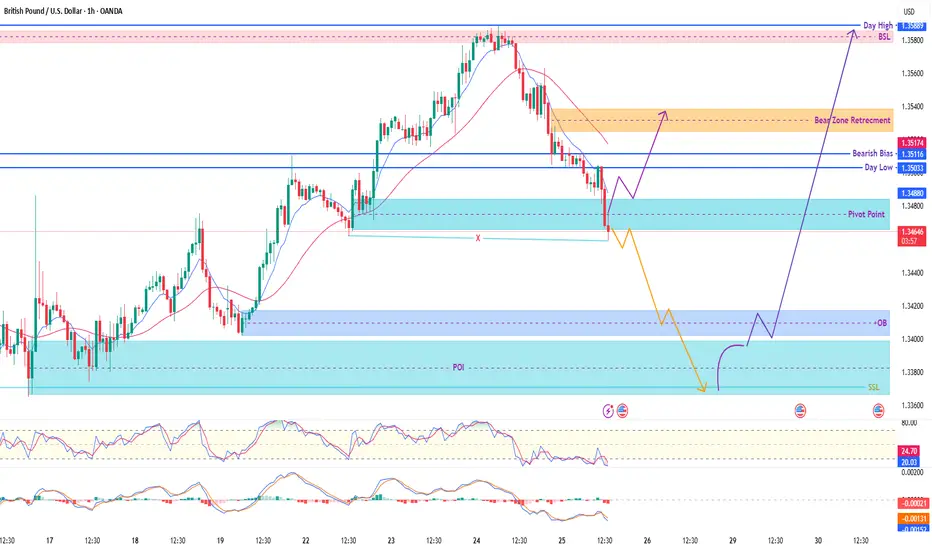
GBP/USD (1H) – SMC Outlook & Price Pathways🔍 Structure Overview:
Price has tapped into a key intraday demand zone (Pivot Point region) after a clean drop from the bearish breaker area. The market is at a critical decision point, and we’re watching for either a short-term retracement rally or a deeper liquidity hunt into the major POI below.
🧠 Key SMC Concepts Applied:
✅ Clean BOS (Break of Structure)
✅ Well-mapped OB zones (above & below)
✅ Liquidity Traps: SSL & BSL identified
✅ Bear Zone Retracement mapped for short-sellers
✅ RSI + MACD divergence signals are building quietly
📍 Key Zones on Chart:
🔴 Bearish Zone Retracement (Short Area): 1.3511 – 1.3517
🔵 Pivot Point / Minor Demand: 1.3480 – 1.3490
🟦 Deep POI: 1.3380 – 1.3400
🟩 Strong OB: 1.3365 – 1.3385
🟪 Day High/BSL Target: 1.3588
❌ SSL (Sell-Side Liquidity): ~1.3360
📈 Scenario A – Short-Term Bullish Reversal (Purple Path):
Price may bounce from the pivot zone
Target 1: Bear Zone (1.3515)
Target 2: BSL @ 1.3588
✅ Bias flips bullish if 1.3515 is cleanly broken
📉 Scenario B – Liquidity Sweep (Yellow Path):
If the current zone fails, watch for a drop into the deep OB / POI
Potential long from 1.3365 – 1.3385, targeting full bullish swing toward BSL 1.3588
🎯 Trade Example (Scenario B):
Buy Limit: 1.3375
SL: 1.3345
TP1: 1.3485
TP2: 1.3588
Risk-Reward: 1:3+
✅ Suggested Caption for TradingView:
GBP/USD (1H): Decision Point Active!
Price has reacted off a local demand near the pivot. Watching for bullish momentum to target 1.3515 → 1.3588. If price dips into the deeper POI below 1.3400, I’ll be looking for a liquidity sweep and reversal. RSI + MACD divergence are hinting at strength building.
🔹 This is educational content – not financial advice.
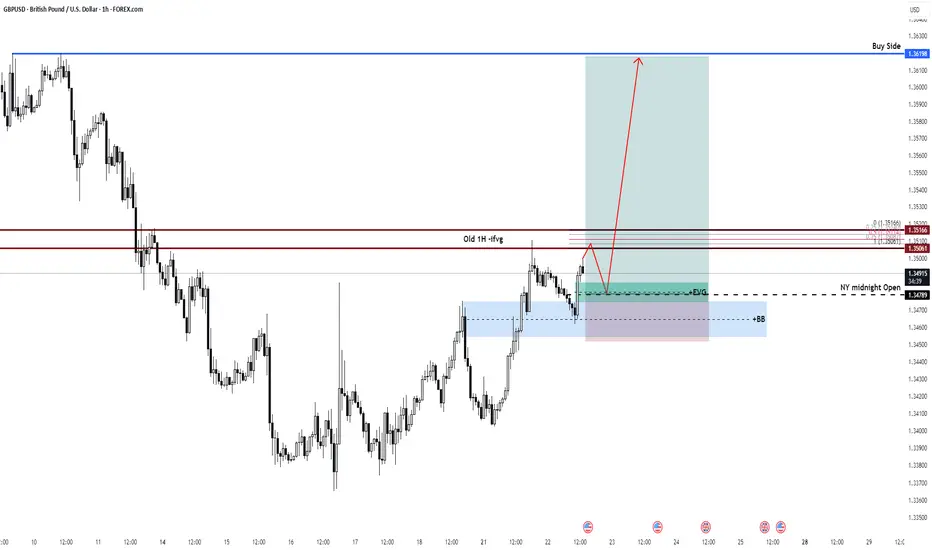
GBPUSD Long Setup – Liquidity Sweep & FVG ReclaimPair: GBP/USD
Timeframe: 1H
Bias: Long
Entry Type: Reclaim + Inducement Play
Target: Buy-side Liquidity at 1.36198
🧠 Thesis:
We’re looking to long cable after a classic setup has presented itself:
- Market structure shift has occurred to the upside.
- Price retraced into a Bullish Breaker Block aligned with a 1H Fair Value Gap (FVG) and NY Midnight Open.
- Liquidity inducement just above the NY Midnight Open should provide the fuel.
🧱 Key Confluences:
✅ 1H FVG in alignment with BB (Breaker Block)
✅ NY Midnight Open (1.34789) – acts as draw on liquidity
✅ Inducement above short-term highs before deeper retrace
✅ Buy-side liquidity resting at 1.36198
GBPUSD - Buying continuationLooking to keep buying the bullish orderflow on the 15min.
Had a nice sweep of liquidity before creating a new high. Will see how this one plays out over the day
DeGRAM | GBPUSD reached the resistance level📊 Technical Analysis
● Price rejected the rising-channel base at 1.3434 (green arrows) and has broken the eight-day corrective down-trend, restoring the series of higher-lows.
● A new impulse is aiming at the mid-June swing/ channel crest 1.3592; a measured move from the breakout projects the upper rail near 1.3773. Pull-backs toward 1.3500-1.3520 should attract bids while the inner up-sloper holds.
💡 Fundamental Analysis
● Softer US PMI prices pulled 2-yr Treasury yields off highs, trimming USD support, while UK retail-sales surprise (+0.7 % m/m) tempered BoE-cut bets, underpinning sterling.
✨ Summary
Long 1.3500-1.3520; hold above 1.3592 targets 1.3770. Invalidate on a 4 h close below 1.3434.
-------------------
Share your opinion in the comments and support the idea with a like. Thanks for your support!

Going shortBreakout from last day high resistance. ATR going up. Sign of short setup. If this breakout and do retest. With confirmation of volume and strong 3rd candle at 15 minutes time frame is strong probability of going short
IDEA GBPUSDhi everyone good monday! have idea buy limit in order price 1.34180 whit 16 pip stop loss. Can be executed manual or put order limit i preffer no take risk and wait till it touch my area.

GBPUSD I Its ready for the deeper pullback - COT OverviewHey what up traders welcome to the COT data and Liquidity report. It's always good to go with those who move the market here is what I see in their cards. I share my COT - order flow views every weekend.
🎯 Non Commercials added significant longs and closed shorts at the same time. So for that reason I see the highs as a liquidity for their longs profits taking.
📍Please be aware that institutions report data to the SEC on Tuesdays and data are reported on Fridays - so again we as retail traders have disadvantage, but there is possibility to read between the lines. Remember in the report is what they want you to see, that's why mostly price reverse on Wednesday after the report so their cards are hidden as long as possible. However if the trend is running you can read it and use for your advantage.
💊 Tip
if the level has confluence with the high volume on COT it can be strong support / Resistance.
👍 Hit like if you find this analysis helpful, and don't hesitate to comment with your opinions, charts or any questions.
Analysis done on the Tradenation Charts
Disclosure: I am part of Trade Nation's Influencer program and receive a monthly fee for using their TradingView charts in my analysis.
"Adapt what is useful, reject what is useless, and add what is specifically your own."
— David Perk aka Dave FX Hunter ⚔️
