Support & Resistance – Quick Guide In 5 StepsSupport and resistance are key concepts in technical analysis that help traders identify where price is likely to react.
Support acts like a floor — a level where buying interest is strong enough to prevent further declines.
Resistance acts like a ceiling — a level where selling pressure can stop price from rising.
These zones often lead to bounces, reversals, or breakouts, and are used to plan entries, exits, and stop-losses.
How to Identify them:
1. Assess the chart.
2. Identify Swing Points: Look for repeated highs/lows and label them. (Flags)
3. Multiple touches: Highlight the zones with multiple touches. 2+ Touches are stronger.
4. Define: Clearly define the zones. Above is resistance, below is support.
5. Entry: When price makes it way down to support, wait for the reversal. Upon reversal enter on the low time confirmation. Ensure price has failed to break below the support.
Then set TP to the previous High/Resistance zone.
Tips:
Always treat S&R as zones, not exact lines.
Combine with trend, candlestick patterns, or volume for better confluences.
Avoid trading into strong S/R — wait for breaks or retests.
GBPUSD trade ideas

GBPUSD: Back to Bullish Trend?!GBPUSD pair is showing signs of recovery after a prolonged bearish trend.
A confirmed bullish breakout from a significant daily resistance level indicates strong buying pressure.
I anticipate that the market will continue to rise and approach the 1.3515 level shortly.

GBPUSD: Bullish Ahead of BOE Rate Decision!GBPUSD: Bullish Ahead of BOE Rate Decision!
Since yesterday, GBPUSD has started a short-term upward move, driven by the tariff mess and the potential impact it could have on major economies. At least those are the ones who will be facing these moves.
On the other hand, the market is predicting a rate cut by the FED in September and this could be another reason why the USD is weak so far. It may not make much sense, but that is the situation.
GBPUSD is in a good position to rise further, however today we have the Bank of England interest rate decision. Market participants expect the Bank of England to cut rates by 25 basis points to 4% versus the current 4.25%. The impact on the market remains unclear in my opinion.
It is a bullish situation with the Bank of England ahead. There is a high risk.
You may find more details in the chart!
Thank you and Good Luck!
PS: Please support with a like or comment if you find this analysis useful for your trading day
Disclosure: I am part of Trade Nation's Influencer program and receive a monthly fee for using their TradingView charts in my analysis.

Lingrid | GBPUSD Shorting Opportunity At Confluence ZoneThe price perfectly fulfilled my previous idea . FX:GBPUSD is climbing toward the key confluence zone between the downward channel resistance and the 1.34418 horizontal level. The broader trend remains bearish, with repeated lower highs and clear rejection patterns near trendline resistance. A rejection at 1.34418 could trigger another leg lower toward the 1.32500 zone. As long as the pair remains under the red trendline, bearish continuation remains in play.
📉 Key Levels
Sell trigger: Rejection near 1.34418
Sell zone: 1.34418–1.34500
Target: 1.32500
Invalidation: Break and close above 1.34500
💡 Risks
A strong breakout above 1.34500 may flip the structure into bullish
Macro news events could override technical rejection zones
Sideways movement near resistance may reduce clarity of setup
If this idea resonates with you or you have your own opinion, traders, hit the comments. I’m excited to read your thoughts!

Sell gbpusdBe ready for the big drop coming
Monthly sell structure
Daily resistance trend respecting

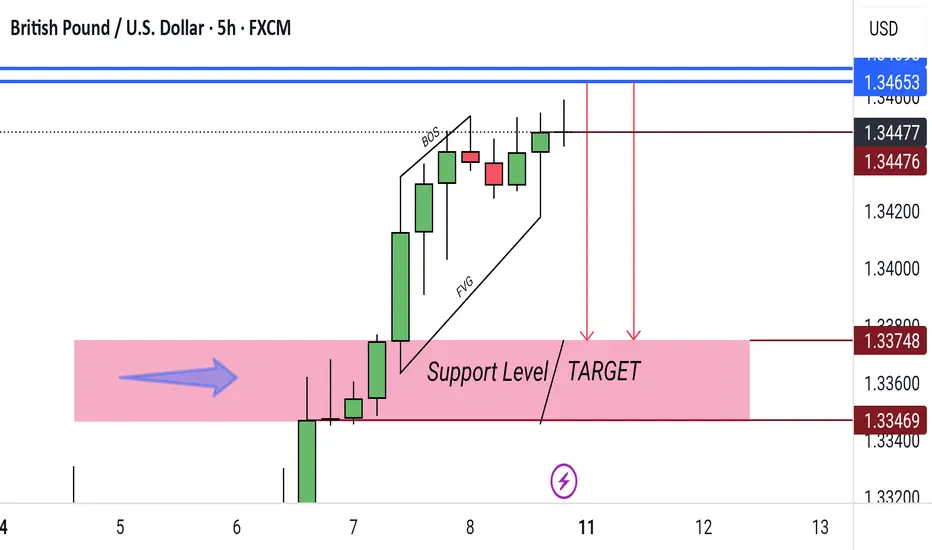
GBP/USD 5H – Bearish Reversal Towards Support ZoneGBP/USD 5H – Price is testing resistance near 1.3465 after a bullish move. A drop towards the 1.3375–1.3346 support zone (target) is anticipated.
GBPUSD Rally at Potential Turning Point :Is a Reversal Imminent?the pound has been making lower highs and lows on the daily chart, signaling a bearish trend. now hitting a key zone where the trendline and a FVG align, it could be set for a reversal and drop back to the bullish OB below

GBPUSD - SERA - Market StructureGBPUSD - SERA - Market Structure - use risk and trade managment for best result
GBPUSD I Daily CLS I Model 1 I AMD in play Yo Market Warriors ⚔️
Fresh outlook drop — if you’ve been riding with me, you already know:
🎯My system is 100% mechanical. No emotions. No trend lines. No subjective guessing. Just precision, structure, and sniper entries.
🧠 What’s CLS?
It’s the real smart money. The invisible hand behind $7T/day — banks, algos, central players.
📍Model 1:
HTF bias based on the daily and weekly candles closes,
Wait for CLS candle to be created and manipulated. Switch to correct LTF and spot CIOD. Enter and target 50% of the CLS candle.
For high probability include Dealing Ranges, Weekly Profiles and CLS Timing.
“Adapt what is useful. Reject whats useless and add whats is specifically yours.”
David Perk aka Dave FX Hunter
💬 Don't hesitate to ask any questions or share your opinions

GBPUSD – Bearish Bounce Loading?Hello TradingView Family / Fellow Traders. This is Richard, also known as theSignalyst.
📈GBPUSD has been overall bearish trading within the falling channel marked in red and it is currently in a correction phase.
Moreover, the blue zone is a strong supply.
📚 As per my trading style:
As #GBPUSD approaches the red circle zone, I will be looking for bearish reversal setups (like a double top pattern, trendline break , and so on...)
📚 Always follow your trading plan regarding entry, risk management, and trade management.
Good luck!
All Strategies Are Good; If Managed Properly!
~Rich
Disclosure: I am part of Trade Nation's Influencer program and receive a monthly fee for using their TradingView charts in my analysis.

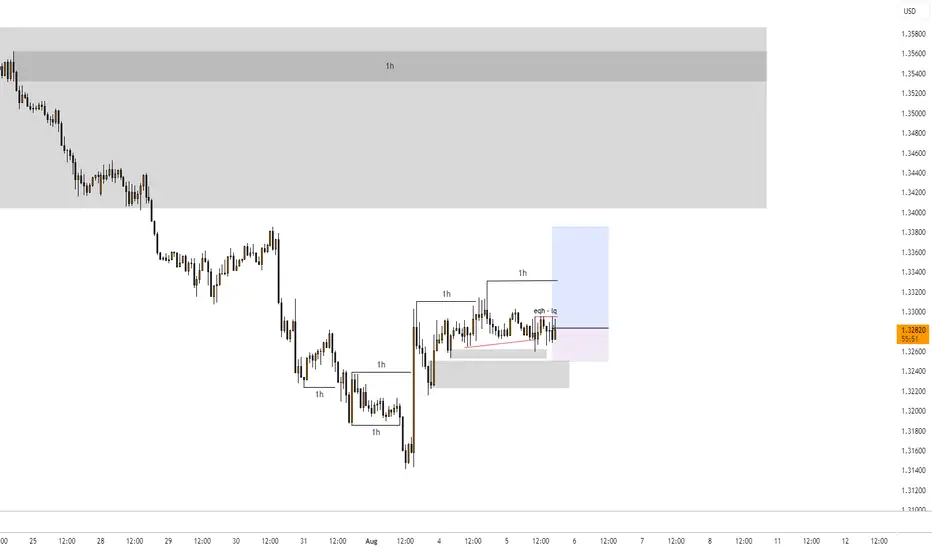
GBPUSD Approaching Key Psychological Zones!Hey friends 👋
Here’s a fresh GBPUSD analysis I’ve prepared for you. I’m planning to open a **buy** position between **1.32506 – 1.32246**, aiming for a target level of **1.33298**.
Every single like you send my way is a huge source of motivation for me to keep sharing these insights. Big thanks to everyone supporting with a like 🙏

GBPUSD SWING: SHORT OPPORTUNITYHi there,
Of all the USD pairs, I think GBPUSD is the weakest and I speculate lower prices.
At the very least, to hunt the equal lows the market created by not taking the previous low just before the monthly FVG. That action is suspect - it will induce buyers and drop more shorts on them.
Anyways, watch out for my next post.
Cheers,
Jabari

GBPUSD TRADE SETUPWait for recent ranging box then make a decision for new entry otherwise skip this setup

GBPUSD sell setupWhen plenty trading reasons or factors come together in this manner, probability of trade been a success becomes high.
On the daily chart, we have retest of a broken trendline, price touching the upper part of a downward channel plus strong resistance level
Let's see how it plays out

GBPUSD analysis GBPUSD ahead of a week is on third bearish Trendline touch,failure to break out of the structure will result in sharp bearish sentiment,while in contrary breakout will high an increased bullish momentum and sentiment

GBP/USD pair on a 4H timeframMy analyzing the GBP/USD pair on a 4H timeframe using the Ichimoku Cloud and Volume Profile (Visible Range), along with marked support and resistance zones. From this image, I can guide you with a target price level, but you'll need to validate with price action confirmation.
Observations:
1. Ichimoku Cloud (Kumo):
Price is currently trading above the cloud, indicating a bullish bias.
However, the cloud ahead is thin and flat, suggesting weak support if a pullback happens.

GBPUSD – Bullish Breaker Setup into CPI & PPI WeekWe’ve just seen a bullish break with strong momentum from the 1.3340s, reclaiming and holding above a 4H Bullish Breaker (1.3341 – 1.3386). Price action suggests a shift in order flow to the upside, with buy-side liquidity objectives in sight.
Key Context:
The Bullish Breaker aligns with prior resistance turned support.
Strong displacement after the break, indicating algorithmic buying.
Price is consolidating just above breaker high, holding structure.
Upcoming US CPI (Tuesday) and PPI (Friday) could inject volatility, potentially fueling continuation.
Entry might form as soon as early as Monday London or latest NY kill zone.
Targets:
Buy Side Target 1: 1.3587 – first liquidity pool above recent highs.
Major Buy Side: 1.3788 – larger weekly liquidity draw.

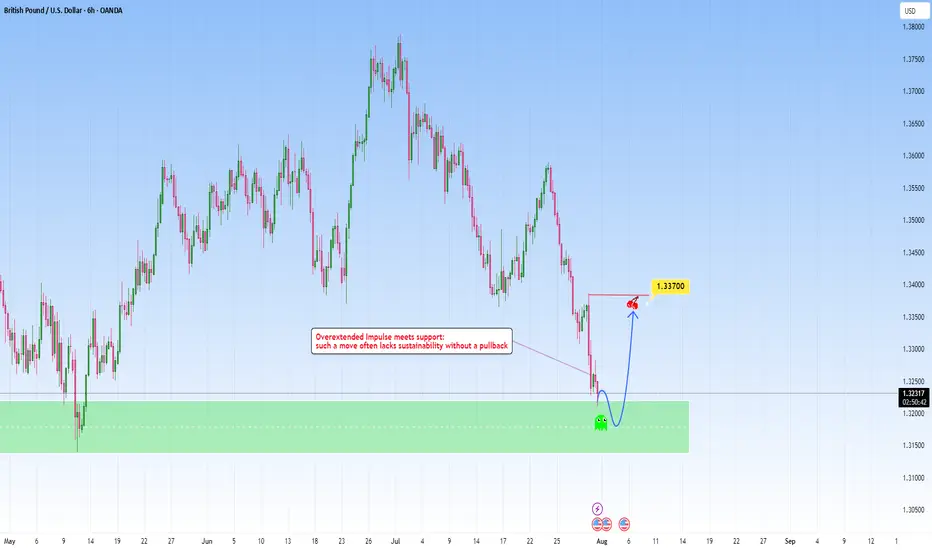
GBPUSD: Overextended move meets with supportAfter a steep and aggressive sell-off, price has tapped into a clear zone. This recent move wasn't gradual: it was impulsive and sharp, which tells us one key thing: exhaustion is likely.
The overextension into it without any meaningful pullback typically highlights imbalance, where price moves ahead of structure and becomes vulnerable to correction. But price doesn’t move in straight lines forever. Markets that fall too quickly tend to burn out just as fast. When such aggressive pushes meet with a clean, resistance like this one, they often trigger the exact opposite, a snapback correction.
I am now watching for signs of absorption and accumulation. This could play out in the form of sideways candles, wick rejections, or a sudden reversal spike. These are early signs that smart money might be stepping in.
My projected target would be toward the 1.33700 area, from the last impulsive drop. It’s a classic mean reversion setup, not just technical but psychological. Traders who chased the move late may find themselves trapped, fueling the correction as they’re forced to exit.
Fibo cluster on GBPUSD short position 70+161 fibo cluster short sell tit sl the close of 4h candle above the cluster zone

GBPUSD H4 OUTLOOKaccording to H4 analysis GBPUSD market is fowwling in Trade line and Now market will be back from RESISTANCE POINT it is the best chance to go short from resistance level dont be greedy use money management
TRADE AT YOUR OWN RISK
REGARD ALBERT

GBPUSD – Trendline Broken, More Downside Ahead?Hello traders! What’s your take on GBPUSD?
The GBP/USD pair has broken below its long-term ascending trendline and is now trading beneath a key resistance zone. After a failed breakout at the newly formed trendline, price quickly reversed and dropped sharply.
This resistance zone previously acted as a strong support level but has now been flipped to resistance. If price fails to reclaim this area during the next pullback, the bearish outlook will be further confirmed.
💬 Do you think GBPUSD will bounce from the 1.32 region, or will it continue falling toward the lower targets? Share your thoughts below!

GBPUSD SELL SETUPI EXPECT THE PRICE Will fall as we have bearish flag has been broken
and we have down trend and we have supply

A Simple Structure Trading Opportunity I like to keep my trading simply and it doesn't get any simpler than this.
IF price action can break & closes beyond the current level of structure resistance, THEN I would expect that price will travel higher... Yeah, that's pretty much it.
If you have any questions or comments, please leave them below.
Akil
